I am travelling today to Tokyo and have little time to write here. But with…
GDP growth but black clouds on the horizon
Today the Australian Bureau of Statistics released the December quarter National Accounts data which gives us the rear-vision mirror view of how the economy has been travelling at a distance of 3-months. The data confirms that the Australian economy sidestepped the global economic crisis with just one negative quarter of real GDP growth and is moving towards trend growth. However, restoring trend growth is nothing to be proud of. The fact remains that the current performance of the Australian economy will not be sufficient to achieve and sustain full employment. The RBA claim yesterday that getting back on trend growth is a justification for tightening monetary policy just reinforces the neo-liberal policy dominance – that some underutilised labour is required to fight inflation. While the RBA monetary policy tightening will not help growth, the real threat to our prosperity will come in the May budget when the federal government will announce its fiscal austerity plans. Combined with the deflationary impacts of similar moves by other governments and the impending meltdown of the EMU region, the GDP growth we are enjoying today may not persist. And all this will be driven by the mindless ideology of the deficit-terrorists.
ABC News reported that:
Australia’s gross domestic product (GDP) grew 0.9 per cent in the December quarter, and 2.7 per cent over the past year. The Australian Bureau of Statistics official economic growth figures put Australia well ahead of most other developed economies which had negative growth in 2009.
They quoted a bank economist who said that “the Federal Government’s stimulus drove much of the fourth quarter growth … [and] … It has the Government’s fingerprints all over it, as their stimulus spending and tax breaks boosted investment. But that was well timed and just testifies to how successful policy stimulus has been in Australia.”
Any examination of the data leads you to this conclusion (see below).
So deficit-terrorists – shut up!
While all the domestic spending components are now showing positive growth – and the majority opinion is that the confidence boost provided by the government support has helped private spending to recover quickly – the “biggest drag on the economy came from the wider trade gap, with the rise in imports subtracting 1.6 percentage points from the growth – a contribution more than matched by domestic activity”.
The future however is less than clear. With the RBA tightening monetary policy the sensitivity of household borrowing may be stronger now than in the previous recovery periods. This is because the households are still carrying record levels of debt and there has not been significant de-leveraging in the downturn evident. Some but not much! The probability of bankrupcty (at the margin) is now much higher than it was when the RBA tightened after the 1991 recession.
So the consumer recovery may be muted.
Also the investment growth was dominated by inventory rebuilding and that process is finite. Once inventory levels recover to their normal states firms that source of growth will cease.
Finally, there is the May budget. The Australian government is buying into the fiscal austerity obsession that looks like derailing World growth in the coming year. They have already committed to imposing a 2 per cent cap on spending growth in the 2010-11 budget and this will stifle the public contribution to demand.
With the World on the brink of a double-dip recession all this suggests that our easier road is about to get harder.
With labour underutilisation rates still around 13.5 per cent in Australia it is madness to withdraw the fiscal stimulus now. See more on this below.
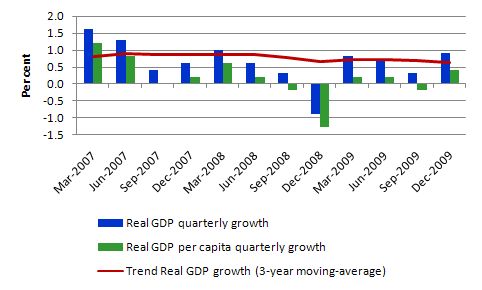
The following graph shows the quarterly percentage growth in real GDP from March 2005 to December 2009 (blue columns), the quarterly growth in real GDP per capita (green columns) and the red line is the 3-year moving average of real GDP which gives some idea of the trend quarterly growth rate in real GDP by smoothing out the short-term fluctuations.
The data thus reveals that quarterly real GDP growth is back on trend (computed as a 3-year moving average) but the growth in real per capita GDP is much more muted.
In terms of living standards, while annual real GDP growth was estimated to be 2.7 percent (between December 2008 to December 2009), the ABS reported that growth in real net national disposable income was minus 1.2 per cent. In other words, we all suffered a loss.
In this regard, the ABS said:
A broader measure of change in national economic well-being is Real net national disposable income. This measure adjusts the volume measure of GDP for the Terms of trade effect, Real net incomes from overseas and Consumption of fixed capital … During the December quarter, trend Real net national disposable income increased 0.6%, with change over the past 4 quarters at -2.0% compared to 2.0% for GDP.
So the trend is below that actual seasonally-adjusted measure which doesn’t augur well for the future.
Of-course, the trend rate of growth (computed as a 3-year moving average) doesn’t relate to the labour market in any direct way. The late Arthur Okun is famous (among other things) for estimating the relationship that links the percentage deviation in real GDP growth from potential to the percentage change in the unemployment rate – the so-called Okun’s Law. The algebra underlying this law can be manipulated to estimate the evolution of the unemployment rate based on real output forecasts. Please read my blog – What do the IMF growth projections mean? – for more discussion on how the required GDP growth rate is conceived and calculated.
The summary approximate rule of thumb that emerges is that if the unemployment rate is to remain constant, the rate of real output growth must equal the rate of growth in the labour-force plus the growth rate in labour productivity. It is an approximate relationship because cyclical movements in labour productivity (changes in hoarding) and the labour-force participation rates can modify the relationships in the short-run. But it should provide reasonable estimates of what will happen.
So the sum of labour force and productivity growth rates is referred to as the required real GDP growth rate – required to keep the unemployment rate constant.
Remember that labour productivity growth (real GDP per person employed) reduces the need for labour for a given real GDP growth rate while labour force growth adds workers that have to be accommodated for by the real GDP growth (for a given productivity growth rate).
I should add that the required GDP growth rate is dependent in part (by construction) on the labour productivity growth estimates. In recent years, labour productivity growth has been lower than in the past because of the dumbing down of the labour market – the dominance of service sector employment and the dominance of casualised work within that compositional shift. The rising underemployment that Australia has experienced since the 1991 recession and which accelerated in the current downturn is evidence of this shift in employment quality.
As a result, it is easier for the Australian economy now to meet the required real GDP growth rate because our labour productivity rates are that much lower. However, in terms of growth in material standards of living, it is labour productivity growth that matters.
Quite apart from the distributional theft that has been going on where real wages growth has been suppressed in relation to labour productivity growth by neo-liberal legislation which have undermined the capacity of labour to maintain the historical share in national income – see blog – The origins of the economic crisis) – the falling productivity growth has limited our options. See below for more distributional analysis.
This is another example of the destructive impacts of the neo-liberal deregulation agenda – the shift in national income shares has clearly allowed the “financialisation” of our economy to expropriate ever increasing chunks of real output without a commensurate contribution (given that the financial sector adds virtually nothing to real GDP growth – it just redistributes mostly – to itself!) – has also undermined the real living standards of the majority over time by slowing down the rate of labour productivity growth. This trend is common across almost every economy.
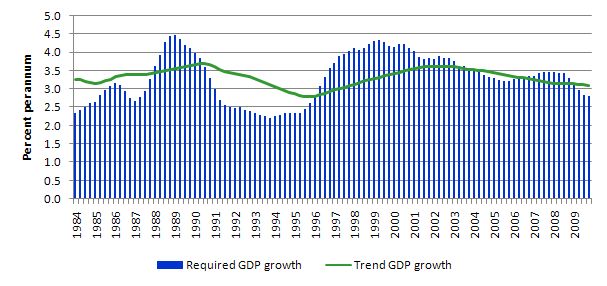
In terms of the graph, the impact of the 1991 recession is very clear. But in the current period, even though real GDP growth is getting close to be back on its recent 12-quarter trend it is still inadequate in terms of the rates needed to reduce the labour market slack.
The computation of the required GDP growth rate is somewhat arbitrary but to provide a trend picture (matching the trend rate of GDP growth) the following graph shows the 3-year moving average of the sum of labour force and labour productivity growth on a quarterly basis since March 1985 up until December 2010 and the 3-year moving average of real GDP growth (annualised).
So when the green line (required) is above the blue columns (trend) there will be a tendency for the unemployment rate to rise and vice versa unless hours adjustment are significantly higher than adjustment of persons employed.
So while the RBA yesterday (see blog – Interest rates up – but its messy) seemed content to start slowing the national economy down – according to its own logic of pushing interest rates up to deflate aggregate demand – because the growth rate was nearly back on trend – the reality is that the trend growth is not even sufficient to really eat into the 13.5 per cent labour underutilisation rate.
Which reinforces the view I have that we have learned very little from this crisis in terms of allowing and freeing ourselves of the irrational belief that inflation is about to accelerate out of control and we need to keep some degree of labour market slack in the form of unemployment and underemployment to “discipline” the inflation process – even though this is a very costly exercise in real terms.
A comparison of the real costs of this strategy is never made – and ideology in the form of the flawed NAIRU logic is just asserted that the long-term real costs of the strategy (deliberately using labour market slack) to hold inflation in check are zero. You read that correctly – the mainstream believes there are no long-run costs of unemployment. All swings in unemployment are considered transitory, of minimal impact, and the results of voluntary choices anyway. Please read my blog – The Great Moderation myth – for more discussion on sacrifice ratios and why deflationary monetary policy strategies generate permanent and significant real deadweight losses.
What is driving growth?
Table 8 in the ABS National Accounts publication for the December quarter shows the contributions to GDP growth. The following three graphs provide different perspectives on this issue.
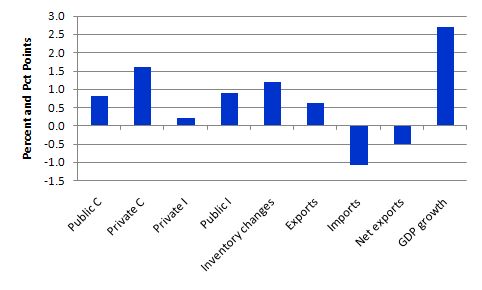
The first graph shows the contributions to the annual change in GDP from December 2008 to December 2009. GDP growth is in percent and the contributions are in percentage points. They do not sum to the total because of the existence of the statistical discrepancy.
The data just verifies what I said in the introduction with respect to the contribution of the government stimulus efforts. Note also the inventory contribution.
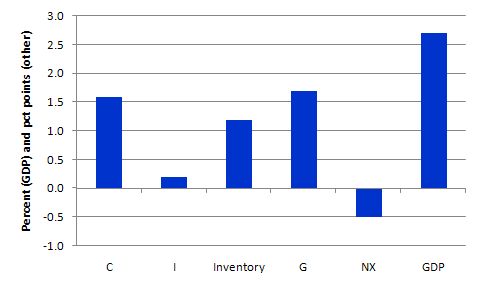
To provide more relief to the public versus private contribution, the following graph aggregates the components into standard aggregate national accounting categories. You can see that the dominant driver of real GDP growth over the last year has been the contribution of the government sector (both investment and consumption).
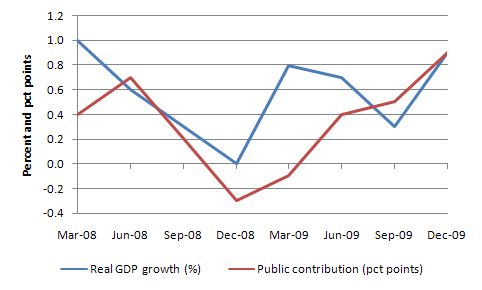
The following graph shows the contribution of government spending (percentage points) to real GDP growth (per cent) since March 2008 – which is when the crisis really started to impact on Australia. Once again imagine where we would have been without the stimulus packages which boosted goverment net spending from late 2008 onwards.
Finally, on contributions, the ABS reported that for the December 2008 to December 2009 period the expenditure-based statistical discrepancy was a -1.4 percentage points contribution – this is the error that arises between the three ways of assessing the national accounts. The ABS define it as being “calculated as the differences between aggregate incomes, expenditures, or industry products respectively and the single measure of GDP”.
So given the relative size of the expenditure-based statistical discrepancy, don’t be surprised if there are not some revisions next quarter to the current estimates. These are survey results after all and put together from a number of different sources of survey information, some of which is only guessed at the time of publication and firm up afterwards (and therefore comprise the basis of the revision).
We haven’t learned – distributional shift to profits continues
The ABS now compute as a regular addition to its quarterly national accounts a measure of real unit labour costs – which otherwise indicate the wage share in national income.
They describe this measure in the following way:
Unit labour costs (ULC) represent a link between productivity and the cost of labour in producing output. A Nominal ULC measures the average cost of labour per unit of output while a Real ULC adjusts the nominal ULC for general inflation. Positive growth in a real ULC indicates that labour cost pressures exist.
Real unit labour costs (RULC) are identical to the wage share in national income and are constructed in the following way. ULC = Wage rate times employment divided by total output = W.L/Y. Note that L/Y is the inverse of labour productivity. RULC = ULC/P (where P is the price index). So RULC = (W.L/P.Y), that is the wage share (W.L is the total income payments to labour and P.Y is GDP). It can also be written as (W/P)/(Y/L), which is the ratio of the real wage (W/P) to labour productivity (Y/L).
In the 1970s it was thought to be a valuable measure to test the proposition that real wages growth in excess of labour productivity (so RULC rising) would cause unemployment. This was the prediction of the erroneous mainstream (neo-classical) marginal productivity theory. So there was an industry of economists running regressions and drawing graphs etc to show that when RULC rose employment fell – just as they told the Keynesians it would!
The problem with all that hoo-ha was that RULC is a somewhat ambiguous measure because its movements are influenced by both the numerator and the denominator and the latter is highly pro-cyclical – that is, it falls in a recession and rises in the boom (because of hoarding).
So RULC can fall because the real wage is falling as a result of discretionary policies to deregulate the labour market and attack unions. But, equally, it can fall because the economy is booming and productivity growth is strong. So correlations between RULC and employment will render what is referred to as “observational equivalence” with respect to macro theories of employment. Both the mainstream and Keynesians predict a negative correlation between real wages and employment but for vastly different reasons. Anyway, that is all as an aside.
The latest estimates for the December quarter 2009, show that RULC decreased by 1.3 percent while the trend Non-farm RULC decreased by 1.7 percent. The ABS say that the “Non-farm measure is generally preferred as it removes some of the fluctuations associated with Agriculture”.
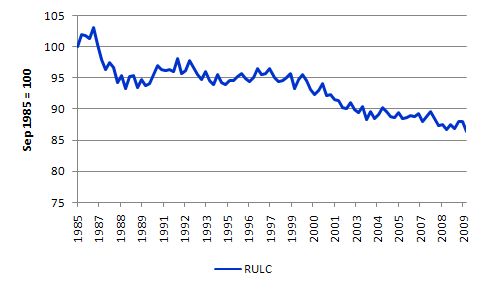
The following graph shows the evolution of RULC (the wage share in national income) since September 1985 in index number form (September 1985 = 100). It shows the continuous redistribution of income from wages to profits which I document as one of the characteristics of the neo-liberal period that led to the current crisis. Please read the blog – The origins of the economic crisis – for more detail on this point.
In historical terms, this redistribution is very large and unprecedented – another atypical behaviour – which the neo-liberals have tried to condition us is just normal. It is not! This trend along with the rapid increase in household indebtedness and the obsessive pursuit of budget surpluses are all historically atypical behaviours – which have to be reversed if we are to avoid further crises of the type that has recently crippled the World economy.
I do not believe that the households can absorb the real output that is being produced by the economy under these distributional trends without having to continually increase their debt levels. Real wages growth has to come back into line with productivity growth to ensure sustainable growth is achieved and this means one thing – there has to be a rather significant shift in the wage share upwards.
The reality is that this can only be accomplished if real wages growth is allowed to track labour productivity growth. That will require a paradigm shift away from labour market deregulation, anti-labour legislation and trade union bashing.
I don’t see that happening any time soon and combined with our failure to take a serious position on financial market reform and our obsession with fiscal austerity – it is clear we are setting our economies up for the next crisis. Conservative ideology triumphing over good economics.
Reflections on the government stimulus rescue
I did a radio interview late yesterday from my new beach hideaway office (yes I was actually working) about the impacts of the fiscal stimulus package. The argument being presented by the ABC presenter was that we might have been better off without the package because the government footprint has distorted prices and been an adminstrative disaster.
On this theme, Sydney Morning Herald’s economics commentator Ross Gittins said his article today (March 3, 2010) – Rudd pays for avoiding recession:
Years ago a central banker explained to me that, in his bank’s efforts to keep the economy from being blown off track, it was never a good thing to be too successful. Really, I said, why not? Because if you’re too successful at eliminating evidence that the economy had a problem, it won’t be long before people are questioning why you took the steps you did when, clearly, there was never a problem.
I agree with this. The tack taken by the ABC presenter yesterday reflected this sentiment. I made the point that it is possible that some parts of the stimulus intervention (a relatively minor proportion of total funds spent) were problematic in terms of adminstrative issues. I refer to the now-scrapped insulation program. There has been a major beat up about this program in the media but the facts are in dispute. I would conclude it wasn’t a very good program but the facts that are available are very blurred.
But the point I made was that large-scale stimulus interventions of the type taken by the Australian Government – which in international terms was early and large relative to GDP – are very complicated and you can expect some administrative inefficiencies. Imagine if the private sector had to ramp up investment spending within a quarter or so – what do you think would be the outcome of those projects.
I also indicated that the neo-liberal era has been marked by a major reduction in Departmental capacity to design and implement fiscal policy – given the obsession with monetary policy and the major outsourcing of “fiscal-type” government services to the private sector. Many of the major Federal government policy departments are now just contract managers for outsourced service delivery. So with the voluntary reduction in “fiscal space”within the federal government over the last 20 years or more it is no surprise that the overall capacity of the government machine to implement efficiently and speedily complicated nation-wide infrastructure programs has been diminished.
This is a lesson for the future in my opinion. We can no longer deny that fiscal policy is required to address serious swings in private spending. Monetary policy has been proven – categorically – to be ineffective in dealing with aggregate demand failures of the sort we have witnessed in the current crisis. In that context, governments must develop forward-looking capacity to ensure that it has project implementation skills when they are required.
Having said that, I also pointed out in the interview that while complex interventions will not be perfect in design or execution you have to consider what would have been the case if we had have followed the Chicago school (or the Harvard school) line – and left it to the private market to sort the mess out. It is clear to me that we were facing a repeat of the Great Depression such was the damage to the financial system and the plunge in real output in the major economies.
Finally, the Australian downturn was less severe than we thought at the time of the intervention. It is easy to look back with the benefit of the 20-20 vision and say that in some areas too stimulus was provided. I was asked about the price distortions in the trades area where builders and plumbers etc that are working on public infrastructure projects are now reportedly charging increased fees to contract private work. I questioned the veracity of that claim in fact – given the data doesn’t show any major blowout in labour costs etc.
But the major point is that at the time the stimulus packages were designed and announced, the Government believed we were on the precipice of another Great Depression. The international events demonstrate that the crisis has been very severe. So the government rightly assumed that there would be major idle labour skills available to be brought back into productive work. That was a reasonable assumption and the fact that the downturn hasn’t been as bad as that demonstrates that the fiscal stimulus has been very effective.
However, I concluded by saying that I would have concentrated the stimulus on efforts to provide public sector jobs to the most disadvantaged workers who bear the brunt of unemployment and underemployment. They are still idle and without sufficient income. It would have delivered much more to the economy than competing for tradespersons with other “private” demands for those services, however, weak they were at the outset of the crisis.
But while Gittins gets that part of the story correct, don’t think he has a sound grasp on things in general. Here is a giveaway paragraph in today’s article:
Obviously, Rudd had a lot of help – from the Reserve Bank and the alacrity with which it slashed interest rates, from the good shape of the budget he inherited from the Howard government and from the rapid bounceback by China and our other Asian trading partners.
Conclusion: same old mis-guided gold standard thinking. First, the monetary policy easing has been shown by Treasury to be a minority feature of the aggregate demand recovery.
Second, the budget the government inherited from the previous conservative government (10 surpluses in 11 years) provided no extra financial capacity to the present government to net spend and underwrite the recovery. They could have engineered the same intervention even if they had inherited 11 years of deficits.
The point Gittins is making relates to the low levels of public debt that the present government “inherited”. All that indicates is that the previous government had squeezed the wealth holdings of those in the private sector.
In this regard, the surplus obsession was not healthy at all and contributed to the degradation of public infrastructure and the decline in quality public services, not to mention the persistently high labour underutilisation rates in Australia. By continually squeezing the private sector of liquidity, the surpluses also provided the dynamic for the latter to increase its debt levels to maintain spending growth. That strategy was unsustainable and contributed to the crisis we have recently endured.
Conclusion
Any real GDP growth is good news. But the fact is that it is still insufficient to absorb the pool of underutilised labour.
The fact that it getting back on trend just reinforces the neo-liberal dominance on our thinking. The past trend was inadequate in terms of the available labour preferences for more work. We needed to change our mindset and aim for higher employment growth.
The RBA’s actions to tighten monetary policy yesterday because GDP growth was “nearing trend” only reinforce my view that we haven’t really learned much from the downturn.
And the real threat to prosperity will now be revealed in the May budget when the federal government will announce that we are out of the recession and it is time for fiscal austerity. Combined with the deflationary impacts of similar moves by other governments around the world and the impending meltdown of the EMU region, the GDP growth we are enjoying today may not persist into the next year.
If the world double-dips and our government persists in its obsession to get back into surplus post-haste, the future is less than bright. And we can blame the mindless ideology of the deficit-terrorists for the damage.
Digression: Look what turned up today!
Today I was working away at my mobile office located at a cabin in the sand dunes near Elizabeth Beach, NSW (just around the corner from Boomerang Beach) when a visitor turned up to look around (probably to check up whether I was working or not).
Here he/she is (click for bigger picture):
It just looked around and then shuffled off. We have seen versions of this animal while up the coast in the past which are 2 metres long and they run like the wind.
Admin note:
I am investigating increasing the font-size to all the ageing readers. It might need a re-coding of the theme though. We will see.
Anyway, that is enough for today!
The surf beckons.

Hi Bill,
Very interesting entry. As someone coming at this from the general position of ignorance and confusion engendered by the mainstream media I have some difficulty untangling in my mind the extent of what constitutes fiscal stimulus. My reflexive thought is stuff like directing public money at building bridges and roads. As you are aware, in the UK, where I live, the Government has “had to” support a number of very large banks which were in difficulties (was that remotely necessary or should the Government have dealt with the banking crisis in a different way?). It has also introduced “quantitative easing” (which I am not sure I even understand properly as I suspect the overwhelming majority of the British population does not). These kinds of measures are often presented in the media as either direct forms, or sometimes akin to, fiscal stimulus. Would it be possible for you, or perhaps a veteran here, to give me some insight into the relation between these kinds of measures and fiscal stimulus? Even if they answer is “they aren’t and here’s why”.
Frolix22,
You are probably looking for a straight and direct answer. I am sorry I am not qualified to give that even from an amateur point of view. However I do recommend on the right handside, the panel that says categories and clicking “Debriefing 101” and reading every entry in there. Again and Again and Again. It wouldn’t hurt to hit the “Q&A” either. This is what I do and I’m still not 100% up to speed on the basics.
If this doesn’t help, I’m sure others will come along and give you the more direct answer you are looking for.
Regards,
Senexx
Thanks Senexx,
You are right, it is my responsibility primarily to use the extensive resources here to become informed. I suppose the tendency (somewhat forgiveable I hope!) is to have a specific question occur to one and then hope to get a ready answer to it to assuage a particular state of puzzlement. It is a form of impatience, I think, on my part. I am sure most of the (currently undoubtedly very basic) questions which are likely to occur to me would be answered by a systematic reading of the resources you have pointed out. I’ll get to it.
Best Regards
ctrl-+ works well for changing font size, at least in firefox (and you really wouldn’t want to be using MS IE on the open roads of the information super-highway). I’m not an elder reader (yet), but after 20+ years of reading computer screens I tend to make the fonts bigger on most sites.
Thanks for an interesting read, although you’ve got a few truncated sentences in there, e.g.
“… have followed the Chicago school (or the Harvard school) line – and left it to the private market to sort the mess out. It is clear to me that the”
I struggled with small fonts as well and I know pretty well that every normal browser supports font scaling.
I normally use google Chrome browser and I discovered that this browser remembers font settings for each site. So once you scaled fonts for any site (and this site scales really well which means a high quality design) you will have any page from that website scaled to your settings.
Revolt – Selfish
Dear Bill,
Be careful with the fonts – because as you said, you may have to change the theme as well! This blog has the cleanest interface anywhere in the blogosphere.
Bill:
I agree with Ramanan that this blog has an extremely pleasing, very readable and clean layout. If I am reading on my tiny laptop, I just use CTRL+ to increase and CTRL- to increase/decrease the font (Firefox) – I believe all modern browsers have similar capabilities.
As to what a private ramp up of fast investment might look like (to compare to the AU insulation program), I would point to Toyota and their ongoing auto recall in the US (don’t know if this was internationally). They have received a lot of criticism over their recall process. The point here being that the neither the private sector nor the public sector can scale real investment quickly without some inefficiencies. Now, the financial sector appears to be able to scale new products extremely quickly, but the damage those products do is by design, so while one can be critical of the outcome, you have to admire their ability to get the results they intend.
A bit off topic, but I was thinking about the increase in health care costs (here in the US premiums are now hitting 15% – 30% annual increases) and I wonder: why are health care costs increasing? Doctors and nurses aren’t getting huge pay rises, utilization is decreasing, there is no privatization of external costs – I can’t understand why. I wonder to what extent premiums are being increased to offset losses in investment income (where insurance makes most of its income) and whether portfolio composition of insurance companies (I imagine they had to of held securitized real estate mortgages, CDS, etc.) are driving health care “cost” increases. I know this isn’t the focus of this blog, but perhaps a reader might point me to a relevant link.
Like the lizard, but not as cute as a Bilby.
Ha!!
Just started to read Yves Smith Naked Capitalism and ran into this:
http://www.nakedcapitalism.com/2010/03/antidote-du-jour-14.html
Dear Lefty,
you are right
(OFF TOPIC a little)
Insulation fire risk was worse before rebate
http://www.smh.com.au/opinion/politics/insulation-fire-risk-was-worse-before-rebate-20100303-pivv.html
pebird. this american life, a great chicago radio program, did a fantastic two part series on why american health care costs so much. if you have the time i could not recomend enough you listen to it. you could also use the brief decriptions to skip to the part you want to listen to. http://www.thisamericanlife.org/Radio_Episode.aspx?sched=1320
http://www.thisamericanlife.org/Radio_Episode.aspx?sched=1321
Bill,
MMT is taking off
http://www.creditwritedowns.com/2010/03/going-off-on-rogoff-there-is-no-hard-debt-constraint-for-fiat-currency.html
I think you wrote a very similar article few days ago. He (Marshall Auerback) does not mention you in the blog but does link to you in the comments
Dear hrvoje,
I see that Auerback says \”No Hard Debt Constraint\’ so maybe it means there is only a soft debt constraint since there is after all a debt but no problem for fiat currency as MMT points out. \”Government debt\” was always a problem for me until I got my head properly around MMT. So I think it is more appropriate to call it soft debt as opposed to hard debt which normal households can have.
Thanks for the link:
Going Off on Rogoff – There is No Hard Debt Constraint for Fiat Currency
Posted by Marshall Auerback on 2 March 2010 at 6:15 pm
Oh man- check out Rogoff in the AFR today claiming Japan’s fiscal position is unsustainable.
You would think that with almost 20 years of consistent annual budget deficits, and the sky remaining in place, he would find something else to squark about.
Heaven forbid it might even classify as a ‘counter factual’ to the debt and deficits thesis contained in his latest book.
More fodder for Billy blog, I wonder if they get the AFR at Boomerang Beach?
Dear Hrvoje/Graham,
Thanks for pointing out my piece which ran at http://www.newdeal20.org and also
http://www.creditwritedowns.com/2010/03/going-off-on-rogoff-there-is-no-hard-debt-constraint-for-fiat-currency.html
I should point out that the piece was edited and pared back the link to Bill Mitchell’s analysis on this very topic, but I did want to make clear that Bill (as is often the case) was an excellent source of material and intellectual input for the critique of Rogoff (as was my friend, Randy Wray). This particular analysis by Bill (https://billmitchell.org/blog/?p=8322#more-8322 ) was invaluable, because it goes into great detail describing the situation in Argentina, Russia, etc. Very seldom do economists make the kinds of excellent distinctions made by Bill, and his work in this area is particularly illuminating.
I’m pretty fastidious about linking to my references but in this particular instance had to pare back my piece by 400 words and sliced out the paragraph which specifically quoted Bill and link to his article, so I wanted to make that clear as I’m always delighted to give Bill full credit for the insights he has provided to me (although he should never be held responsible for anything I write!).
Hi Graham.
While evidence of incompetence by government may yet be uncovered, I suspect it is likely that the insulation programme is simply a casualty in the battle of ideas.
The hysterical claims issuing from the media that the programme was so poorly put together that it was a deadly risk to both life and property, that it was absolutely rife with shonks and fraudsters and better yet – I saw this on Sunrise this morning – that there may be significant organised crime involvement in the programme, all appear to have one thing in common.
Scarcely the slightest attempt is made to substantiate any of the claims. Almost nothing in the way of evidence is offered to support the allegations. Any investigative journalist worth their salt should have been able to easily uncover how the safety record of the programme shapes up compared with the safety record of the industry previously (as at least on professional statistician has done). When I submitted a comment suggesting this to a blog at a well-known Australian newspaper, the blog was quickly closed to comment and has not to my knowledge been re-opened.
Perhaps I will send them another email suggesting the next logical headline (if they haven’t thought of it already): TERRORISTS USED INSULATION PROGRAMME AS COVER TO SMUGGLE NUCLEAR MATERIAL.
The senseless braying of the media pack on this issue reminds me of the way they are (in general) portraying the deficit.
From the outset they have displayed strong, ideological opposition to fiscal activism – and the programme was a part of that. My feeling is that this extrordinary beat-up is politically and ideologically motivated, an assault on what they (wrongly, on a number of levels) percieve as “a waste of taxpayers money” and “a gaurantee of higher taxes in future”.
If I am proven wrong, so be it. But I feel that this is the most likely explanation.