Today (June 3, 2026), the Australian Bureau of Statistics (ABS) released the latest - Australian…
US National Accounts – growth contracts but likely to be temporary
People are closely watching the US data at present to see what the impacts of the recent tariff decisions by the new US President might have. I am no exception. Yesterday (April 30, 2025), the US Bureau of Economic Analysis published the latest US National Accounts figures – Gross Domestic Product, 1st Quarter 2025 (Advance Estimate) – which provides us with the first major data release since the new regime took office. The fact though is that this data cannot tell us much about the tariff decisions, given that Trump’s – Executive Order 14257 – only really became operational on April 4, 2025, although there had been some earlier tariff changes before then.
An Aside
Last week, I detected the first impacts of what I assume are the DOGE effect.
I regularly use US Department of Health data and reports for work that I do on occupational health risks etc.
Last week, I returned to that data source to get some information and I found that all the reports have disappeared and I just received Apache server 404 error notices.
Just a few months ago all that information was available.
Today, I sought out the long-standing ‘interactive data’ capacity from the US Bureau of Economic Analysis, the body that publishes all the National Accounting data.
This is what I found:
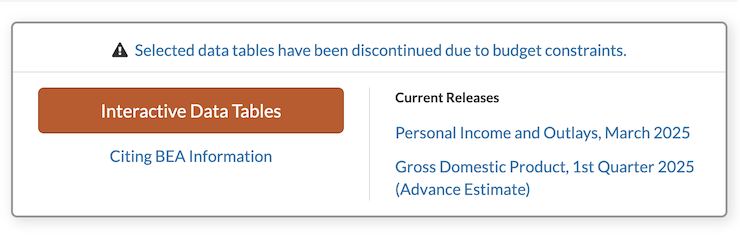
I think these two instances in my interaction with the US data sources in the last week signal that there are problems ahead for researchers.
Introductory National Accounts comments
The US Bureau of Economic Analysis media release – Gross Domestic Product, 1st Quarter 2025 (Advance Estimate) said that:
The decrease in real GDP in the first quarter primarily reflected an increase in imports, which are a subtraction in the calculation of GDP, and a decrease in government spending …
Compared to the fourth quarter, the downturn in real GDP in the first quarter reflected an upturn in imports, a deceleration in consumer spending, and a downturn in government spending that were partly offset by upturns in investment and exports.
This is the first interesting point that confuses people.
Imports are what economists refer to as a ‘leakage’ from the domestic income-expenditure cycle.
So incomes are earned by supplying productive inputs to the firms etc and if all that income was recycled back each period in the form of domestic expenditure then the cycle would perpetuate.
Producers’ decisions to produce and pay inputs would be realised through sales.
However, imports represent domestic income earned that is being spent on goods and services produced abroad, so they constitute a ‘leakage’ from that domestic income-expenditure cycle.
Unless they are offset by an ‘injection’ from outside that cycle – for example, business investment, export income, and/or government spending, then the economy contracts because not all the domestic income generated comes back to local producers in the form of sales.
That is why import expenditure is a negative contributor to GDP growth and that is exactly what has happened in the March-quarter 2025 in the US.
The decline in GDP as a result of the significant growth in import expenditure clearly reflects the expectations of importers of the tariff rises that were to come.
That is likely to be a one-quarter effect, and, as such, does not signify that a recession is imminent.
To make a case that there is an impending recession, we need to look into the major spending aggregates: household consumption, investment spending, and government spending (see below).
The BEA also noted that the bushfires in California in January 2025 “disrupted consumer and business activities and prompted emergency services and remediation activities” although they said it was “not possible to estimate the overall impact of the California wildfires on first-quarter GDP
This is an interesting point.
National accounts cover flows of expenditure, not asset stocks (real or financial).
So while the bushfires were devastating in terms of property loss the BEA note that the “destruction of fixed assets, such as residential and nonresidential structures, does not directly affect GDP or personal income”.
The summary result from the March-quarter advance estimates are:
- The BEA say that real GDP declined by 0.3 per cent on an annualised basis and 0.1 at the quarterly rate.
- The March-quarter 2024 to March-quarter 2025 growth rate was 2.1 per cent.
- Quarterly growth in personal consumption expenditure was 0.4 per cent (down from 1 per cent last quarter), whereas the annual growth was steady at 3.1 per cent.
- Business investment grew by 5.1 per cent (up from -1.4 per cent); Annual growth was 3.8 per cent (up from 3.4 per cent).
- Government spending growth was minus 0.4 per cent (down from 0.8 per cent); Annual growth was 5.3 per cent (down from 5.8 per cent).
- Exports grew by 0.4 per cent for the quarter (up from zero); Annual growth was 2.7 per cent (down from 3 per cent.
- Imports grew by 9 per cent for the quarter (up from -0.5 per cent; Annual growth was 5.9 per cent (up from 1.7 per cent).
Note that the BEA typically quotes the ‘annualised quarterly figure’, which is calculated by simply multiplying the March-quarter outcome of -0.1 per cent by 4.
The alternative, that most agencies quote, is the actual annual (year-on-year) growth rate which is the percentage shift from the March-quarter 2024 to the March-quarter 2025.
That aggregate was 2.1 per cent down from 2.5 per cent in the December-quarter 2024.
While personal consumption expenditure slowed a bit and government spending contracted, business investment was strong as were exports.
So this one-off surge in imports – which economists refer to as a ‘policy announcement’ effect is not yet a signal of recession.
Some graphs
The following sequence of graphs captures the story.
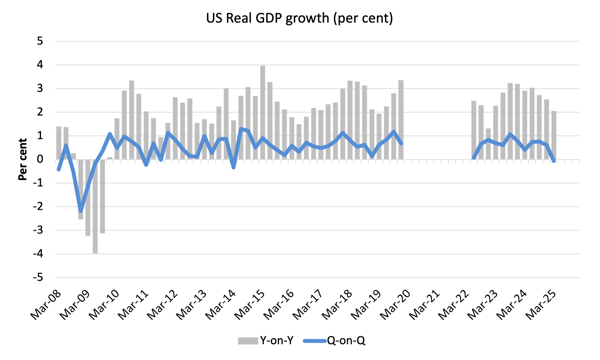
The first graph shows the annual real GDP growth rate (year-to-year) from the peak of the last cycle (December-quarter 2007) to the March-quarter 2025 (grey bars) and the quarterly growth rate (blue line). The quarters March 2020 to March 2022 (inclusive) were excluded as COVID-19 outliers so that you get a better impression of the relative movements.
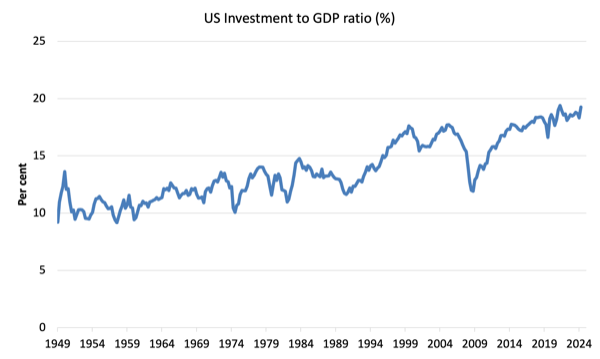
The next graph shows the evolution of the Private Investment to GDP ratio from the March-quarter 1947 to the September-quarter 2023.
The chaos caused by the pandemic is evident as is the stalling performance after the initial GFC recovery.
However, the ratio in the March-quarter 2025 was 19.3 per cent, which is 0.1 points lowest than the highest reading ever recorded in the March-quarter 2020, just before the pandemic hit.
It follows a very strong quarterly growth rate in business investment of 5.1 per cent and a 12-month growth rate of 5.9 per cent.
The investment rate is thus not showing up to the end of March any dramatic ‘fall of the cliff’ dynamic.
The investment growth was dominated by inventory buildup (that is, unsold goods) – see below.
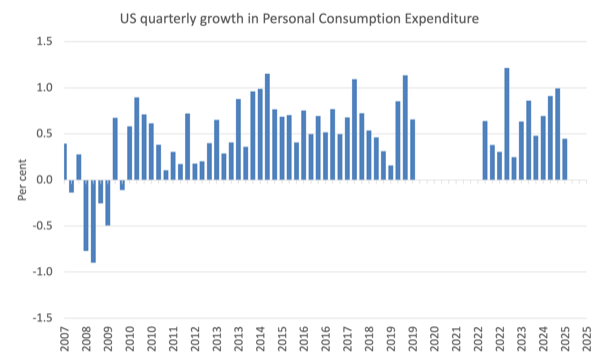
The next graph shows the quarterly growth in Personal Consumption Expenditure from the December-quarter 2007 to the March-quarter 2025 (with the worst COVID-quarters excluded as above).
While there has been a slowing from 1 per cent to 0.4 per cent, the average (excluding the quarters between March 2020 and March 2022) was 0.5 per cent.
And the latter quarters in 2024 were unusually robust in terms of private consumption growth.
So I doubt we can draw anything at this stage about the impact of the Trump administration on this expenditure aggregate.
The Federal Reserve Bank of New York publication – Household Debt and Credit Report – was last updated for the December-quarter 2024 (published February 2025) – (PDF Download).
It shows:
Total household debt increased by $93 billion to reach $18.04 trillion in the fourth quarter … Aggregate delinquency rates ticked up 0.1 percentage point (ppt) from the previous quarter to 3.6 percent of outstanding debt in some stage of delinquency. Mortgage balances rose by $11 billion to stand at $12.61 trillion at the end of December. Transition into serious delinquency, defined as 90 or more days past due, remained stable for mortgages, but edged up for auto loans, credit cards, and HELOC balances. Auto loan balances saw an $11 billion increase to $1.66 trillion in the fourth quarter, while credit card balances increased by $45 billion from the previous quarter to reach $1.21 trillion at the end of December.
There doesn’t appear to be a massive decline in consumer borrowing brewing yet.
Contributions to growth
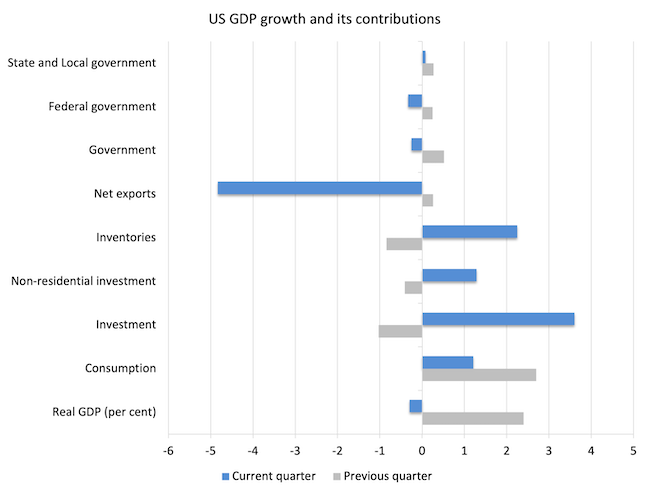
The next graph compares the June-quarter 2022 (grey bars) contributions to real GDP growth at the level of the broad spending aggregates with the March-quarter 2025 (blue bars).
The impact of the increase in import expenditure (via net exports) is dominant.
Further, the investment figure was driven by inventory growth.
The BEA noted that:
The largest contributor to the increase in investment was private inventory investment, led by an increase in wholesale trade (notably, drugs and sundries). The estimates of private inventory investment were based primarily on Census Bureau inventory book value data and a BEA adjustment in March to account for a notable increase in imports.
So that result may be revised next quarter.
However, what we might expect is that the once-off boom in imports will moderate in next quarter’s data (thus reducing the drain on growth), whereas, the inventory accumulation will also decline (thus decreasing the investment contribution to growth).
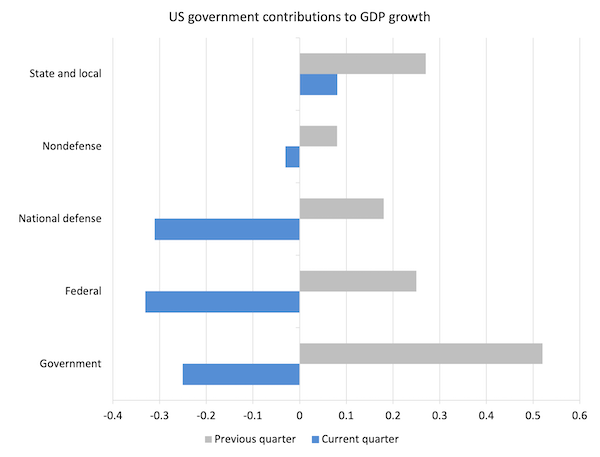
The next graph decomposes the government sector and shows that the negative growth contribution from government was mostly due to declines in defense spending at the federal level.
I do not know what was behind that.
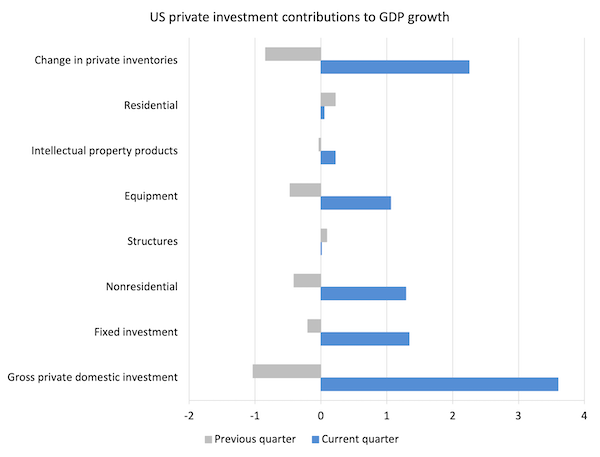
To better understand what is happening with investment expenditure, the next graph breaks down the contributions to real GDP growth of the various components of investment.
Clearly inventory accumulation was dominant but also there was significant investment contributions coming from Equipment and Non-residential overall.
Conclusion
The US national accounts data for the March-quarter doesn’t tell us very much about the likely trajectory of the US economy.
Yesterday’s US national accounts data seems to verify that expenditure behaviour was changed in anticipation of the April tariff announcements – given the surge in imports.
Growth contracted but it was all down to a surge in imports which rendered the contribution to GDP growth of net exports of minus 4.83 points for the quarter – quite dramatic.
The other private spending aggregates were still quite solid, while the decline in government spending undermined growth.
It is thus too early to say anything definitive about the Trump period other than import spending was definitely brought forward, which is likely to be a once-off surge (perhaps with some modest impact in the second-quarter as well, given the April decisions).
That is enough for today!
(c) Copyright 2025 William Mitchell. All Rights Reserved.
Bill,
Is there any chance of you doing a piece on the flaws in GDP as a measure, particularly the ‘Martian colony’ effect.
If you have a Martian colony that receives all its inputs from Earth, and exchanges them for credits, then the GDP figures for that colony will show that consumption has gone up, inventories have gone up, and so have imports (exactly has what has happened in the US this quarter), yet the GDP figure for the colony will be zero because it isn’t producing anything other than credits.
Yet nobody could say that the colony isn’t provisioned, and the standard of living maintained as long as the credits keep flowing and Earth keeps overproducing. Therefore there must be a flaw in using GDP growth as a proxy for improving standard of living. Is there a better way of looking at the figures?
Neil,
Your comment made me think of another possible major flaw in the reported data.
As you may know, the Israeli economist Jacob Assa (among others) argues that the financial and real estate sectors don’t “produce” anything or contribute any “value added” to GDP and therefore should not be included in the calculation of production. In fact, they represent a cost to the rest of the economy and extract value from it, he says.
(He suggests that finance was included in the computation of GDP for political reasons, including to boost the UK’s international standing).
Using Assa’s suggested method of stripping these sectors out of the reported data and treating them as costs, the US and UK economies would be less than 50% of their reported size, IIRC. (Assa’s papers on the subject are very interesting and freely available online).
Hi Professor,
Regarding imports being a negative contributor to GDP growth, I saw some other economists today on the web loudly proclaiming that it has no effect on the GDP. Their rationale being C, I, G have imports baked in them so the negative imports value in the equation is to avoid double counting imports. May you please help me understand the disconnect? Thank you for all you do.
If you want a monetary measure of the new goods and services produced by domestically-located factors of production (i.e., by a nation), go no further than GDP. Simon Kuznets did a great job.
GDP is a poor measure of national income and an even worse measure of national economic welfare.
National income should indicate what a nation can consume from its national product and still be in a position to consume at least as much from tomorrow’s national product. Question: Can a nation consume its entire national product and be in such a position? Answer: No! It must set aside some of what it produces to replace worn-out human-made capital (plant, machinery, and equipment); for defensive and rehabilitative purposes (i.e., to overcome and protect itself from the detrimental side-effects of past, present, and future activities on the nation’s productive capacity); and to allow renewable natural capital to regenerate whilst cultivating additional forms of renewable natural capital to replace depleted non-renewable natural capital (i.e., to keep the total stock of natural capital intact, since natural capital and human-made capital are complementary forms of capital, not substitutes). Clearly, GDP overstates national income. GDP represents total factor payments. Not all factor payments represent income from a national perspective, although they may represent ‘income’ to a factor of production (e.g., labourer). The payments to a person who works in a government road-maintenance department is income to that person. It is an important job, but the resources used to maintain roads are not being used for consumption purposes. Hence, the monetary value of road maintenance is not national income.
Economic welfare is the difference between the benefits and costs of economic activity. GDP counts some benefits; ignores many other benefits (goods and services produced in the informal segment of the economy by unpaid work); falsely counts the timing of benefits ($2,000 spent on a TV does not constitute an immediate $2,000 benefit; the benefits from the TV in future years are benefits, but are not counted in the GDP of those future years); it ignores many costs (costs of unemployment and ecological damage); and includes defensive and rehabilitative activities, which are welfare-maintaining, not welfare-increasing. An indicator called the Genuine Progress Indicator (GPI) provides a better measure of economic welfare.
In the end, GDP is just a means to our ends. It is an important means, but its increase is not necessarily required to satisfy the ends of a wealthy country, but probably required for some time to satisfy the ends of a poor country. GPI studies of wealthy countries are now showing that the additional costs from growing GDP are exceeding the additional benefits. Hence, economic welfare is declining. For wealthy nations, GDP and the GPI used to go up in unison until about the mid-1970s. GDP has continued to rise, but the GPI has not. Worse still for poor nations, the GPI seems to be plateauing at lower levels of per capita GDP (and lower levels of per capita GPI), as per capita GDP increases, than it did for rich nations fifty years ago.
The problem with GDP is the way it is interpreted and used for policy purposes. There is nothing wrong with GDP, although some unproductive activities have crept into the calculation of GDP. Some services provided by the finance and real estate industries are useful (e.g., fees charged to provide a safe place to store savings and to facilitate house sales) and should be included in GDP. Economic rents generated within these industries – and there are plenty of them – should not be included in GDP. In fact, they should be confiscated and destroyed by taxation to begin with.
Dear Mark (at 2025/05/02 at 4:00 am)
The accounting for import expenditure is one thing and they are treated as a separate category to net out the component of C, I and G that is spent abroad.
But the other thing is the actual impact of expenditure that leaves the country whether it be C, I and/or G. That expenditure, however it is accounted for, is a leakage from the domestic income-expenditure cycle and thus reduces the growth rate.
I hope that helps.
best wishes
bill
(you don’t need to post this comment)
Thank you Professor. That clears things up. I appreciate it.