In the 1990s, a new industry was created in Australia. It produced nothing. But it…
Australian Labour Market – steady but signs of a deterioration
The Australian Bureau of Statistics (ABS) released the latest labour force data today (June 19, 2025) – Labour Force, Australia – for May 2025, which revealed that the unemployment rate remained unchanged at 4.1 per cent for the second consecutive month. There was a small decrease in overall employment (-2,500) which was offset by a 0.1 point decline in the participation rate, The net effect was a small decline in official unemployment (-2,600) and a stable unemployment rate. Whether the fall in employment and participation is a signal of a significant slowdown in the coming months is unclear at this stage. Monthly data fluctuates up and down. There was a 1.3 per cent rise in monthly hours worked and significant growth in full-time employment which blurs an easy interpretation of the other changes. Underemployment also fell 0.1 point growth. The broad labour underutilisation rate (sum of unemployment and underemployment) fell to 10 per cent (down 0.1 point) on the back of the declining underemployment. It remains a fact that with 10 per cent of available labour not being used it is ludicrous to talk about Australia being close to full employment. There is substantial scope for more job creation given the slack that is present.
The summary seasonally-adjusted statistics for May 2025 are:
- Employment fell 2,500 (=0.02 per cent) – full-time employment rose by 38.7 thousand (0.4 per cent) and part-time employment fell 41.1 thousand (-0.9 per cent).
- Unemployment fell 2,600 (-0.02 per cent) to 618.3 thousand.
- The unemployment rate was steady on 4.1 per cent.
- The participation rate fell by 0.1 point 67 per cent.
- The Employment-population ratio fell 0.1 point to 64.2 per cent.
- Monthly hours worked rose 25.4 million (1.3 per cent).
- Underemployment fell 0.1 point to 5.9 per cent (falling 28.4 thousand to 896.5 thousand).
- The Broad Labour Underutilisation rate (the sum of unemployment and underemployment) fell 0.1 point to 9.9 per cent.
- Overall, there are 1514.8 thousand people either unemployed or underemployed.
The ABS press release – Unemployment rate steady at 4.1% in May – noted that:
The seasonally adjusted unemployment rate remained at 4.1 per cent in May …
Despite employment falling by 2,000 people this month, it’s up 2.3 percent compared to May 2024, which is stronger than the pre-pandemic, 10-year average annual growth of 1.7 per cent …
Hours worked increased 1.3 per cent in May, following lower levels in the previous two months coinciding with the Easter holiday period and severe weather disruptions.
Summary
1. Ordinarily, a fall in employment coupled with a decline in participation is a bad sign that job opportunities are declining and people are dropping out of the labour force in frustration.
2. However, the strong performance of full time employment meant that working hours increased over the month, which blurs the negative news.
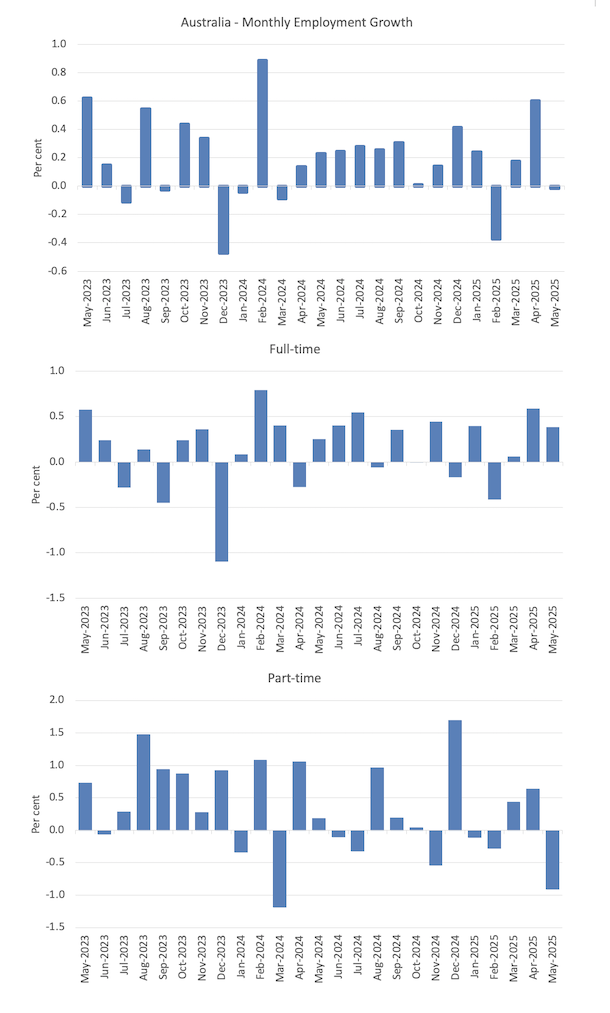
Employment growth slightly negative in May
- Employment fell 2,500 (=0.02 per cent).
- Full-time employment rose by 38.7 thousand (0.4 per cent).
- Part-time employment fell 41.1 thousand (-0.9 per cent).
The following graph shows the growth in total, full-time, and part-time employment for the last 24 months.
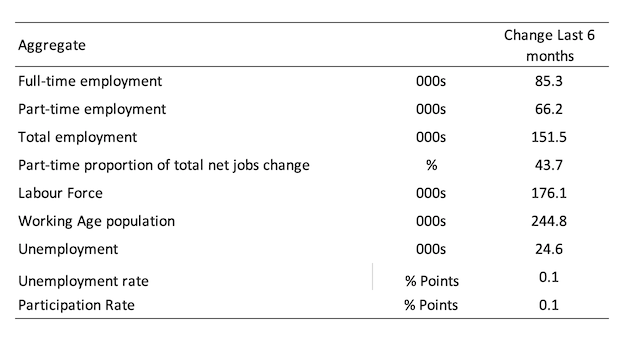
The following table shows the shifts over the last 6 months which helps to see the underlying trend.
Employment has increased by 151.5 thousand, while the labour force has increased by 176.1 thousand on the back of underlying population growth and a 0.1 point increase in participation.
As a result, official unemployment has risen by 24.6 thousand.
So a moderate slowdown has been evidenced over the last 6 months.
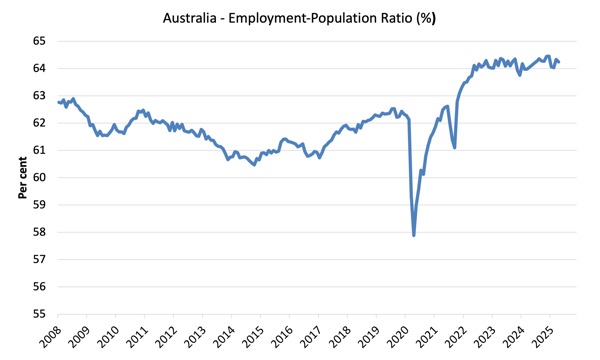
The Employment-to-Population ratio provides a measure of the state of the labour market that is independent of the supply shifts in the labour market (driven by the shifts in the participation rate).
The underlying working age population grows steadily while the labour force shifts with both underlying population growth and the participation swings.
The following graph shows the Employment-Population ratio fell 0.1 point in May 2025 and is 0.3 points below its maximum.
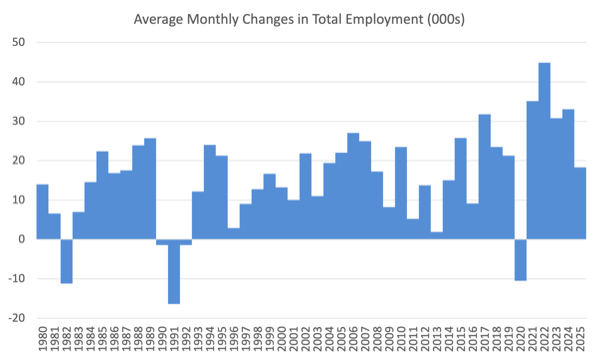
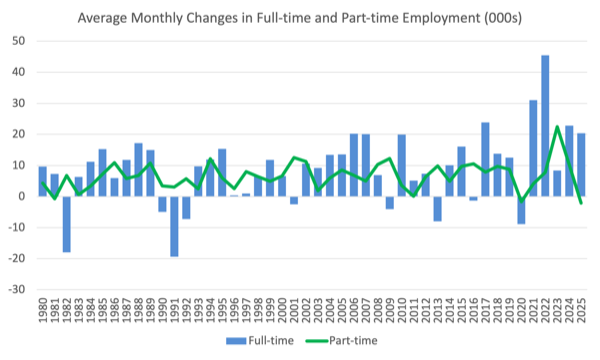
The next graphs show the average monthly change in total employment (first graph) and full- and part-time employment (second graph).
For total employment the monthly average changes were:
- 2022 – 44.8 thousand
- 2023 – 30.8 thousand
- 2024 – 33 thousand
- 2025 so far – 18.3 thousand
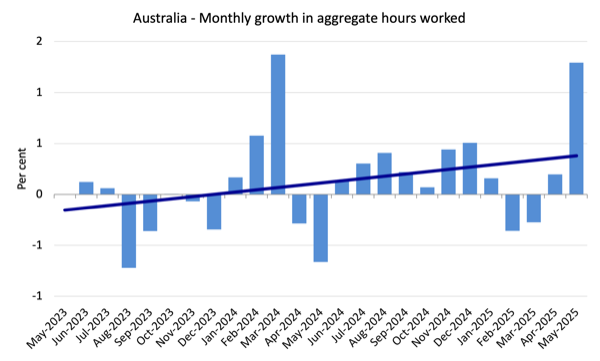
Monthly hours worked rose 1.3 per cent in May 2025
Monthly hours worked rose by 25.4 million hours (1.3 per cent) on the back of the full-time employment growth, which makes it hard to determine the overall direction of the labour market.
The following graph shows the growth in monthly hours worked for the last 24 months, with the straight line being a simple linear regression to indicate trend.
Unemployment fell by 2,600 in May
With total employment falling by 2,500 and the labour force falling by 5 thousand (given the 0.1 point decline in participation), official unemployment fell by around 2,600 to 618.3 thousand.
While the numbers are small, there was some rise in hidden unemployment as a result of the participation rate decline.
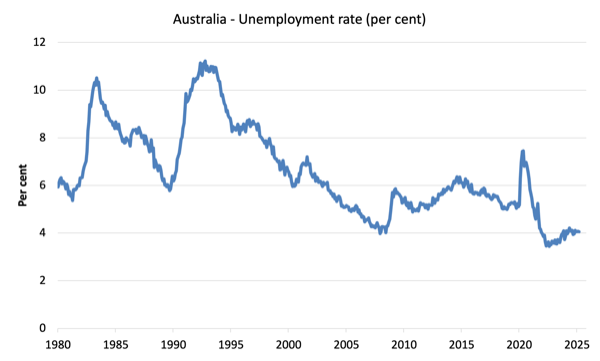
The unemployment rate was steady at 4.1 per cent.
The following graph shows the evolution of the official unemployment rate since 1980.
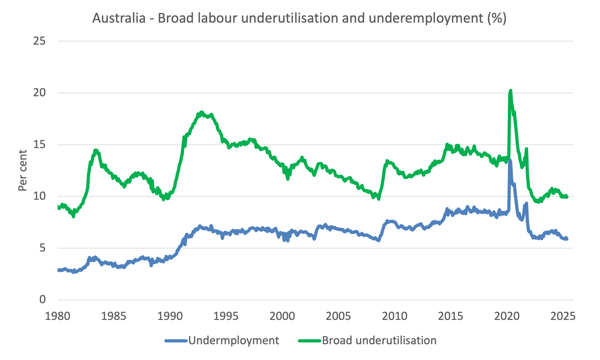
Broad labour underutilisation – 9.94 per cent in May
- Underemployment fell 0.1 point to 5.9 per cent (falling 28.4 thousand to 896.5 thousand).
- The Broad Labour Underutilisation rate (the sum of unemployment and underemployment) fell 0.1 point to 9.9 per cent.
- Overall, there are 1514.8 thousand people either unemployed or underemployed.
The following graph shows the evolution of underemployment and the Broad labour underutilisation rate since 1980.
Teenage labour market – employment growth falters
- Total teenage (15-19) employment fell by 5.1 thousand (-0.6 per cent) in May 2025.
- Full-time employment fell by 0.4 thousand (=0.2 per cent).
- Part-time employment fell by 4.7 thousand (-0.7 per cent).
The following table summarises the shifts in the teenage labour market for the month and over the last 12 months.
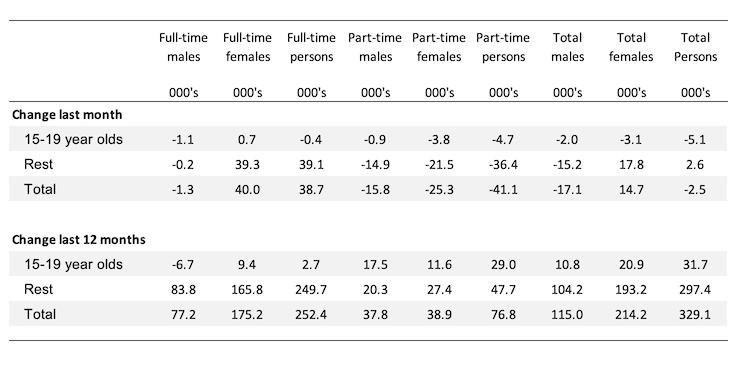
To put these changes into a scale perspective (that is, relative to size of the teenage labour force) the following graph shows the shifts in the Employment-Population ratio for teenagers.
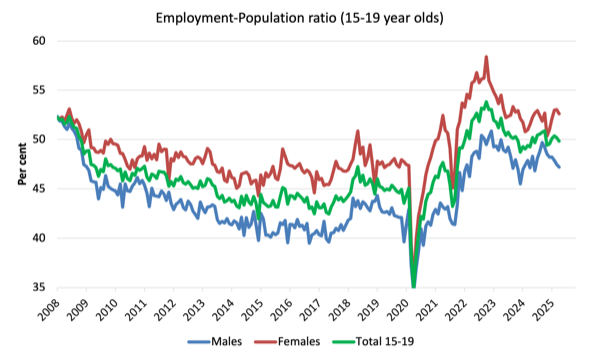
The Teenage Employment-Population ratios and their monthly changes in May 2025were:
- Males: 47.2 per cent -0.3 points
- Females: 52.6 per cent -0.4 points
- Total: 49.8 per cent -0.4 point
Conclusion
My standard warning to take care in interpreting monthly labour force changes – they can fluctuate for a number of reasons and it is imprudent to jump to conclusions on the back of a single month’s data.
- The unemployment rate remained unchanged at 4.1 per cent for the second consecutive month. There was a small decrease in overall employment (-2,500) which was offset by a 0.1 point decline in the participation rate.
- The net effect was a small decline in official unemployment (-2,600) and a stable unemployment rate.
- Whether the fall in employment and participation is a signal of a significant slowdown in the coming months is unclear at this stage. Monthly data fluctuates up and down. There was a 1.3 per cent rise in monthly hours worked and significant growth in full-time employment which blurs an easy interpretation of the other changes.
- Underemployment also fell 0.1 point growth. The broad labour underutilisation rate (sum of unemployment and underemployment) fell to 10 per cent (down 0.1 point) on the back of the declining underemployment.
- It remains a fact that with 10 per cent of available labour not being used it is ludicrous to talk about Australia being close to full employment. There is substantial scope for more job creation given the slack that is present.
That is enough for today!
(c) Copyright 2025 William Mitchell. All Rights Reserved.
This Post Has 0 Comments