I started my undergraduate studies in economics in the late 1970s after starting out as…
What do the IMF growth projections mean?
Today a relatively short blog buts lots of different colour graphs. I have been going through the updated IMF growth forecasts released on January 26 and doing some projections of what this might mean for the capacity of this growth to reduce the unemployment rate. Like any projection exercise you have to make assumptions. And it seems that there is still quite a bit of dispute about whether we are going to recover fairly steadily or keep skidding along the bottom in 2010 with tepid growth in 2011. The IMF are the most optimistic around at the moment and as you will see, even this level of optimism doesn’t paint a very good labour market picture.
Anyway, with respect to the current year or two who do you believe? The Wall Street Journal (reprinted in The Australian) carried the story today (January 28, 2010) that World Economic Forum experts see another global dip ahead while the IMF was positively bullish in its latest World Economic Outlook (published January 26, 2010).
The IMF said:
The global economy, battered by two years of crisis, is recovering faster than previously anticipated, with world growth bouncing back from negative territory in 2009 to a forecast 3.9 percent this year and 4.3 percent in 2011 …
Whereas the WSJ reported that:
THE global economic recovery could lose pace later this year, dashing hopes for a rapid escape from the deepest downturn of the post-war era, economists and investors said at the World Economic Forum’s annual meeting at the Swiss ski resort of Davos.
Heavy debts will weigh on governments and households in the US and Europe for some time, while hopes for global growth will continue to rest on fast-developing countries such as India and China, predicted participants at the meeting’s opening debate on the economy.
Of course, the World Economic Forum is looking more and more a place away from the strife all these leaders helped to cause. It seems that the most frenzied activity has been the big bankers lobbying the British Chanceller in so-called secret talks “to head off Obama-style plan for UK”. And why should we be surprised about that.
I thought the classic comment from the Davos forum was from University of Chicago professor Raghuram Rajan who was reported in the WSJ as saying:
… the combination of 10 per cent unemployment in the US and 10 per cent economic growth in China could prove politically toxic, as US politicians might resort to “populism” and protectionist measures … “Emerging markets used to be associated with indebted governments, lax monetary policy, suspicion of markets, a polarized electorate and a suspect private sector,” Mr Rajan said. Now, he said, that description better fits the world’s advanced economies.
So “populism” is when a government cares about its citizens and uses it policy capacity to do something about it.
Anyway, the point to emerge from Switzerland yesterday is that the “(m)any leading economists and investors showed little confidence that good times are back” and many thought that the modest signs of recovery that are now visible will “fizzle out later this year”.
The business lobby are claiming (obviously!) that “for more regulation could impose new risks” and that “(o)verreaction to the banking crisis by regulators and politicians could become a significant drag on economic growth”.
Meaning in our language – we want to receive as much public largesse as we can get when we take ridiculous risks, lie, cheat and trample over others … and fail but when it is time to get back to risk-taking just leave us alone because markets work and government intervention is damaging.
You will hear the “regulation is dragging growth” claim relentlessly from now on I guess. Creeps!
So it is clear that the projections coming from the IMF are more optimistic than the sentiments being expressed in Switzerland. If you read the IMF WEO update you get quite a different picture of the growth possibilities. While they are concerned with the “fears of inflation and asset bubbles” that many claim are increasing risks associated with China’s rebound (I don’t think that by the way) the IMF sees the Asian recovery as leading the rest of the world out of the slump.
The irony never escapes me that a communist nation – which is repressive, highly planned with most production is still state-owned, is killing the rest of us in managing the crises and building growth – and pulling the rest of us out of the slime.
The old Cold War sentiments are stil out there – but like the blind neo-liberal belief in the self-regulating market – it is the highly planned economy which is doing the best. I will come back to this theme in another blog because it has significant implications for the developing world.
In an update to its World Economic Outlook, released overnight, the IMF also predicted global growth would accelerate to 3.9 per cent in 2010, an upward revision of 0.75 per cent from its previous forecast. But it warned that the recovery in advanced economies was expected to remain sluggish by past standards.
While the IMF is overall more optimistic than it was in October last year, it still thing the recovery will be sluggish when compared to previous upturns.
An important observation which should not be lost on policy-makers is that the recovery is being largely driven by “expansionary monetary policy and fiscal stimulus” with “few indications that autonomous (not policy-induced) private demand is taking hold, at least in advanced economies”.
That should have been in bold with some floodlights!
The warning was clear in the title they gave the Update – “a policy-driven, multispeed recovery” and that:
On the downside, a key risk is that a premature and incoherent exit from supportive policies may undermine global growth and its rebalancing. Another important risk is that impaired financial systems and housing markets or rising unemployment in key advanced economies may hold back the recovery in household spending more than expected.
They also said the “still-low levels of capacity utilization and well-anchored inflation expectations are expected to contain inflation pressures”. This is obvious but seems to be lost on most of the mainstream economic commentators.
Further they noted that:
Due to the still-fragile nature of the recovery, fiscal policies need to remain supportive of economic activity in the near term. The fiscal stimulus planned for 2010 should be fully implemented.
They then went into mindless mode claiming that there were “growing concerns about fiscal sustainability” and exit plans were needed. They went further and claimed that the stimulus not only had to be rewound but also a move into surplus to restore balance.
I won’t start to talk about that today. My position is obvious. The public debt doesn’t matter. It is non-government wealth and the interest payments are non-government incomes. There are equity concerns but they can be handled differently. As the economies return to growth a significant retrenchment in the fiscal position will occur anyway via the automatic stabilisers.
There are no signs that governments are overspending – quite the opposite.
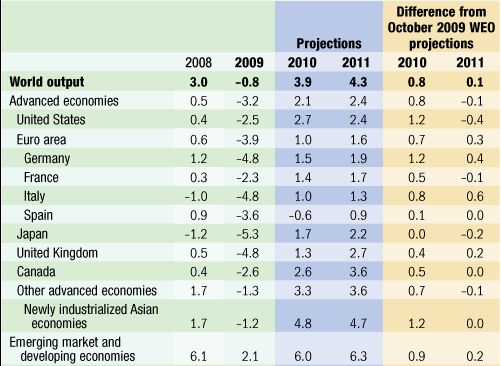
The latest IMF growth projections are shown in the following Table which is an edited version of the Figure published in the WEO update. You can see they have become more optimistic for the World overall expecting real GDP to grow by 0.8 per cent more than they thought in October for 2010 and 0.1 per cent more than they thought in October for 2011.
For Australia is has upgrade its previous forecast for 2010 by 0.5 per cent to 2.5 per cent and revised down its 2011 assessment to 3 per cent from 3.3 per cent.
For the US they are now more optimistic for 2010 (up 1.2 per cent on the October 2009 WEO estimate) but less optimistic after that (down 0.4 per cent).
For Japan they are now neutral against their October estimates and slightly more pessimistic for 2011 (down 0.2 per cent).
For the UK they are more optimistic – 0.4 per cent more in 2010 and 0.2 per cent more in 2011 than they estimated in the October 2009 WEO.

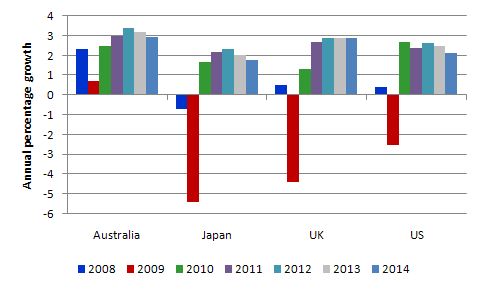
The following graph shows the IMF assumptions used in the following analysis. You can see why they are talking about a modest and multi-speed recovery. The 2008 and 2009 are the actual outcomes (although for 2009 only until September 2009).

Anyway, the question I was interested in was exploring the implications for the evolution of unemployment rates. To anchor an analysis I took the IMF forecasts on their word – although I probably lean more to the other view. To limit the work I selected Australia, Japan, the United Kingdom and the United States.
To help us along, we use the so-called Okun’s Law arithmetic to estimate the deficiency in GDP growth which has led to the rise in unemployment rates. The late Arthur Okun is famous (among other things) for estimating the relationship that links the percentage deviation in real GDP growth from potential to the percentage change in the unemployment rate.
Characters like me manipulate the algebra underlying this law to come up with a way of making guesses about the evolution of the unemployment rate based on real output forecasts. Here is a simple version of the model I used.
We can relate the major output and labour-force aggregates to form expectations about changes in the aggregate unemployment rate based on output growth rates. A series of accounting identities underpins Okun’s Law and helps us, in part, to understand why unemployment rates have risen. Take the following output accounting statement:
(1) Y = LP*(1-UR)LH
where Y is real Gross Domestic Product, LP is labour productivity in persons (that is, real output per unit of labour), H is the average number of hours worked per period, UR is the aggregate unemployment rate, and L is the labour-force. So (1-UR) is the employment rate, by definition.
Equation (1) just tells us the obvious – that total output produced in a period is equal to total labour input [(1-UR)LH] times the amount of output each unit of labour input produces (LP) .
Using some simple calculus you can convert Equation (1) into an approximate dynamic equation expressing percentage growth rates, which in turn, provides a simple benchmark to estimate, for given labour-force and labour productivity growth rates, the increase in output required to achieve a desired unemployment rate.
Accordingly, with small letters indicating percentage growth rates and assuming that the hours worked is more or less constant, we get:
(2) y = lp + (1 – ur) + lf
Re-arranging Equation (2) to express it in a way that allows us to achieve our aim (re-arranging just means taking and adding things to both sides of the equation):
(3) ur = 1 + lp + lf – y
Equation (3) provides the approximate rule of thumb that if the unemployment rate is to remain constant, the rate of real output growth must equal the rate of growth in the labour-force plus the growth rate in labour productivity. It is an approximate relationship because cyclical movements in labour productivity (changes in hoarding) and the labour-force participation rates can modify the relationships in the short-run. But it should provide reasonable estimates of what will happen.
Remember that labour productivity growth reduces the need for labour for a given real GDP growth rate while labour force growth adds workers that have to be accommodated for by the real GDP growth (for a given productivity growth rate).
Steps:
- Assemble data – mainly from OECD Main Economic Indicators, although I also used data from the statistical agencies in each country. The data used was Real GDP, Labour Force and Employment.
- Compute labour productivity in persons – dividing Real GDP by Employment appropriately scaled.
- Compute labour productivity and labour force growth estimates from 2010 to 2014. This was judgemental and in most cases I ignored what was happening in the recent downturn because falling economic activity will drive both growth rates off trend. I also decided to use two labour force growth scenarios – high and low – the high was based on average achieved in the the positive growth quarters leading up the downturn and the low was based on the current early recovery estimates. I also prorated the labour force growth projections a bit. They are largely realistic.
- Compute the required real GDP growth rate for both high and low labour force growth scenarios as the sum of the labour productivity growth rate and the relevant labour force growth rate.
- Using the 2009 unemployment rate I then compute the projected unemployment rates out by adding/substracting the difference in percentage terms between the actual real GDP growth rate and the required real GDP growth rate. Remember that the latter is the real GDP growth rate that keeps the unemployment rate constant. So if actual real GDP growth equals the required rate, there will be no change in the unemployment rate. If actual is greater than required then the unemployment rate will fall and vice-versa.
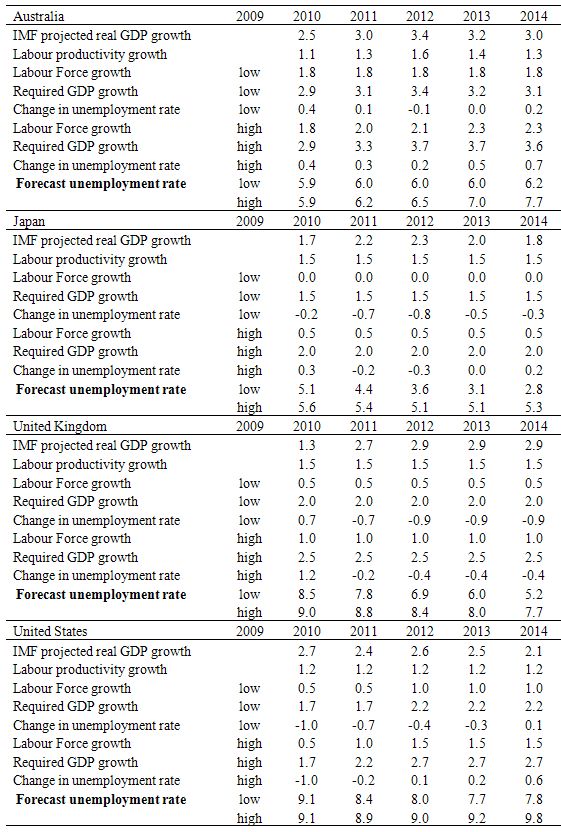
All the assumptions are set out in the following table.
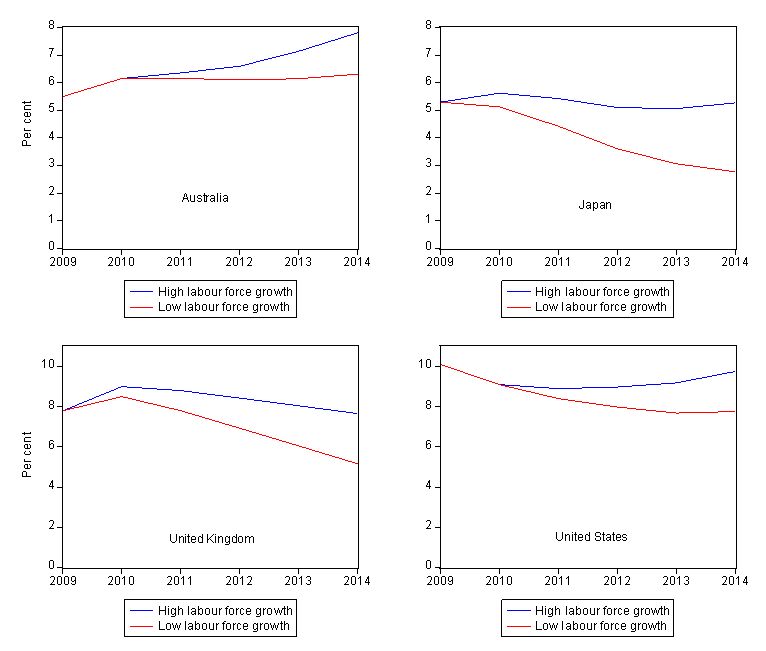
The following graph captures the projections for each country (which are shown in the Table). They are self-explanatory. You can see that Australia is not forecast to grow fast enough to start making inroads into the unemployment rate, especially if the labour force growth rate picks up to its pre-crisis levels.
Japan clearly benefits in a recovery phase by having static labour force growth even though its labour productivity growth is higher than the other countries.
The United Kingdom also will likely enjoy modest reductions in its unemployment rate if the IMF real GDP growth projections are accurate. But modest is the words. If the labour force growth rate is similar to its pre-crisis level then the UK will be locked into high unemployment rates throughout the period (see Table for values).
Finally, the US is the worst looking of the lot. Its projected growth will see very minor declines in the unemployment rate, which is already at very high levels (10.1 per cent).
Unemployment rate projections, 2010-2014

Conclusion
Even once real GDP growth the retrenchment of the unemployment that occurred during the downturn is very slow as the estimates show. While these projections are only approximate and will be seriously compromised in the short-run by the hours-adjustments that will occur (this recession saw a lot of labour hoarding – especially in Australia), the estimates will not be useless.
What they tell me is that real GDP growth will not be anywhere near strong enough in the coming growth period and if governments run scared and start withdrawing their stimulus packages too early then unemployment will be even worse than projected here.
The US President’s State of the Union speech today was confirmation of how neo-liberal his government remains. Rabidly so.
That is enough for today!

Their linear forecasting is missing a very crucial point: Of Mortgage Brokers, ARMs, Attrition and Marathons
If US U-Rate is below 9.5/10% this year, I’ll be amazed. They don’t just need job growth, they need multiple ’00s of ‘000s per month to accomodate the return of labour ito the workforce for a start, at a time when the actual States are reducing essential services and employment, and soaking up as much stimulus as they can to balance their godforsaken budgets. How consumption, and therefore, GDP can grow at a half decent clip in this environment is going to have to be explained to me….slowly.
Nevermind employment and everything else, can someone give Obama a quick rundown on MMT so we can GET BACK TO THE MOON? THE MOON, PEOPLE!
A short digression about this moon link above : all industrial nations figured out universal health care way before the USA, who still hasn’t, landed a man on the moon (as early as 1883, in Germany). No fanfare though.