Today (June 3, 2026), the Australian Bureau of Statistics (ABS) released the latest - Australian…
Australian National Accounts – GDP growth slows significantly – slipping towards recession under current policy settings
The Australian Bureau of Statistics released the latest – Australian National Accounts: National Income, Expenditure and Product, March 2025 – today (June 4, 2025), which shows that the Australian economy grew by just 0.2 per cent in the March-quarter 2025 (down from 0.6 per cent) and by just 1.3 per cent over the 12 months. GDP per capita growth was negative -0.2 per cent as output growth was outpaced the underlying population growth. There was a major slowdown in household consumption expenditure growth and the government sector overall contracted. While the overall slowdown led to a decline in import expenditure (which adds to growth), the decline in exports was greater, which means that the external sector detracted from growth overall. The problem is that as the overall growth rate declines, it is getting to the stage where unemployment will start to rise.
The main features of the National Accounts release for the March-quarter 2025 were (seasonally adjusted):
- Real GDP increased by 0.2 per cent for the quarter (0.6 per cent last quarter). The annual growth rate was 1.3 per cent (stable)).
- GDP per capita fell 0.2 per cent for the quarter and 0.4 per cent for the year, signalling declining average income.
- Australia’s Terms of Trade rose 0.1 per cent for the quarter but were down by 4.1 per cent over the 12 month period.
- Real net national disposable income, which is a broader measure of change in national economic well-being, rose by 0.6 per cent for the quarter and 0.2 per cent over the 12 months.
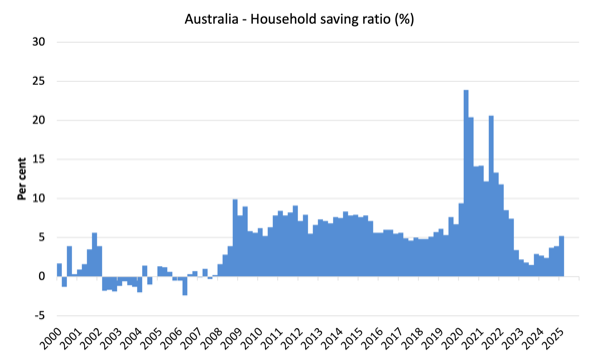
- The Household saving ratio (from disposable income) rose to 5.2 per cent (from 3.9).
Overall growth picture – growth continues at much slower rate
The ABS – Media Release – said that:
Australian gross domestic product (GDP) rose 0.2 per cent in the March quarter 2025 and 1.3 per cent compared to the March quarter 2024 …
Economic growth was soft in the March quarter. Public spending recorded the largest detraction from growth since the September quarter 2017. Extreme weather events reduced domestic final demand and exports. Weather impacts were particularly evident in mining, tourism and shipping …
GDP per capita fell 0.2 per cent this quarter, following a 0.1 per cent rise in the December 2024 quarter.
The short story:
1. The weakness in private domestic demand continued although household consumption expenditure returned modest positive contributions to growth in this quarter.
2. Government consumption expenditure was flat while capital spending contracted.
3. The contribution of Net exports was negative.
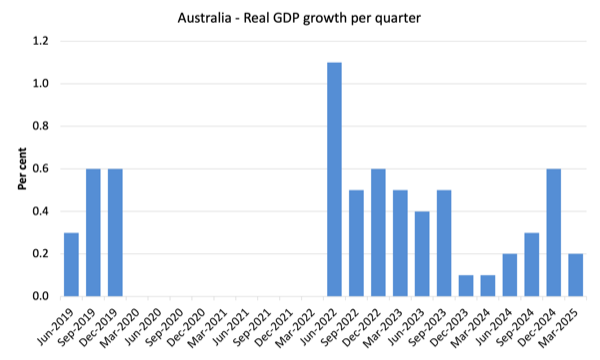
The next graph shows the quarterly growth over the last five years with the extreme observations during the worst part of the COVID restrictions and government income support taken out.
To put this into historical context, the next graph shows the decade average annual real GDP growth rate since the 1960s (the horizontal red line is the average for the entire period (3.29 per cent) from the March-quarter 1960 to the March-quarter 2025).
The 2020-to-now average has been dominated by the pandemic.
But as the previous graph shows, the period after the major health restrictions were lifted generated lower growth compared to the period when the restrictions were in place.
If we take the observations between the December-quarter 2020 and the December-quarter 2022 out, then the average since 2020 has been 1.7 per cent per annum.
It is also obvious how far below historical trends the growth performance of the last 2 decades have been as the fiscal surplus obsession has intensified on both sides of politics.
Even with a massive household credit binge and a once-in-a-hundred-years mining boom that was pushed by stratospheric movements in our terms of trade, our real GDP growth has declined substantially below the long-term performance.
The 1960s was the last decade where government maintained true full employment.

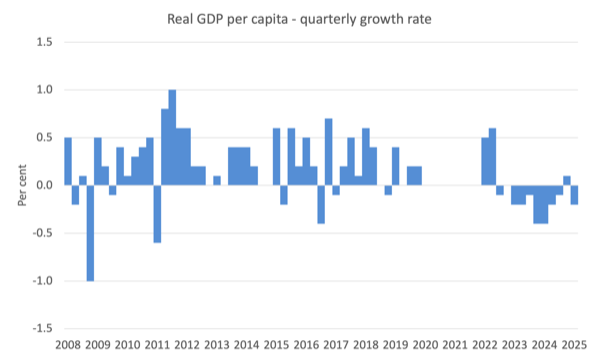
A GDP per capita recession looks set to resume
In the December-quarter 2024, GDP per capita grew by 0.1 per cent marking the end of 7 consecutive quarters of negative growth.
That negative streak is back which means in the March-quarter 2025, total output averaged out over the entire population was in contraction.
The meaning of the average is questionable, given the highly skewed income distribution towards the top end.
Given that, if the average is declining, then those at the bottom are doing it very tough indeed.
The following graph of real GDP per capita (which omits the pandemic restriction quarters between December-quarter 2020 and December-quarter 2021) tells the story.
Analysis of Expenditure Components
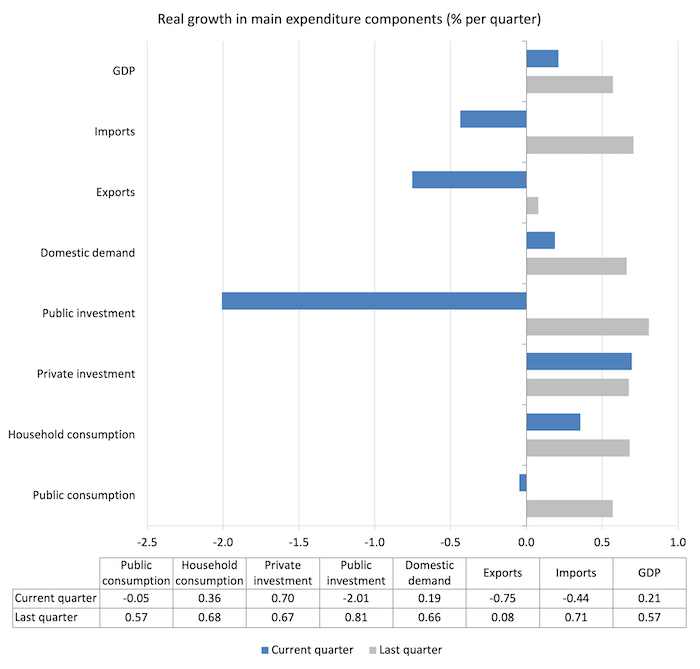
The following graph shows the quarterly percentage growth for the major expenditure components in real terms for the December-quarter 2024 (grey bars) and the March-quarter 2025 (blue bars).
- Significant decline in quarterly GDP growth – 0.21 per cent in March-quarter 2025 compared to 0.57 per cent in December-quarter 2024.
- While import growth was negative (and declining) the contraction in exports was larger.
- The government sector expenditure (recurrent and capital) growth contracted.
- Household consumption expenditure growth fell.
Contributions to growth
What components of expenditure added to and subtracted from the change in real GDP growth in the December-quarter 2024?
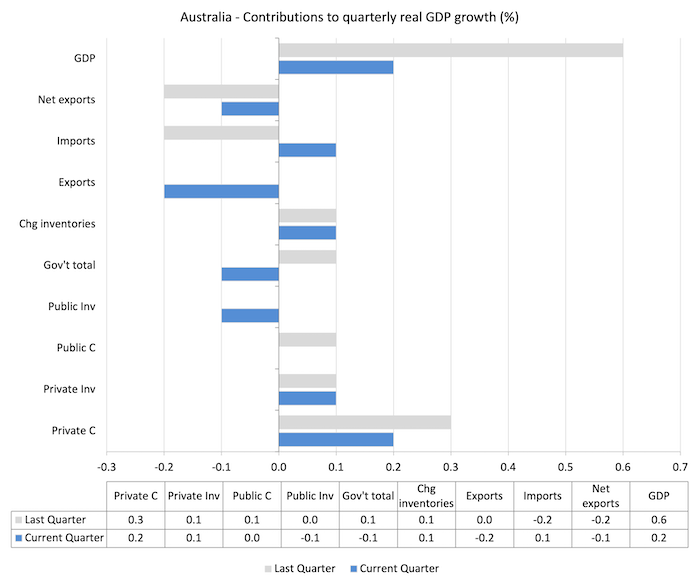
The following bar graph shows the contributions to real GDP growth (in percentage points) for the main expenditure categories. It compares the March-quarter 2025 contributions (blue bars) with the previous quarter (gray bars).
- Household consumption expenditure added 0.2 points (-0.1 point).
- Private investment expenditure added 0.1 point (stable).
- Net exports subtracted 0.1 point from growth – the 0.2 point export contraction outweighed the 0.1 point import gain (remember negative import expenditure growth constitutes a boost to growth).
- Overall government contribution was negative.
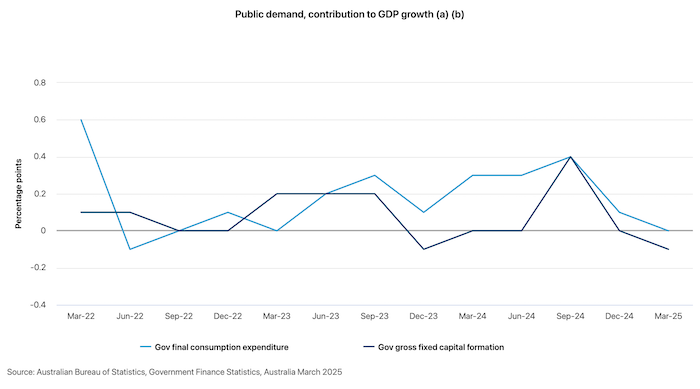
The next graph was published yesterday (June 3, 2025) by the ABS in their – Government Finance Statistics, Australia – release.
It shows the evolution of contributions by government to GDP growth since the March-quarter 2022.
Recurrent spending by government has now fallen to a zero contribution to GDP growth while government capital expenditure undermined growth in the current quarter.
Material living standards rose 0.2 points in the March-quarter
The ABS tell us that:
A broader measure of change in national economic well-being is Real net national disposable income. This measure adjusts the volume measure of GDP for the Terms of trade effect, Real net incomes from overseas and Consumption of fixed capital.
While real GDP growth (that is, total output produced in volume terms) rose by 0.2 per cent in the March-quarter, real net national disposable income growth rose by 0.6 per cent.
How do we explain that?
Answer: The terms of trade were positive in the March-quarter and compensation of employees (COE) increased 1.5 per cent.
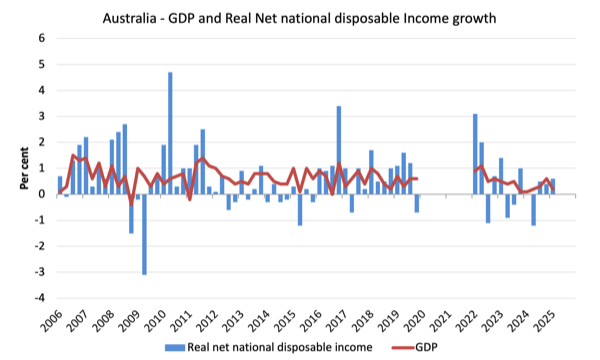
In per capita terms, real net national disposable income improved by a small margin (0.1 per cent) for the quarter but over the year there was a 1.4 per cent decline and since mid-2022, the decline has been 4.7 per cent.
So, on average, Australians are worse off now in material terms that they were 12 months ago.
Household saving ratio rose 1.3 points to 5.2 per cent
The RBA tried to wipe out the household saving buffers as it hiked interest rates hoping that this would reduce the likelihood of recession.
Of course, that process attacked the lower-end of the wealth and income distribution, given the rising interest rates have poured millions into those with interest-rate sensitive financial assets.
It is now clear that households are becoming cautious – reducing overall expenditure growth and increasing their saving out of their disposable income.
The following graph shows the household saving ratio (% of disposable income) from the December-quarter 2000 to the current period.
It shows the period leading up to the GFC, where the credit binge was in full swing and the saving ratio was negative to the rise during the GFC and then the most recent rise.
An increasing saving ratio provides the household sector overall with an increased capacity to risk manage in the face of uncertainty.
The next graph shows the saving ratio since 1960, which illustrates the way in which the neoliberal period has squeezed household saving.
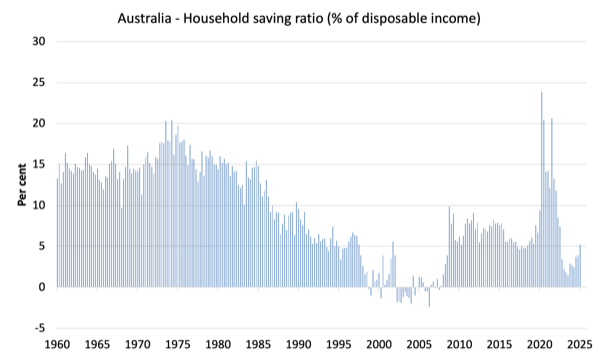
Going back to the pre-GFC period, the household saving ratio was negative and consumption growth was maintained by increasing debt – which is an unsustainable strategy given that household debt is so high.
Even though the ratio has been rising slightly in recent quarters, it is still well below past levels.
The following table shows the impact of the neoliberal era on household saving. These patterns are replicated around the world and expose our economies to the threat of financial crises much more than in pre-neoliberal decades.
The result for the current decade (2020-) is the average from June 2020.
| Decade | Average Household Saving Ratio (% of disposable income) |
| 1960s | 14.4 |
| 1970s | 16.2 |
| 1980s | 11.9 |
| 1990s | 5.0 |
| 2000s | 1.4 |
| 2010s | 6.6 |
| 2020s on | 8.8 |
| Since RBA hikes | 3.4 |
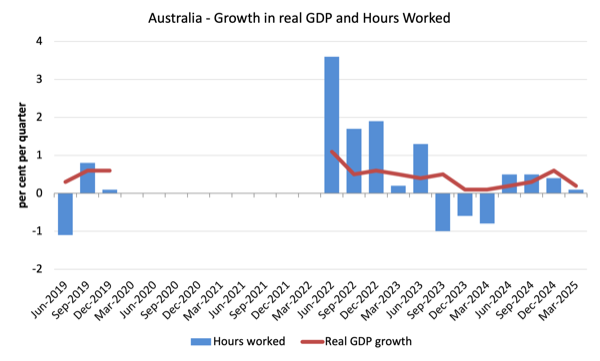
Real GDP growth rose but hours worked rose more and productivity growth declined
Real GDP rose 0.2 points in the quarter, while working hours rose by 0.1 per cent.
Which means that GDP per hour was essentially unchanged (after rounding).
However, the data shows that GDP per hour worked fell by 0.9 point for the quarter – that is, a decrease in labour productivity.
That is the third consecutive quarter of declining productivity growth.
The ABS is going to release more detailed productivity growth data next quarter, which will allow us to be more precise in terms of understanding which sectors are contributing to the malaise.
But the evidence to date is that the ‘market-sector’ is providing modest productivity growth while the ‘non-market sector’ (education etc) is bringing the overall figure down.
There are massive measurement issues encountered in assessing non-market sector productivity growth and so the aggregate result might not be as poor as is suggested.
The following graph presents quarterly growth rates in real GDP and hours worked using the National Accounts data for the last five years to the March-quarter 2025.
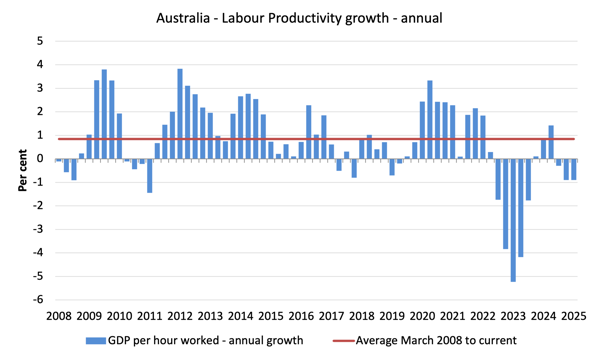
To see the above graph from a different perspective, the next graph shows the annual growth in GDP per hour worked (labour productivity) from the beginning of 2008 to the March-quarter 2025.
The horizontal red line is the average annual growth since the March-quarter 2008 (0.84 per cent), which itself is an understated measure of the long-term trend growth of around 1.5 per cent per annum.
The relatively strong growth in labour productivity in 2012 and the mostly above average growth in 2013 and 2014 helps explain why employment growth was lagging given the real GDP growth.
Growth in labour productivity means that for each output level less labour is required.
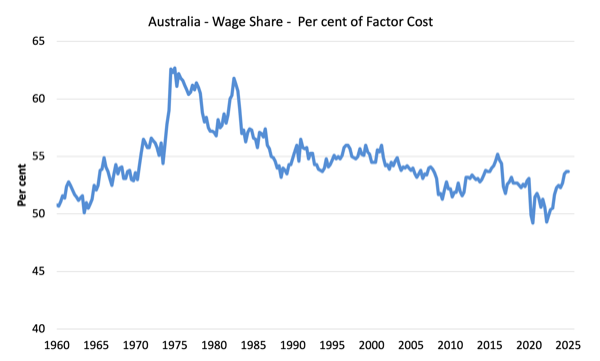
The distribution of national income – wage share steady
The wage share in national income was steady at 53.7 per cent in the March-quarter 2025.
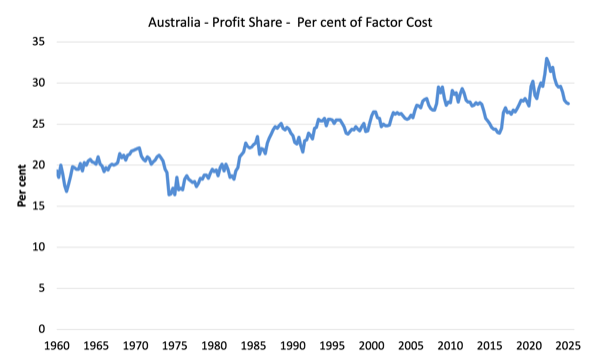
The profit share fell to 27.5 per cent (down 0.1 point).
The residual is largely the government share.
The first graph shows the wage share in national income while the second shows the profit share.
The declining share of wages historically is a product of neoliberalism and will ultimately have to be reversed if Australia is to enjoy sustainable rises in standards of living without record levels of household debt being relied on for consumption growth.
Conclusion
Remember that the National Accounts data is three months old – a rear-vision view – of what has passed and to use it to predict future trends is not straightforward.
The Australian economy grew by just 0.2 per cent in the March-quarter 2025 (down from 0.6 per cent) and by just 1.3 per cent over the 12 months.
GDP per capita growth was negative -0.2 per cent as output growth was outpaced the underlying population growth.
There was a major slowdown in household consumption expenditure growth and the government sector overall contracted.
While the overall slowdown led to a decline in import expenditure (which adds to growth), the decline in exports was greater, which means that the external sector detracted from growth overall.
The problem is that as the overall growth rate declines, it is getting to the stage where unemployment will start to rise.
Clarification on terminology
I advocated a degrowth strategy for the global economy overall given that our footprint is 1.7 times the capacity of the biosphere to regenerate.
To achieve that strategy, given that many poorer nations must continue to grow, will require rather substantial cut backs in spending and consumption in the richer nations.
When I analyse the National Accounts data or any expenditure/output data, I write as if growth is ‘good’.
But that terminology is used in the context that without economic growth and without any substantial shifts in income distribution and government transition policies, trying to pursue a recessionary strategy would damage the weakest members of our society disproportionately.
In some respects, I am abstracting from the damaging reality of our ecological footprint.
That is enough for today!
(c) Copyright 2025 William Mitchell. All Rights Reserved.
Bill makes a great point. Under current economic structures and arrangements, degrowth (a reduction in GDP) will affect the most vulnerable people in the worst possible way – rising unemployment and lower incomes for people who are already struggling to keep the economic water going over their heads.
At the same time, the global Ecological Footprint (EF) rises because the percentage increase in GDP is invariably higher than the percentage decrease in the EF-intensity of GDP. That said, if population growth had been curtailed, the EF would have remained steady for the past 50 years and below the Earth’s Biocapacity (BC).
F = P x A x R
* F = EF
* P = population
* A = affluence = GDP/P
* R = resource-intensity or EF-intensity of GDP = F/GDP
* Note: P x A = GDP; affluence (A) = per capita GDP
Therefore, F = P x GDP/P x F/GDP
This is a true equation, unlike Paul Ehrlich’s IPAT identity (my FPAR equation is a variation on Ehrlich’s identity).
Over the past 50 years, F has doubled (2x); P has doubled (2x); A has doubled (2x); R has halved (0.5). If global population had remained as it was in 1975 (4 billion), A and R would have cancelled each other out; F would have remained at 0.85BC. The global economy would have remained sustainable (EF < BC).
Since EF = 1.7BC at present (grossly unsustainable), finding ways to reduce GDP (degrowth) and bring EF back below BC while maintaining full employment and decent minimum incomes for the world's poorest people is a huge challenge. It will require a massive redistribution of income and wealth to the poor and a huge decline in the income of the very rich (who won't be any worse off, since the marginal utility of their consumption is zero). A Universal Basic Income (UBI) is not the way to deliver a minimum living income to the world's poor. It should be done through the introduction of a Job Guarantee (JG) – attaching the minimum income with meaningful work. The beauty of the JG is that it would automatically achieve full employment and an income floor in a degrowth world.
Degrowth means more than a decrease in GDP. It means quelling population growth and eventually bringing global population down to no more than 4 billion – another huge challenge. People might respond by saying that billions of people would miss out on a chance at life. They would be wrong. It would mean fewer people now but many more in the future. What humans have done to the planet has already reduced the number of people who will ever live as well as the number of people who will have the same opportunities in life as presently living people.
Why not write about how degrowth can be undertaken *without* damaging the weakest members of our society disproportionately?
Dear Bill
When are you going to get Dr Lawn to write a regular piece about ecological economics within an MMT framework.
Until there is another metric substituting for GDP, then there can be no meaningful empirical data that allows us to move towards a ‘degrowth’ situation.
We already know both the nature and scale of the problems conventional economic and human activity cause.
The lacunae in GDP are the crucial matters of sustainability; whether material resource utilisation is sustainable; how negative externalities like pollution are included; how depreciation of assets and depletion of productive capital stocks are assessed; and how human factors are integrated.
Even putting aside the complexities of applying qualitative decision making regarding degrowth to quantitative data, GDP is an unhelpful foundation.
Not all economic activity is harmful or damaging, so calculations that use GDP per capita as a base are hardly going to inform decision making.
One of the highest priorities has to be in differentiating between renewable and non-renewable resources in production, and either nudging or shifting economic production towards sustainable enterprises.
Neither the value added approach, of “gross value added minus intermediate consumption” or the sectoral balance equation of GDP as the sum of consumption, investment, government expenditures and net exports is of any material assistance in determining what future economic and human activity will be able to reduce the current ecological footprint, or is maintainable in the longer term.
The linked issues of remediation of damaged environments and loss of biodiversity further complicate planning for a sustainable future.
There is no way that current market mechanisms and growth goals will allow decision making that evaluates actions to cover remediation.
So we cannot plan for degrowth meaningfully. Yet this is what we need to do.
TiPi: GDP was never designed to be a measure of what can be sustained. It was designed to calculate a monetary measure of the final goods and services produced by domestically located factors of production (i.e., by a nation). It does a good job of that, and we can thank Simon Kuznets for it (who warned against using GDP as a measure of wellbeing, among other things).
A measure of GDP is useful for some things, since GDP is a means to the satisfaction of important ends. It doesn’t tell us what ends (goals) are appropriate, how well are ends are being satisfied, or whether GDP (as an intermediate means) can be sustained by a portion of the intermediate means (labour and human-made capital – the remainder being consumer goods) transforming the natural resources we extract from the ultimate means (natural capital).
The best way to plan for degrowth is to target (I would say ‘cap’) the rate of throughput (input of natural resources/output of wastes) so that it is no greater than the ecosphere’s regeneration and waste assimilative capacities. One of the best measures of throughput relative to the ecosphere’s regeneration and waste assimilative capacities is the Ecological Footprint (EF) (human demands on the planet) relative to Biocapacity (BC) (the ability of the planet to sustain the supply of natural resources, assimilate wastes, and provide other essential ecosystem services). At the global level the EF is currently 1.75x global BC, so the rate of throughput at the global level is currently unsustainable.
Once the EF is brought within BC, the maximum size of GDP (national level) and GWP (global level) will depend on the throughput-intensity of GDP. But since GDP is a means to our ends, we may not want to maximise GDP. Only if maximisation of GDP is needed to satisfy all our ends in a throughput ‘capped’ world would we want to maximise GDP. Once we reorder our ends, I don’t think we would do this in rich countries, although some poor countries will need more GDP to satisfy basic ends.
There is no such thing as a ‘sustainable’ enterprise. Sustainability is a macro concept. There can only be enterprises operating in a sustainable world – that is, a world where EF < BC. Some enterprises will have lower resource-intensities of production than others, which is what you really mean by a more sustainable enterprise. A low resource-intensive enterprise on a low-lying Pacific island will drown from climate change just like a high resource-intensive enterprise. We want enterprises that produce particular goods and services with fewest resources, and they will in a throughput capped world because the price of natural resources would dramatically increase, and only the most efficient producers would survive. That said, it doesn't mean that all resources would be allocated to the least resource-intensive production activities. If the production of useless widgets is less resource-intensive than the production of useful gadgets (i.e., 1,000 widgets can be produced from the same quantity of natural resources as 500 gadgets), we may still want resources allocated to the production of gadgets. In a throughput capped world, we'd enjoy fewer gadgets than widgets, but that's OK if the former are more than twice as useful than the latter. But we'd want resources allocated to the most efficient producers of gadgets (ignoring widgets altogether), which would happen if natural resource prices rose to reflect the full cost of their use (which they don't at present).
Sustainability is most definitely not reducible to designation as a “macro concept “.
At its simplest, sustainable enterprise is human activity which does not permanently deplete resources, exceed biocapacity in materials and energy consumption, or produce permanent environmental degradation through pollution, that is incapable of remediation.
It is clearly not always reducible to activity that generates a money exchange. There are still 2.5-3 billion people – some 40% of the global population – whose livelihoods depend on subsistence agriculture.
Their lives have little impact on GDP, even as an approximation or surrogate for resource consumption.
Brundtland has been justifiably criticised for the looseness of her widely accepted definition of sustainability as “meeting the needs of the present without compromising the ability of future generations to meet their own needs.”
However, this is very much a homocentric and not an ecocentric view.
Like the carbon accounting metric devised for the IPCC, the concept of Ecological Footprinting, initially aimed to raise wider environmental awareness, and almost 30 years ago now.
It presents a simple area based calculation using metrics for fossil energy, built environment, food land and forest products, with consumption separated into the five major categories of :-
1. food
2. housing
3. transportation
4. consumer goods
5. services (including intangibles) (Wackernagel and Rees 1996)
The final unit of EF measurement was originally expressed in hectares/per capita and defined as “the land (and water) area required for the indefinite support of a defined population and material standard”
The material standard was not defined, just as Brundtland did not detail what “present and future needs” involved. That has always seemed a perennial cop out. A discussion of what constitutes and differentiates “needs and wants” always seems to be too politically difficult.
GDP might give a loose association with overall sustainability but that is neither correlation nor causality.
Of course GDP has use as a broad brush measure in many areas of economics, but it is limited and more akin to litmus paper – even by comparison with a universal pH indicator – when looking at complex sustainability issues.
Rees and Wackernagel looked at economic indices and measurements in some depth in ascertaining EF and then finally concluded that:
“Monetary approaches are blind to the requirements for ecological sustainability.”
GDP excludes all unpaid work, so activities such as domestic work, much social care and most subsistence agriculture. It barely recognises depreciation, so depletion of capital stock, assets and infrastructure , and ignores maintenance of a wide range of man created fixed assets or ‘stocks’ in intermediate consumption calculations. Similarly, it disregards specific chunks of defence spending.
Yet all these consume considerable resources and energy and are integral to footprinting.
Every week a 38 tonne lorry leaves our nearby fishing village with live shellfish exports for Spain.
This lorry transports a range of creel caught langoustines, crabs and lobsters and this fishing method is broadly managed on a sustainable basis.
However, the lorry also includes dredged scallops and trawled prawns, with these fishing methods being entirely unsustainable. Both dredging and bottom trawling are exceptionally damaging to the marine environment.
Roughly half this trade is broadly sustainable, if managed properly. The other half is most definitely not.
This means that the half the GDP generated from this weekly lorry export will be able to be continued into the future without damaging marine commons, yet the other half of that revenue is not.
Clearly, not all economic activity is harmful or damaging, and calculations that use GDP per capita as a base measure are not going to be sufficiently sophisticated to inform practical decision making for degrowth.
We need different metrics.
Any future government or even international agency planning or regulating economic activity either in establishing degrowth, or even in an intermediate stage of transition from extremely damaging to predominantly sustainable consumption must be capable of differentiating between renewable and non-renewable resources and energy use in production.
TiPi: Currently, most economies have grown beyond their maximum sustainable scale. If every business in an over-bloated economy did everything they could to reduce GHG emissions, increased their resource use efficiency, etc., so that the throughout-intensity of their operations halved and, at the same time, the number of businesses doubled, tell me how that would be sustainable? It wouldn’t be.
If a throughput constraint (cap) was imposed so that the aggregate rate of throughput was within the ecosphere’s carrying capacity and, for argument’s sake, every business that survived increased their GHG emissions and reduced their resource use efficiency so that the throughput-intensity of their operations doubled, the outcome would be ecologically sustainable. The wellbeing of the people would be severely affected because the number of surviving businesses would be few, and the quantity of goods produced would be significantly reduced (i.e., reduced by much more than is necessary), but the outcome would be sustainable.
Attention on what individual businesses do is important from a resource allocation perspective, because it affects the benefits we enjoy from a given rate of throughput, as does the distribution of the stuff produced. Without a throughput constraint, any reduction in the throughput-intensity of goods produced can easily be overwhelmed by the increase in total quantity of goods produced, in which case total throughput rises or remains constant. It’s referred to as the ‘rebound effect’ or ‘Jevons paradox’. Why rely on businesses doing the right thing to achieve sustainability, when the latter is not guaranteed, and when you can achieve the latter with a simple cap on the rate of throughput? Why throw a dart at a dartboard in an attempt to hit the bullseye (sustainability) when you have the option of walking up and placing the dart in the bullseye?
Ecological economists talk about three main goals – sustainable scale, equitable distribution, and allocative efficiency. The first is technically the easiest to achieve, albeit probably the most difficult politically. The second is technically more difficult to achieve because an initially just distribution can be undone by any subsequent resource reallocation, which requires redistribution measures to undo. The third is technically the most difficult to achieve. Yet mainstream economists think it’s a piece of cake – just let unfettered markets perform their Pareto efficient magic. This reflects a gross misunderstanding of modern markets, which are largely oligopolistic/oligopsonistic because they are dominated by large privately-owned nodes of central planning. These NofCP are price-setters – prices are rarely determined by equilibrating demand and supply forces. Buyers determine how much different stuff they want at set prices. That is, demand affects the quantity produced (bought and sold).
Modern markets don’t generate Pareto efficient outcomes. The role of modern markets is to allow NofCP to tacitly communicate in order to resolve a problem that is too complex to be resolved by a single NofCP. The efficiency-enhancing role of modern markets is their ability, in certain circumstances (not all), to effectively co-ordinate economic activities in ways that central planning on a large scale cannot. Because modern markets are prone to abuses of market power and a failure to reflect all benefits and costs, they need to be heavily regulated by governments to ensure we get the most allocation benefits from them. But we should never rely on modern markets (and resource allocation) to resolve the sustainable scale and equitable distribution problems.
Philip,
Well. you’ve broadened the debate somewhat here. I agree that the current oligopolistic system cannot operate post degrowth.
By all conventions, let alone wider resource analysis, western economies are certainly unsustainable, and the rules of the game are ridiculously badly served by most economic theory. Sadly, I’d have to include much of what passes for environmental economics.
About the only thing with which I would agree with Robert Lucas (and he should know) is his attributed comment that:
“Economists…are basically storytellers, creators of make-believe economic systems”
These do not seem to reflect reality, but my main reservation is that theory does not permit allow a logical sequence of thought from theory to policy then practice.
Resource management is the practical management issue (and especially energy) that has always evaded economic theory.
Incidentally, Jevons was a Prof. at my old Uni, but his paradox, as it is based on neoclassical theory, assumes a level of elasticity and absence of regulation. Wackernagel and Rees pointed out almost 30 years ago that cost savings from efficiency gains can be taxed away, so it is not an insurmountable issue.
I tend to start from a very different perspective in looking at degrowth, more informed by the systems analysis of Donella Meadows and the historical analysis of Karl Polanyi, neither of whom is/was an economist, though Polanyi came close.
Society managed fine before the Great Transformation with other forms of material exchange. Polanyi’s outlines of these are apposite.
I’d prefer to start from Polanyi’s general position that economics is the way society meets material needs and that both societal organisation and societal values are the true foundation – just as, imo, Smith’s real master work was his theory of moral sentiments, not his economics treatise.
Polanyi took the view that “Market Society” involved a forced change in the dominant economic mindset. Prior to the Great Transformation from pre-industrial to capitalist economies, people based their outlook on reciprocity and redistribution across both personal and communal relationships. Many simple societies and small communities still do.
Post corporate capitalism, there will need to be a comparable transformation. This is where we are now, and the biggest and most depressing failing of the Left is that there seem to be no groups of thinkers seeking to formulate a coherent alternative, and politically, most so-called Labour and allegedly centre left parties have adopted managerialism of neoliberalism as their fallback.
One problem is that two of the most prominent thinkers who did write on non-capitalist futures – Andre Gorz and Murray Bookchin, (both originally from a Marxist perspective) were often impenetrable and abstruse, with Bookchin also often being somewhat temperamentally challenging, so have gained little traction over the last 40 years.
Non-hierarchical social ecology has resurfaced more recently in various manifestations and might offer a genuine alternative for the Left, but has yet to be acceptably reformulated.
As for the post degrowth world, I don’t think the “‘ think global, act local ” mantra has been superseded even after 50 years, so is still a good start point.
If a society’s livelihood strategy really has to involve an adaptation to its environment and material conditions, as Polanyi posited, then a post degrowth system cannot be expected to be a ‘business as usual’ setup on the basis of the early 21stC capitalist market stucture.
His “Substantivism” is very much worth exploring in seeking alternatives.
However, if we are headed towards embedded oligopoly and neoserfdom, (cloud or otherwise), as you note, then all bets are off.
Philip,
Well. you’ve broadened the debate somewhat here. I agree that the current oligopolistic system cannot operate post degrowth.
By all conventions, let alone wider resource analysis, western economies are certainly unsustainable, and the rules of the game are ridiculously badly served by most economic theory. Sadly, I’d have to include much of what passes for environmental economics.
About the only thing with which I would agree with Robert Lucas (and he should know) is his attributed comment that:
“Economists…are basically storytellers, creators of make-believe economic systems”
These do not seem to reflect reality, but my main reservation is that theory does not permit allow a logical sequence of thought from theory to policy then practice.
Resource management is the practical management issue (and especially energy) that has always evaded economic theory.
Incidentally, Jevons was a Prof. at my old Uni, but his paradox, as it is based on neoclassical theory, assumes a level of elasticity and absence of regulation. Wackernagel and Rees pointed out almost 30 years ago that cost savings from efficiency gains can be taxed away, so it is not an insurmountable issue.
I tend to start from a very different perspective in looking at degrowth, more informed by the systems analysis of Donella Meadows and the historical analysis of Karl Polanyi, neither of whom is/was an economist, though Polanyi came close.
Society managed fine before the Great Transformation with other forms of material exchange. Polanyi’s outlines of these are apposite.
I’d prefer to work from Polanyi’s general position that economics is the way society meets material needs and that both societal organisation and societal values are the true foundation – just as, imo, Smith’s real master work was his theory of moral sentiments, not his economics treatise.
Polanyi took the view that “Market Society” involved a forced change in the dominant economic mindset. Prior to the Great Transformation from pre-industrial to capitalist economies, people based their outlook on reciprocity and redistribution across both personal and communal relationships. Many simple societies and small communities still do.
Post corporate capitalism, there will need to be a comparable transformation. This is where we are now, and the biggest and most depressing failing of the Left is that there seem to be no groups of thinkers seeking to formulate a coherent alternative, and politically, most so-called Labour and allegedly centre left parties have adopted managerialism of neoliberalism as their fallback.
One problem is that two of the most prominent thinkers who did write on non-capitalist futures – Andre Gorz and Murray Bookchin, (both originally from a Marxist perspective) were often impenetrable and abstruse, with Bookchin also often being somewhat temperamentally challenging, so have gained little traction over the last 40 years.
Non-hierarchical social ecology has resurfaced more recently in various manifestations and might offer a genuine alternative for the Left, but has yet to be acceptably reformulated.
As for the post degrowth world, I don’t think the “‘ think global, act local ” mantra has been superseded even after 50 years, so is still a good start point.
If a society’s livelihood strategy really has to involve an adaptation to its environment and material conditions, as Polanyi posited, then a post degrowth system cannot be expected to be a ‘business as usual’ setup on the basis of the early 21stC capitalist market stucture.
His “Substantivism” is very much worth exploring in seeking alternatives.
However, if we are headed towards embedded oligopoly and neoserfdom, (cloud or otherwise), as you note, then all bets are off.
TiPi: Central planning (collective action/co-operation) is the best way to solve complex problems/issues. The world is dominated by nodes of central planning (NofCP). Many of them are privately-owned corporations. Some corporations have a turnover larger than the GDP of some small countries.
However, central planning is only good up to a point. Then a complex problem must be split up so you have multiple NofCP dealing with different parts of the larger problem. NofCP can communicate directly, but sometimes they can only communicate tacitly. That’s the role of modern markets, which are very different from pre-modern markets that you find on a Saturday morning in your local area or town square.
Most of the goods or different components of goods produced in a modern, technologically sophisticated economy will be produced by large NofCP, either publicly or privately owned. Oligopolies/oligopsonies are here to stay. Their ability to abuse market power need not stay. It can be eliminated by appropriate government regulation.
The economies of modern societies will remain monetary based if only because modern money and taxation are a brilliant means of transferring real resources from the private to the public sector to provide the public goods we desire. Prior to modern money and taxation, this was performed through tyranny. Modern money and taxation changed the world.
Because, in a monetary economy, people will have tax liabilities and a desire to save (delay spending), currency-issuing central governments need to spend more money into the system than they destroy through taxation, not just for people to be able to net save, but to maintain full employment. Being able to accumulate money (savings) means not everyone has to work for the currency issuer or sell the currency issuer something to obtain the currency to extinguish their tax liabilities. Some people can work for a person or sell something to a person with savings to obtain the currency. Hence, while modern money and taxation exists, so will markets.
The extent to which people must engage in markets depends on how institutionally deprived people are of basic necessities. The Great Transformation – people being forced to engage in markets to obtain virtually everything – was triggered by the Enclosure Laws which deprived serfs of the Commons, which they used to obtain basic necessities, such as food, fibre, and building materials. The Enclosure Movement was the most draconian form of institutionalised deprivation since slavery.
Although, in a monetary economy, people must engage in modern markets to obtain most things, governments can eliminate institutional deprivation by introducing a Job Guarantee to ensure full employment at a minimum living wage, plus use their fiscal powers to ensure people have easy access to critical public goods (e.g., in health and education), thus ensuring all people are not deprived of their basic necessities. People are not only guaranteed meaningful employment, they are guaranteed the financial means to acquire basic necessities. They are empowered (free) because they are not forced to do anything they do not wish to do. Yes, they must work, if they are physically and mentally capable, but all people fit for work above and below certain ages (as decided by society) have an obligation to contribute to the production of real wealth that they, in return, are given a financial claim to acquire. It’s called reciprocity.
Modern money/taxation and modern markets are here to stay. They are functional requisites of a modern, complex, and technologically sophisticated economy/society. Thet simply need to be harnessed in the most appropriate way to benefit society rather than be exploited, as they are at present, to benefit the rich and powerful.
Philip Lawn concludes with:
“Modern money/taxation and modern markets are here to stay. They are functional requisites of a modern, complex, and technologically sophisticated economy/society. They simply need to be harnessed in the most appropriate way to benefit society rather than be exploited, as they are at present, to benefit the rich and powerful.”
Yes, and IMO that harnessing will require recognition by economists and policians that:
1. Good government needs to oversee effective allocation of resources in both the private and public sectors.
2. Private sector resource allocation is (rightly) driven by profit in competitive markets, whereas public sector resource allocation needs to be driven by social need.
3. So good government requires two different sources of funding for the respective sectors, namely, treasury-created ‘debt-free’ money for the public sector, and bank-created ‘debt-money’ for the private sector.
4. Thus freeing government from relyng on funding by private money lenders and/or taxes, as per the current convention.
This will give the electorate a voice in how the government should allocate the nation’s available resources via both the public and private sectors; the (fiscal) task of a currency-issuing government is to manage inflation, not debt, while ensuring sustainable use of available resources.
Meanwhile the (supposedly progressive) Australia Institute still wants to raise taxes to fund desirable (non-market) social policy; the AI are part of the problem not the solution, because the electorate don’t want higher taxes, and taxpayers are susceptible to claims that taxes on the wealthy are a tax on “aspiration”. Note the Greens vote didn’t increase (as Bandt thought it would) even in the current housing, cost of living, and growing inequality crises, because “midde Australia” is not as badly affected by these crises as median/low-wage workers.
A few thoughts on planning and resource allocation…
There is definitely an absolute need for a planned approach to resource management.
The market mechanism is both exploitative and has always blindeyed externalities.
It simply does not allocate resources with a view to either eco-capacity or renewal.
However, the design of any future planning apparatus is crucial…
I’d just like to interpose an optimistic quote here (from a highly politically aware musician),
Shirley Manson – “There is no future that can’t be designed,
With some imagination and a beautiful mind”
I’d be more circumspect, given the nature of bureaucracies, and the typical lack of genuine democratic accountability in centralised structures, tendency to group think and other psychological defects in the behaviour of the managerial class. James Burnham got much of the self interest right, in his 1941 book.
In the EU there has been a centrally controlled supranational Common Fisheries policy for some decades, yet we still have an allocation of ‘total allowable catches’ divorced from the reality of the sustainability of marine ecosystems, often erring on the wrong side, and always seeming to max out the catch, rather than conserve marine habitats and ecosystems. The presumption has been to manage for exploitation.
Ignoring by-catch and permitting destructive ‘harvesting’ methods like bottom trawling has been characteristic of the CFP.
The political pressures and antipathy between nation states within the EU and intense lobbying by sectional interests has always been problematic, with fisheries being a touchstone issue for the chauvinism of the UK Brexit right, and their misplaced notion of divine sovereignty.
Elinor Ostrom tackled this problem of the ‘tragedy of the commons’ quite differently, with an emphasis on local responsibility, as local communities are best at managing their natural resources as they are the ones that use them, so are most impacted by loss, and that regulation on the use of resources should be undertaken at the local level, as opposed to a higher central authority that does not have direct interaction, or any livelihood dependent on sustaining the resource. Very much a ‘small is beautiful’ approach. I don’t think this could work at the co-ordinating level, but it is a valid template..
Again, it is the underlying societal ethos that will determine the operation and outcomes of the institutional resource allocating framework, as such thinkers as Polanyi, Smith, Kropotkin, Gramsci and Foucault have all advanced. It’s nothing new as an issue.
There has been an interesting recent discussion, by Wolff and Hudson, which remarked on the success of the Chinese hybrid economic system, in terms of economic development,
Noting that the Chinese economy is about 50% private capitalist enterprise, and 50% government-owned and operated enterprises, the point is that this centralised Chinese control has been very effective in developmental terms in creating and sustaining growth, much more so than the US centralised control operated by the US financial sector, (but that being entirely for its own financial self interest according to Hudson).
China still has the underpinning and longstanding ethical values of Confucianism governing its state control, and maybe a strong ethos of Chinese mutualism with their Confucian philosophical values guiding centralised action might succeed in acting on behalf of collective societal interests, as it has in Chinese accelerated development. It is model worth consideration, anyway.
That any future central planning needs public accountability and the self discipline of a foundational ethos is a truism. Thereby hangs a thread…
TIPI writes:
“That any future central planning needs public accountability and the self discipline of a foundational ethos is a truism. Thereby hangs a thread…”
So long as the CCP genuinely has “common prosperity” as its goal, with its promise of “a green, prosperous, socialist society by 2049 (while discouraging private sector corruption) – 2049 being the the centenary of CCP government, then the one-party system will maintain its support within China.
More damaging for China is the problem afflicting ALL countries; ie the *current mainstream orthodoxy re government debt* followed by all governments from the IMF down (currently causing chaos in the US with Trump’s ‘Big Beautiful Bill’; and even little Tasmania…does government debt rule out a footy oval which both mainsteam parties want, but the Green’s don’t, because of government debt?)
Hence the need for systemic change; government debt need not exist at all, and should have nothing to do with sustainable resource allocation.
Google Steve Keen’s well-documented article : “Triggering Crises by Reducing Government Debt”.
The profit motive only works to society’s benefit if governments install and enforce strict workplace, remuneration, environmental, and product standards; maintain full employment; provide sufficient and easily accessed public goods and public housing (thereby reducing the need to engage in markets – i.e., be subject to the whims of markets – to meet basic needs); quell abuses of market power; and provide information to the public about healthy lifestyles (to counter private sector advertising, which often does the opposite). One might say, “ban advertising”, but that comes a bit too close to censorship for my liking. Mind you, I have no problem with the banning of tobacco advertising. I drink alcohol (I like a glass or two of red wine), but I’d be all for the banning of advertising of alcohol and gambling.
A throughput constraint would prevent businesses from profiting from excessively extracting natural resources and generating excessive waste. Perhaps, then, profit might reflect genuine service to society.
One of our biggest problems is the inadequate nature of our political system and institutions. They are presently incapable of producing socially beneficial governments, which are needed to eliminate institutional deprivation and provide the foundations, such as those above, for the profit motive and the operations of privately-owned nodes of central planning – coordinated by heavily regulated modern markets – to generate socially beneficial outcomes.
As regards Neil’s 08JUN25 at 19:08 “4. Thus freeing government from relying on funding by private money lenders and/or taxes, as per the current convention.” wouldn’t it be in the majority’s interests to convert private banking to public banking and transform its practice of advancing credit to those in the non-government into a public utility? Leaving private profit extracting rentier banking to continue to plunder the many is akin to leaving the water supply in private hands. We can all see how well that has turned out by observing the UK.
The Chinese government seems to have well understood the importance of maintaining control of its money when it stomped on Jack Ma and sent him to purgatory for a time when he started to develop an alternative.
Playing by the rules of the orthodoxy, that The Australia Institute continue to espouse, demonstrates how FITHED the self-proclaimed (left) progressives are in not embracing an MMT understanding of monetary operations. They and their ilk are a major obstacle for change.
Thanks Fred.
Philip Lawn obviously doesn’t want to address the political issues I raised; and indeed a chief educator with the online Torrens Uni ‘Modern Money’ curriculum insisted to me the Australia Institute are a worthy outfit which progressives should value as allies …..go figure.
No wonder MMT is still irrelevent in mainstream discourse, and the Greens aren’t interested in knowing why their vote didn’t increase (as Bandt was sure it would), even in the current housing, cost-of-living, and qrowing inequality crises.
To Fred Schilling and Neil Halliday (at various times)
The Australia Institute is not a progressive organisation in my view. They choose to play what they deem to be politically clever games while continuing to perpetuate and reinforce mainstream economic fictions. That renders them worse than those who are just ignorant of the reality.
One cannot be an ally with groups who ‘frame’ your ideas out of the debate.
As to Torrens Uni – it is a profit-seeking privately owned institution on the margins. It is deeply disappointing that anyone who wanted to promote the ideas that I helped develop and introduce would think it appropriate to offer MMT courses at an institution that exists solely to make profits for the foreign owned private equity concern. I am totally against that idea and I wish they would cease.
But don’t blame the ideas – it is just that some marginal characters get involved and think they can make something for themselves by associating with the ideas.
best wishes
bill
I’m no fan of The Australia Institute. I taught one subject at Torrens University because I made a commitment that I honoured. I am no longer teaching at TU. TU was approached because no public university approached wanted to touch a programme that explicitly had MMT in it.
Neil: Identify the political issues you think I’ve avoided and I’ll address them. If you think China is a model for the ROW to follow, you are delusional. Simply stamping out an alternative form of money does not equate to having control of the money supply. So long as banks are able to create credit money ex nihilo the central government cannot set a money supply target as central banks found out when they tried to control national money supplies in the late-1970s as per Milton Friedman’s Quantity Theory of Money (nonsense) suggestion.
Phil,
Rather than critiquing the 4 points I listed (May 9th), to change the mainstream narrative that resource allocation is dependent on taxation and debt, you simply restated stuff we (MMTers) all agree with – while slipping this in: ” for the profit motive and the operations of privately-owned nodes of central planning –” ….without commenting on my point that the public sector should not have to rely on the private sector – or its profits – for public sector funding.
As for China: guess why all of us in the West are being told by the US to increase “defence” spending, while ‘balancing government budgets’ as per the mainstream narrative – meaning ‘more guns, less butter’?
Hint: basically to “defend” against the CCP reasserting Chinese sovereignty In Taiwan (which is none of our business) because that would disadvantage US capacity to maintain global hegemony vis a vis China.
Imo China should be viewed dispassionately as a ‘show case’ for One Party government, so long as the Chinese people are pleased to “ignore politics and get rich” – as one woman in China said, during Trump’s latest election in the US; god knows our adversarial muilti party ‘democracies’ are dysfunctional enough.
And as I said, PBofC economists – Harvard trained neoclassicists to a man/woman – are as damaging to Chinese prosperity as our own central banks are to us (indeed I read in the SCMP that MMT is illegal in China); China’s vast market and massive production capacity (laughably called “over capacity” by Western economists who know the West can’t compete with China) means China doesn’t need to access rich consumers in the US, instead it could subsidize consumption by low income groups ( 700 million people) in China, by issuing debt-free yuan to fund said subsidization while avoiding inflatiion (note: DE-flation is the problem in China since the pandemic)). The PBodC could also fund BRI productivity-enhancing infrastructure without creating ‘debt traps’ , by organizing currency swaps with the participating nations, when the resources exist to build the infrastructure.
Back to our economy: at the National Press Club today, Albo said he wants to ensure “no-ome is left behind”, while at the same time he included this gem: lower taxes are ‘”the Australian way”…..while his Treasurer is committed to ‘balancing the budget’. ( I emailed the new Minister for ‘Housing and Cities’, to warn her the new head of Dept of PM&C, Steven Kennedy, will also be demanding balanced budgets, which means she (as Housing Minster) won’t be able to fund 1.2 million new homes by 2030, including affordable homes for low income groups, given Oz is now sporting the world’s most expensive housing , while builders are going broke and costs are going though the roof. I mentioned that Menzies WAS able to house everyone in Oz, via public and private housing, with public housing funded by Keynesian deficit spending (1946-1970s) while maintaining full employent with low inflation.
Neil: Who do you mean by ‘MMTers’? Many people who claim to be MMTers don’t understand modern money at all.
My argument about ”… the profit motive and the operations of privately-owned nodes of central planning …” is that modern markets are an effective means of co-ordinating privately-owned nodes of central planning (it has nothing to do with the unfettered generation of Pareto-efficient outcomes, as mainstream economists would have you believe), but that all comes to nothing if modern markets are not effectively regulated; there are no effective standards (workplace, product, environmental); and citizens are forced to make choices between unacceptable options because of institutional deprivation. We get, as we do at present, the effective allocation of resources towards undesirable aims by often unethical and unjust means. Bad means can efficiently achieve bad ends. We need good means (ecologically sustainable and equitable means) to efficiently achieve good ends. That won’t happen without good government, which is non-existent at present, if it has ever been present (our current problems are decades(?), centuries(?), millennia(?) in the making).
Your comment, “that the public sector should not have to rely on the private sector – or its profits – for public sector funding” is irrelevant in terms of what I said, because they don’t rely on private sector profits, and I never said they do.
On China. 1.4 billion people (grossly overpopulated); the world’s largest GHG emitter; a pro-growth mentality in an over-bloated human filled world (including our stuff); essentially an ecological ticking time-bomb; a country that has outcompeted Western nations by exploiting the degenerative race-to-the-bottom forces of globalisation (helped by an oppressive central government willing to do evil things to suppress civil opposition – e.g., Tienanman Square); has stupidly handed its productive capacity gains to the ROW by engaging in a net-exporting policy (export costs exceed import benefits) to accumulate currency-issuing central government bonds of foreign nations (which can be redeemed by the foreign govts with computer keystrokes (i.e., at no cost)) because the Chinese central government has failed to net-spend sufficiently to meet its citizens net-savings desires; and I could go on and on. No country that I’d want to live in.
Many of your comments are criticisms of other people, not of me. Why raise them?
Since when is the Chinese/Taiwan issue “none of our business”? All attempts to annex another State is our business. In fact, anything that happens in this world is ‘our business’. That’s why nations have departments of foreign affairs. We may decide, if China acts, that what it does is justified and is being performed in an ethical and peaceful way. But what happens in this world is everyone’s business. Your attitude assumes we should (when it is convenient?) turn our backs on what happens in this world.
What have the views of Harvard economists go to do with what I said? What has ‘Albo’s’ comments got to do with what I said?
The lack of public housing aside, the housing crisis is essentially a demand-side problem – tax breaks should be removed to extinguish the speculative demand for property (which drives up property prices), and Australia should aim for zero population growth (also for ecological reasons). There is no shortage of housing in Australia. There is a shortage of affordable housing. With things as they are, the goal to build more houses will just provide more assets for the speculators to purchase for capital gain. I drove to Melbourne from Adelaide last week. Talk about a city that has outgrown itself. The Western Highway within the city limits is something from a science fiction horror movie. Parts of it make the first Mad Max movie seem like an urban paradise. Miles and miles of poorly designed dog-boxes plonked away from view (behind huge walls) – places where people sleep at night in between work (if they have it) and shopping at their local shopping mall. Utter 21st century madness making some people very rich at a huge ecological/resource cost and human cost (quality of life?). When I was young, I did a geography major as part of my Bachelor of Economics. I chose to do the physical and economic geography streams in my geography major, but some of my friends did the urban geography stream. Chats with them sometimes involved discussions about urban planning and the problems of overpopulation. What happened to that public discussion? It disappeared because it got in the way of profit-making and led to the conclusion that population growth was a problem – the sort of profit-making that leads to bad outcomes because of the lack of what I mentioned above (when profit-making and modern markets go wrong).
Neil: I’m not going to debate this with you on Bill’s blog anymore. This is not the place to engage in debate. It’s not fair on Bill. Happy to debate it with you elsewhere, although I’ve got a lot of important (time-consuming) things to do.
Philip makes a number mistakes:
1. He says “Taiwan is a nation” , even though the UN doesn’t recognize it as such – though the UN itself is incapacited by the tension between ‘authority” and ‘freedom’, as Doc Evatt discovered at the founding of the UN in 1945, with its mission “to save mankind from the scourge of war” – a failed mssion statement of the UN Charter which has relevance to Bill’s latest post.
2 Phil regards the funding of public housing as ‘an aside’; when it’s at the core of ensuring everyone is decently housed in a free enterprise economy. So long as the public sector is forced to fund itself with private sector ‘debt money’, public housing will never be properly funded.
3. Phil doesn’t like the “nanny state” – another manifestation of the tension between “authority” and “freedom”, as governments – forced to rely on private sector ‘debt money’ – want revenues from gambling, smoking and alcohol while attempting to deal with the social harms.
Neil: I said that I won’t be debating these things on Bill’s blog site. I won’t debate you anywhere on the points you have made in your last comment because you have put words into my mouth. I don’t deal with people who use such a tactic.
Phil, I not debating you; I didn’t expect you to reply (because you said you wouldn’t).
I’m explaining to others who read these comments , inter alia, Fred’s point (in Bill’s latest topic) about “toddlers with nukes” – the sad reality of our world; and why the UN’s mission statement failed – the fault lies in all of us, torn as we are between the desire for “freedom” and the need for “authority” to avoid the chaos which still ruins our beautiful world.
Christians hope the ‘2nd Coming’ will fix the mess….I think men will have to fix it themselves…
Neil: Well stop claiming I’ve said things that I haven’t! In other words, stop misrepresenting me. Stick to your own ideas and leave me out of your comments.
Phil.
Not while you claim we have to “defend” Taiwan….which is why we are now facing another arms race; Russia is actually a side show, China is the only nation capable of surpassing US power, and Trump knows it.
I will say something about ‘democratic legitimacy’ versus ‘democratic deficit’ – which Bill raises in his latest topic – in the comments section there.
Don’tcha just love it when they provide an almost immediate confirmation of what bill, I and many others see with The Australia Institute being a significant obstacle in Australia to rapid societal change because of our ongoing flawed way of doing economics? It is not enough to have your heart in the right place but your head must be there, too.
Richard Denniss from 2:54 https://www.youtube.com/watch?v=JOtdTTNrGC4 “What I can’t go along with is people lying or flat out lying to the public’s face to get what they want from the economy, what they want for their society, what they want.” says what I and so many others can absolutely agree with. However, Denniss also exposes himself, by those words, as a hypocrite and a liar via his ongoing public denial of the reality of the tenets of descriptive MMT which show that public spending comes first, where he says from 3:58 “I do have a preference for collecting a bit more tax from the fossil fuel industry and spending more of it on public health and public education. That’s my preference.”. In the context of those words the only reasonable interpretation of “spending more of it” must be spending more of those taxes collected from the fossil fuel industry on public health and public education. What a hypocrite is Richard Denniss, and out of his own mouth.