On May 19, 2026, Oxfam Australia's media release - Australian billionaires’ wealth grows by $50,000…
Australia – latest wages data shows workers’ purchasing power still going backwards
Yesterday, the RBA cut interest rates for the first time since November 2023. They claimed that further rate cuts would at least require further evidence of wage restraint, which tells you how the public debate has been so thoroughly taken over by fiction. Australia is experiencing a drought, not the regular paucity of rainfall, type of drought, but record low rates of growth in wages. The RBA defended its interest rate hikes with the assertion that they had intelligence from the business community that wages were about to break out in 2022, invoking a 1970s-style wage-price spiral in response to the initial supply shocks coming from the pandemic. Nothing of the sort happened. And the latest data shows that things haven’t changed. Today (February 19, 2025), the Australian Bureau of Statistics released the latest – Wage Price Index, Australia – for the December-quarter 2024, which shows that the aggregate wage index rose by 3.2 per cent over the 12 months (down 0.3 points on the last quarter). Quarterly wages growth was 0.7 per cent, which the ABS noted was the “Lowest quarterly wage growth since March 2022”. In relation to the December-quarter CPI change (2.4 per cent), this result suggests that workers achieved modest real wage gains. However, if we use the more appropriate Employee Selected Living Cost Index as our measure of the change in purchasing power then the December-quarter result of 4.0 per cent means that real wages fell by 0.8 points. Even the ABS notes the SLCI is a more accurate measure of cost-of-living increases for specific groups of interest in the economy. However, most commentators will focus on the nominal wages growth relative to CPI movements, which in my view provides a misleading estimate of the situation workers are in.
Latest Australian data
The Wage Price Index:
… measures changes in the price of labour, unaffected by compositional shifts in the labour force, hours worked or employee characteristics
Thus, it is a cleaner measure of wage movements than say average weekly earnings which can be influenced by compositional shifts.
The summary results (seasonally adjusted) for the December-quarter 2024 were:
| Measure | Quarterly (per cent) | Annual (per cent) |
| Private hourly wages | 0.7 (-0.1 points) | 3.2 (-0.3 points) |
| Public hourly wages | 0.6 (-0.2 points) | 2.8 (-0.9 points) |
| Total hourly wages | 0.7 (-0.1 points) | 3.2 (-0.3 points) |
| Employee Selected Cost-of-Living measure | 0.3 (-0.2 points) | 4.0 (-0.7 points) |
| Basic CPI measure | 0.2 (stable) | 2.4 (-0.4 points) |
| Weighted median inflation | 0.5 (-0.4 points) | 3.4 (-0.4 points) |
| Trimmed mean inflation | 0.5 (-0.3 points) | 3.2 (-0.4 points) |
On price inflation measures, please read my blog post – Inflation benign in Australia with plenty of scope for fiscal expansion (April 22, 2015) – for more discussion on the various measures of inflation that the RBA uses – CPI, weighted median and the trimmed mean.
The latter two aim to strip volatility out of the raw CPI series and give a better measure of underlying inflation.
The ABS press release – Lowest quarterly wage growth since March 2022 – notes that:
The Wage Price Index (WPI) rose 0.7 per cent in the December quarter 2024, and 3.2 per cent over 2024 …
The 0.7 per cent rise this quarter was the equal lowest growth since March quarter 2022. At 3.2 per cent, the annual increase in wages was down from 4.2 per cent in December quarter 2023 and is the equal lowest since December quarter 2022 …
Private sector annual growth (+3.3 per cent) was the lowest since June 2022, while annual wage growth for the public sector (+2.8 per cent) fell below 3 per cent for the first time since the June quarter 2023 …
Compared to the December quarter 2023, the private sector saw a drop in both the proportion of jobs with a wage movement (+14 per cent compared to +16 per cent), and the average hourly wage change (+3.7 per cent compared to +4.4 per cent) …
This was the smallest proportion of jobs with a change in wages for the private sector in a December quarter since 2019 …
Summary assessment:
1. The quarter’s results show a softening in nominal wages growth and a modest real wage gains using the CPI-based inflation measures.
2. However, in saying that, we have to consider what is the most appropriate cost-of-living measure to deploy (see below).
3. When the price movements for the expenditure patterns that employees follow are taken into account, real purchasing power continues to decline – by 0.4 points in the December-quarter.
Inflation and cost of living measures
There is a debate as to which cost-of-living measure is the most appropriate.
The most used measure published by the Australian Bureau of Statistics (ABS) is the quarterly ‘All Groups Consumer Price Index (CPI)’.
Reflecting the need to develop a measure of ‘the price change of goods and services and its effect on living expenses of selected household types’, the ABS began publishing a new series in June 2000 – the Analytical Living Cost Indexes – which became a quarterly publication from the December-quarter 2009.
In its technical paper (published October 27, 2021) – Frequently asked questions (FAQs) about the measurement of housing in the Consumer Price Index (CPI) and Selected Living Cost Indexes (SLCIs) – the ABS note that:
The CPI and SLCIs are closely related. All these indexes measure changes in prices paid by the household sector (consumers) for a basket of goods and services provided by other sectors of the economy (e.g. Government, businesses). The weights in the ‘basket’ represent amounts of expenditure by households on goods and services bought from other sectors. Goods traded between households (like buying and selling existing houses) are excluded as both sides of the transaction occur within the household sector.
I discuss these indexes in detail in this blog post – Australia – real wages continue to decline and wage movements show RBA logic to be a ruse (August 16, 2023).
In effect, the SLCIs represent a more reliable indicator of ‘the extent to which the impact of price change varies across different groups of households in the Australian population’.
There are four separate SLCIs compiled by the ABS:
- Employee households.
- Age pensioner households.
- Other government transfer recipient households.
- Self-funded retiree households
The most recent data – Selected Living Cost Indexes, Australia – was published by the ABS on February 5, 2025 for the December-quarter 2024.
Between the December-quarter 2023 and the December-quarter 2024, the growth in the respective SLCIs has been:
- Employee households: 4.0 per cent (-0.7 points).
- Age pensioner households: 2.5 per cent (-1.0 points).
- Other government transfer recipient households: 3.2 per cent (-1.1 points).
- Self-funded retiree households: 2.5 per cent (-0.2 points).
The ‘All groups CPI’, by contrast, rose 2.4 per cent over the same period (as in above Table).
The following graph shows the differences between the CPI-based measure and the Employee SLCI measure which better reflects the changes in cost-of-living.
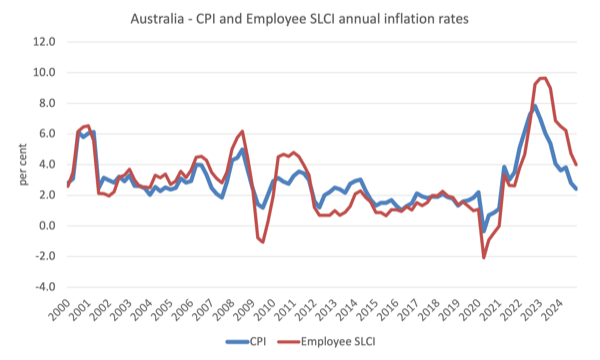
Thus, when specific household expenditure patterns are more carefully modelled, the SLCI data reveals that the cost-of-living squeeze on ‘employee households’ is more intense than is depicted by using the generic CPI data.
The ABS considers the ‘Employee households SLCI’ to be its preferred measure designed to capture cost-of-living changes more accurately for ‘households whose principal source of income is from wages and salaries’.
Summary of Real Wage Movements
- The relevant cost-of-living measure for workers has risen by 4.0 per cent over the last year while wages growth was just 3.2 per cent – a decrease in the real purchasing power of wages of 0.8 points.
- However, the media wrongly focus on the CPI as the relevant inflation measure and conclude that with the rise in the CPI of 2.4 per cent, the nominal wage growth of 3.2 per cent delivers a real wage rise of 0.8 points.
- Which is misleading in terms of the purchasing power movements.
Real wage trends in Australia
The summary data in the table above confirm that the plight of wage earners continues in Australia.
The extent of the real wage decline over the last 12 months depends on the cost-of-living measure used (see previous graph for a comparison between the CPI measure and the Employee SLCI measure).
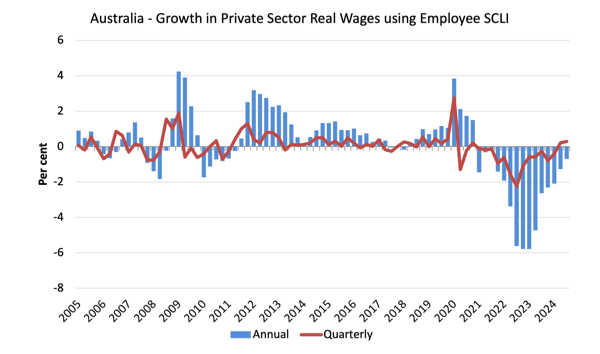
To further reinforce that point, the following graph uses the Employee SLCI measure to show the movement of real wages in the private sector from 2005 to the December-quarter 2024.
In terms of the SLCI measure, there has been a dramatic drop in real wages in the economy over the last 14 quarters.
Workers in the private and public sectors have both experienced sharp declines in the purchasing power of their wages.
This is at the same time as interest rates have risen significantly.
The fluctuation in mid-2020 is an outlier created by the temporary government decision to offer free child care for the December-quarter which was rescinded in the December-quarter of that year.
Overall, the record since 2013 has been appalling.
Throughout most of the period since 2015, real wages growth has been negative with the exception of some partial catchup in 2018 and 2019.
The systematic real wage cuts indicate that wages have not been driving the recent inflationary episode.
Workers have only been able to secure partial offset for the cost-of-living pressures caused by the supply-side, driven inflation.
The great productivity rip-off continues
While the decline in real wages means that the rate of growth in nominal wages is being outstripped by the inflation rate, another relationship that is important is the relationship between movements in real wages and productivity.
As part of their attempt at justifying the interest rate hikes, the RBA has been making a big deal of the fact that wages growth is too high relative to productivity growth.
Historically (up until the 1980s), rising productivity growth was shared out to workers in the form of improvements in real living standards.
In effect, productivity growth provides the ‘space’ for nominal wages to grow without promoting cost-push inflationary pressures.
There is also an equity construct that is important – if real wages are keeping pace with productivity growth then the share of wages in national income remains constant.
Further, higher rates of spending driven by the real wages growth can underpin new activity and jobs, which absorbs the workers lost to the productivity growth elsewhere in the economy.
The following graph shows the annual change (per cent) in Real Unit Labour Costs from the December-quarter 1999 to the December-quarter 2024 using the CPI measure to deflate nominal wages.
I use this deflator rather than the Employee SLCI because it reflects the prices that goods sell at rather than the purchasing power changes that reflect expenditure patterns of workers.
Real Unit Labour Costs (also equivalent to the wage share in income) is the ratio of real wages to labour productivity.
So up until the December-quarter 2024,even though productivity growth has been weak or sometimes negative since 2020, RULCs have continued to fall, because the real wage growth has been weaker than the productivity growth.
In some quarters, the fall in real wages has outstripped the fall in productivity growth.
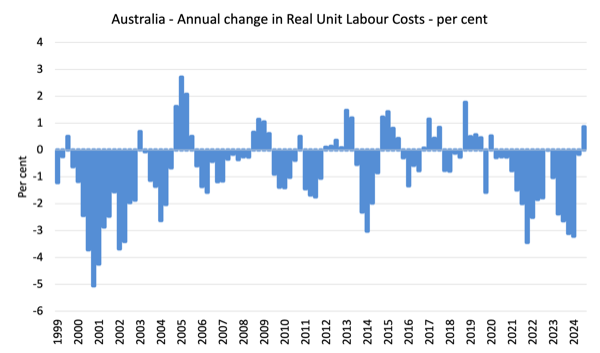
In the most recent quarter, RULC rose because real wages rose (using the CPI figure) while productivity growth was negative.
I am sure the RBA will seize on that outcome to claim there is a wages problem.
However, the productivity growth result is driven, in part, by an outlier observation in the December-quarter 2023 and relative to the March-quarter 2024, productivity growth has accelerated.
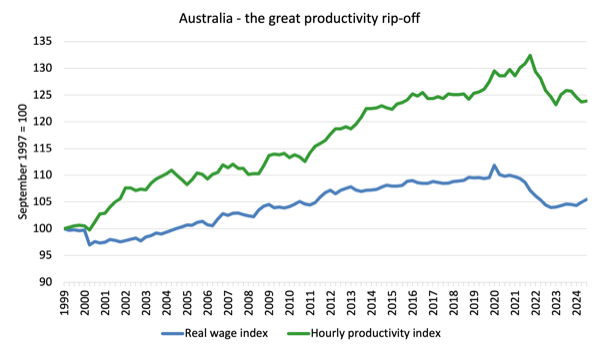
We can see that in the following graph which shows the total hourly rates of pay in the private sector in real terms deflated with the CPI (blue or lower line) and the real GDP per hour worked (from the national accounts) (green or upper line) from the June-quarter 1999 to the December-quarter 2024.
It doesn’t make much difference which deflator is used to adjust the nominal hourly WPI series. Nor does it matter much if we used the national accounts measure of wages.
But, over the time shown, the real hourly wage index has grown by only 5.5 per cent (and falling sharply), while the hourly productivity index has grown by 23.9 per cent.
The dip in productivity growth is due to the parlous investment rates of Australian businesses.
If I started the index in the early 1980s, when the gap between the two really started to open up, the gap would be much greater. Data discontinuities however prevent a concise graph of this type being provided at this stage.
For more analysis of why the gap represents a shift in national income shares and why it matters, please read the blog post – Australia – stagnant wages growth continues (August 17, 2016).
Where does the real income that the workers lose by being unable to gain real wages growth in line with productivity growth go?
Answer: Mostly to profits.
These blog posts explain all this in more technical terms:
1. Puzzle: Has real wages growth outstripped productivity growth or not? – Part 1 (November 20, 2019).
2. Puzzle: Has real wages growth outstripped productivity growth or not? – Part 2 (November 21, 2019).
Conclusion
In the December-quarter 2024, Australia’s nominal wage growth grew by 3.2 per cent.
While most commentators will focus on the nominal wages growth relative to CPI movements, the more accurate estimate of the cost-of-living change is the Employee Selected Living Cost Index, which is still running well above the CPI change – meaning that real purchasing power of the nominal wages is still falling sharply.
That is enough for today!
(c) Copyright 2024 William Mitchell. All Rights Reserved.
it shows just how rigged the system is when re lights start flashing because wages are barely a few percent above inflation for moment or two.
But when wages growth lags behind productivity growth by 18% the media, politicians, and business leaders are completely silent.
People need to wake up.