On May 19, 2026, Oxfam Australia's media release - Australian billionaires’ wealth grows by $50,000…
Industrial disputation remains at record lows in Australia – the complete victory of capital over the working class
The Australian Bureau of Statistics (ABS) released the latest data today (March 12, 2025) on – Industrial Disputes, Australia – which covers the December-quarter 2024. The data shows that there was a slight decline in the number of industrial disputes over the last 12 months, although the number of working days lost rose significantly (by 15.4 per cent in the quarter). However, disputation remains at record lows. That fact is one of the success stories of neoliberalism and the way that the interests of Capital have co-opted government to ensure the income distribution was shifted back in favour of profits at the expense of wages. There are all sorts of explanations given to explain the low real wages growth in Australia over the last few decades and all try to sheet home the blame to global factors or demographic shifts. But the fact remains that there was concerted action by government under pressure from the employer groups to introduce legislation and regulation that undermined the capacity of the trade unions to pursue action in the interests of their members. That action was very successful from the perspective of capital and devastating to workers. Today’s blog post is really just a set of notes about the trends shown in this data.
Here are some graphs that frame the discussion.
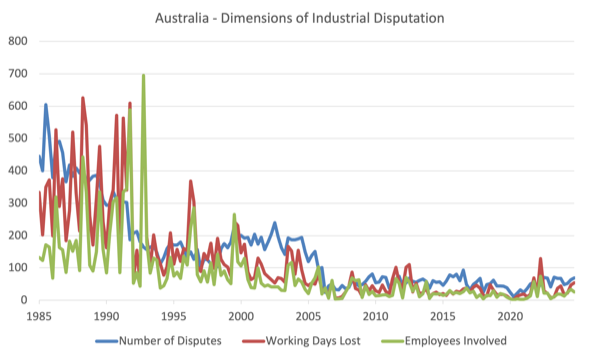
There are various ways in which one can analyse the manifestations of class warfare – number of disputes, number of working days lost, and the number of employees involved.
The current industrial disputes data series from the ABS start at the March-quarter 1985 and provide data on all three measures up until the December-quarter 2024 (today’s release).
The first graph shows the three series over that period and while there is a lot of noise in the data, the trends are clear.
This decline in industrial disputation has been huge and has been the result of deliberate public policy to weaken unions and make it easier for bosses to prosecute unions who engage in industrial action.
The decline marked the beginning of the period when government turned from being a mediator in the class struggle between labour and capital and became an agent for capital.
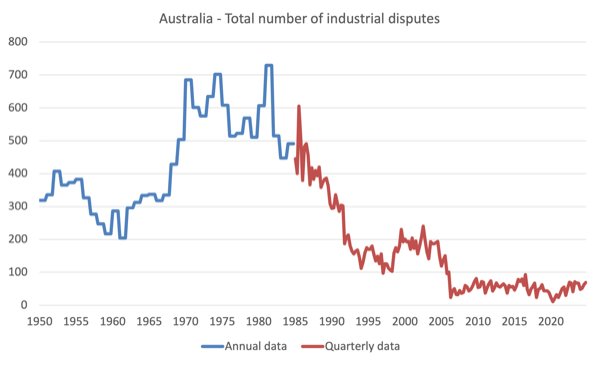
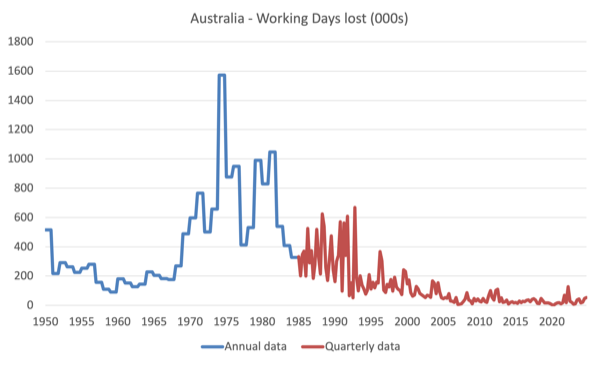
But we get an even better idea of how the industrial relations terrain has shifted by patching together older annual data from 1950 to 1984 to the current quarterly data shown in the previous graph.
The next two graphs show the number of industrial disputes and the working days lost from 1950 to the December-quarter 2024 (the quarterly data series from the ABS begins in the March-quarter 1985).
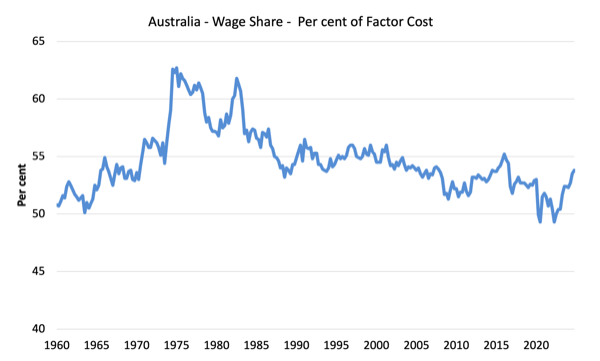
Further, we have consistent wage share data from the September-quarter 1959 to the December-quarter 2022, which is shown in the next graph.
The distribution of national income in terms of the wages share peaked at 62.7 per cent in the March-quarter 1975.
By the December-quarter 2024, the wage share had fallen to 53.8 per cent.
The decline is multi-varied but a major driving force has been the declining capacity of trade unions to effectively represent their members’ interests.
Historical – Trade Union Statistics, Australia, December 1975 – show that union membership was on the rise in that year:
Total membership increased by 52,100 (1.9 per cent) – Total membership increased by 52,100 (1.9 per cent) over 1974 to 2,814,000 … Between 1970 and 1975 male membership increased by 12 per cent and female membership by 5O per cent.
Scaling that by the size of the labour force, we learn that:
Trade union members at the end of 1975 represented 58 per cent of employed wage and salary earners. The 58 per cent of employed wage and salary earners. The percentage for males was 63 per cent and for females percentage per 48 per cent.
Fast track into the present and the most recent ABS release of relevance – Trade Union Membership – tells a bleak story for workers:
In August 2024:
– 13.1% of employees (1.6 million) were trade union members …
– Since 1992, the proportion of employees who were trade union members has fallen from 40%.
So in 1975, the coverage was 58 per cent.
By 1992, it has fallen to 40 per cent.
And by August 2024, it was down to 13.1 per cent.
But the most recent data release also contained some good news.
Between August 2022 and August 2024, trade union members showed:
… an increase on the 12.5% recorded in August 2022.
Trade unions protected workers during the Covid lockdowns and hopefully there has been a tipping point in membership as workers realise that without that protection the bosses are going to continue to undermine working conditions and suppress real wages growth.
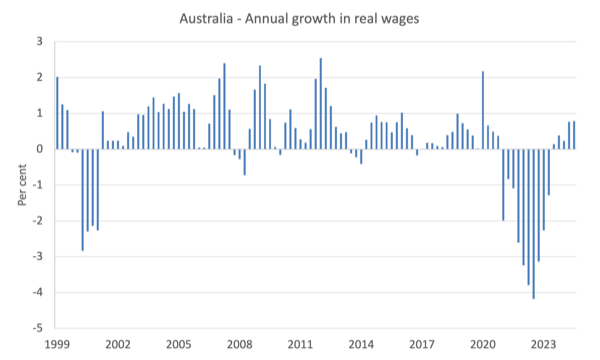
The other dimension of neoliberalism that bears on the working class is the rate of growth in real wages.
The following graph shows the annual percentage change in real wages from the March-quarter 1999 to the December-quarter 2024.
In historic terms this sample is showing very modest rates of growth interspersed with lengthy periods of contracting purchasing power for workers.
This Table draws on a different database (based on National Account wage measures) to shows the average annual real wage compensation for the decades.
| Decade | Average Annual Growth (%) |
| 1960s | 5.66 |
| 1970s | 4.14 |
| 1980s | 2.56 |
| 1990s | 3.12 |
| 2000s | 2.66 |
| 2010s | 2.66 |
| 2020s | 2.23 |
The attack on the working class in Australia began after the first OPEC oil crisis in October 1973 but accelerated in the second-half of the 1980s when the then Labor government (yes!) watered down the industrial relations system that protected industrial action.
From then (aligning with the data trends shown) there have been a sequence of legislative changes by both Labor and Conservative federal governments, which outlawed many formerly accepted industrial strategies by workers to put pressure on bosses to hand over a fair share of the productivity growth and protect wages from inflation.
No parallel constraints on price gouging by corporations has been entertained by the government.
The data above records the victory of capital over the workers in this post-industrial era.
Hopefully, the latest sign that trade union member is growing again is the tipping point.
Smith Family Manga continues this Friday – the last episode in Season 2
The final episode in Season 2 (Episode 12) of the – Smith Family Manga – will appear this Friday and the community is shocked when a desperate Prime Minister, who has deliberately pushed millions into unemployment on the back of advice from economists that the public debt ratio was too high, delivers an address to the nation.
Mrs Boff makes a reappearance (The IMF Crisis: 40 Years On).
And Denis Healey is channelled.
The Manga will take a short break (about 4 weeks) while we work out what happens next, which will be a lot.
That is enough for today!
(c) Copyright 2025 William Mitchell. All Rights Reserved.
This Post Has 0 Comments