Economics and business correspondents regularly serve as apologists for poor policy. Their motivation is to…
Australia – real wages continue to decline and wage movements show RBA logic to be a ruse
Yesterday (August 15, 2023), the Australian Bureau of Statistics released the latest – Wage Price Index, Australia – for the June-quarter 2023, which shows that the aggregate wage index rose by 0.8 per cent over the quarter (steady) and 3.6 per cent over the 12 months. This represented a slowdown over the 12 months on the previous quarter’s result. If we consider the rate of increase in the CPI in relation to this nominal wages growth then in the June-quarter the two were equal and so real wages were steady. However, over the last 12 months, real wages have fallen by 2.4 per cent using the CPI measure. But the ABS note that the CPI is not a good indicator of cost-of-living changes and they have produced special time series based on expenditure patterns for selected groups including employees. If we use the Employee Selected Cost of Living Indicator we find that real wages fell by 0.7 points over the June-quarter 2023 and by a stagerring 6 points over the 12 months. That puts the Treasurer’s spin that the latest data is a good sign into perspective. Further with the gap between productivity growth and real wages increasing, the massive redistribution of national income away from wages to profits continues. Further, the RBA continue to claim there is a threat of a wages breakout and so interest rates have to keep rising to create the necessary unemployment increase to prevent that from happening. It is just a ruse. There is no sign of a wages breakout.
Latest Australian data
The Wage Price Index:
… measures changes in the price of labour, unaffected by compositional shifts in the labour force, hours worked or employee characteristics
Thus, it is a cleaner measure of wage movements than say average weekly earnings which can be influenced by compositional shifts.
The summary results (seasonally adjusted) for the June-quarter 2023 were:
| Measure | Quarterly (per cent) | Annual (per cent) |
| Private hourly wages | 0.8 (steady) | 3.6 (-0.2 points) |
| Public hourly wages | 0.7 (-0.2 points) | 3.1 (+0.2 points) |
| Total hourly wages | 0.8 (steady) | 3.6 (-0.1 point) |
| Employee Selected Cost-of-Living measure | 1.5 (-0.5 points) | 9.6 (steady) |
| Basic CPI measure | 0.8 (-0.4 points) | 6.0 (-1.0 point) |
| Weighted median inflation | 0.9 (-0.3 points) | 5.5 (-0.4 points) |
| Trimmed mean inflation | 0.9 (-0.3 points) | 5.9 (-0.7 points) |
On price inflation measures, please read my blog post – Inflation benign in Australia with plenty of scope for fiscal expansion (April 22, 2015) – for more discussion on the various measures of inflation that the RBA uses – CPI, weighted median and the trimmed mean. The latter two aim to strip volatility out of the raw CPI series and give a better measure of underlying inflation.
We learned two things at least from the data:
1. The RBA’s continual claims that its private wage briefings from industry indicated a wages breakout was building were flawed if not fallacious
There is no wages breakout and that fear cannot no longer be used to justify the rate hikes.
2. The political class can spin anything.
Despite the annual wages growth rate in decline, the Federal Treasurer came out in the media yesterday extolling the virtues of these wage results, claiming victory for its wage strategy.
He said:
This is the first time in three years that quarterly wages have kept up with inflation – and much better than the fall of 1.5 per cent in the March quarter 2022
It was a bizarre demonstration of spin.
He focused on the fact that the CPI increase in the June-quarter was 0.8 per cent and that matched the wages growth, which he claimed was a sign that the government was delivering on real wages growth.
Well if we consider the annual wages growth of 3.6 per cent and the annual shift in the CPI of 6 per cent then it is clear that since this government was elected workers’ wages have gone back seriously in real terms.
Moreover, there is a question of what is the most appropriate cost-of-living measure to deploy.
Inflation and cost of living measures
When considering cost-of-living trajectories, we must first decide upon a measure of the cost-of-living.
There is a debate as to which cost-of-living measure is the most appropriate.
The most used measure published by the Australian Bureau of Statistics (ABS) is the quarterly ‘All Groups Consumer Price Index (CPI)’.
The ABS has also recently begun publishing a monthly version of this series to provide more immediate information to policy makers.
However, the CPI index was not designed to represent cost-of-living changes, regardless of the frequency of publication.
Reflecting the need to develop a measure of ‘the price change of goods and services and its effect on living expenses of selected household types’, the ABS began publishing a new series in June 2000 – the Analytical Living Cost Indexes – which became a quarterly publication from the September-quarter 2009.
These indexes were combined with a ‘Pensioner and Beneficiary Living Cost Index’ in 2012 into a new publication which they called the Selected Living Cost Indexes (SLCIs).
In its technical paper (published October 27, 2021) – Frequently asked questions (FAQs) about the measurement of housing in the Consumer Price Index (CPI) and Selected Living Cost Indexes (SLCIs) – the ABS note that:
The CPI and SLCIs are closely related. All these indexes measure changes in prices paid by the household sector (consumers) for a basket of goods and services provided by other sectors of the economy (e.g. Government, businesses). The weights in the ‘basket’ represent amounts of expenditure by households on goods and services bought from other sectors. Goods traded between households (like buying and selling existing houses) are excluded as both sides of the transaction occur within the household sector.
However, the ABS also note the important differences between the two cost-of-living measures:
- Their primary use. The CPI is primarily used as a measure of inflation while the SLCIs more closely reflect people’s cost of living.
- The SLCIs measure the change in prices of goods and services and how these changes affect the cost of living for selected household types (employees, age pensioners, other government transfer recipients, self-funded retirees and pensioner and beneficiary households) while the CPI is presented as a measure for all households.
- The way they measure changes in prices related to housing.
These differences arise because the CPI is designed as ‘a macroeconomic measure of household sector (consumer) price change – inflation’, which is used to ‘inform monetary policy’, whereas the SCLIs are designed to capture cost-of-living changes more accurately for individuals.
Most significantly in this regard is the fact that the CPI housing component ‘excludes existing dwellings, the cost of land, and mortgage interest charges’.
By contrast, the SCLIs include ‘mortgage interest charges’ because they reflect ‘the cost of financing the purchase of the owner-occupied property’.
In a recent methodology paper (published August 3, 2023) – Selected Living Cost Indexes, Australia methodology – the ABS provide further explanation:
A living cost index reflects changes over time in the purchasing power of the after-tax incomes of households. It measures the impact of changes in prices on the out-of-pocket expenses incurred by households to gain access to a fixed basket of consumer goods and services. The Australian Consumer Price Index (CPI), on the other hand, is designed to measure price inflation for the household sector as a whole and is not the conceptually ideal measure for assessing the changes in the purchasing power of the disposable incomes of households.
In other words, the SCLIs represent a more reliable indicator of ‘the extent to which the impact of price change varies across different groups of households in the Australian population’.
There are four separatee SLCIs compiled by the ABS:
- Employee households.
- Age pensioner households.
- Other government transfer recipient households.
- Self-funded retiree households
The most recent data – Selected Living Cost Indexes, Australia – was published by the ABS on August 2, 2023.
Between the June-quarter 2022 and the June-quarter 2023, the growth in the respective SLCIs has been:
- Employee households – 9.6 per cent.
- Age pensioner households – 6.7 per cent.
- Other government transfer recipient households – 7.3 per cent.
- Self-funded retiree households – 6.3 per cent.
The ‘All groups CPI’, by contrast, rose 6 per cent over the same period (as in above Table).
The following graph shows the differences between the CPI-based measure and the Employee SCLI measure which better reflects the changes in cost-of-living.
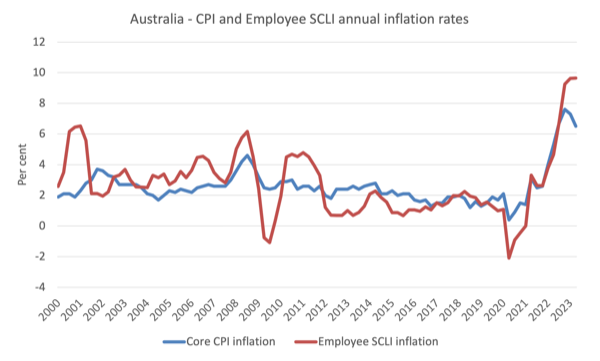
Thus, when specific household expenditure patterns are more carefully modelled, the SLCI data reveals that the cost-of-living squeeze on ‘employee households’ is more intense than is depicted by using the generic CPI data.
The ABS considers the ‘Employee households SCLI’ to be its preferred measure designed to capture cost-of-living changes more accurately for ‘households whose principal source of income is from wages and salaries’.
This puts the Treasurer’s comments in a wholly different light.
The relevant cost-of-living measure for workers has risen by 9.6 per cent over the last year while wages growth was just 3.6 per cent – a massive real wage cut of 6 per cent.
Real wage trends in Australia
The summary data in the table above confirm that the plight of wage earners continues in Australia.
The extent of the real wage decline over the last 12 months depends on the cost-of-living measure used (see previous graph for a comparison between the CPI measure and the Employee SCLI measure).
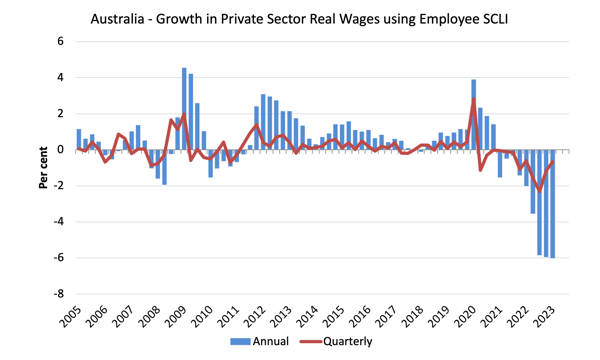
The following graph uses the Employee SCLI measure and shows the dramatic drop in real wages in the economy over the last 9 quarters.
Workers in the private and public sectors have both experienced sharp declines in the purchasing power of their wages.
This is at the same time as interest rates are have risen more quickly than any time in the distant past.
The fluctuation in mid-2020 is an outlier created by the temporary government decision to offer free child care for the June-quarter which was rescinded in the June-quarter of that year.
Overall, the record since 2013 has been appalling.
Throughout most of the period since 2015, real wages growth has been negative with the exception of some partial catchup in 2018 and 2019.
The systematic real wage cuts indicate that wages are not driving the inflationary episode.
Workers are only able to secure partial offset for the cost-of-living pressures caused by the supply-side, driven inflation.
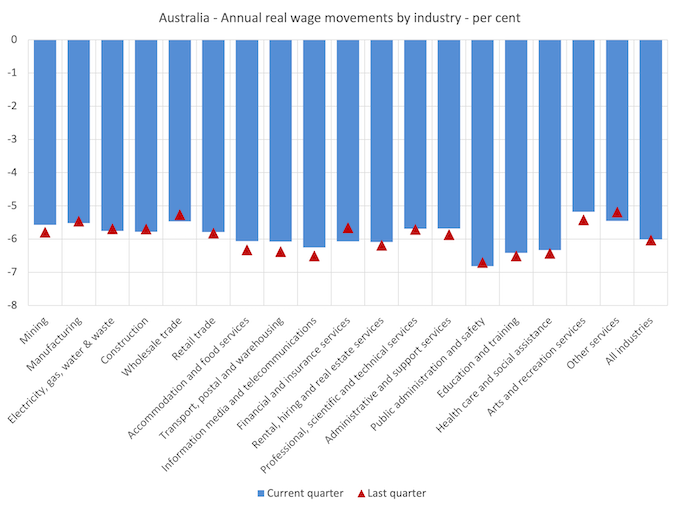
Industry Variability
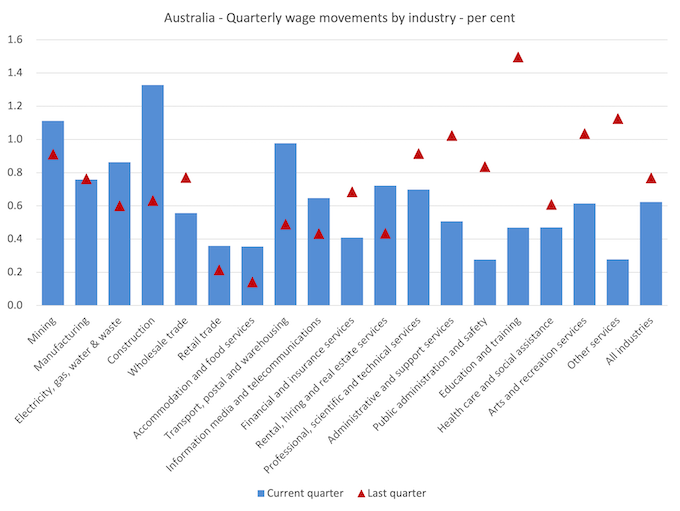
The aggregate data shown above hides quite a significant disparity in quarterly wage movements at the sectoral level, which are depicted in the next graph.
The blue bars are the current quarterly change, while the red triangles are the previous quarterly change.
All sectors recorded nominal wages growth but the extent was variable and many sectors experienced a sharp slowdown in the rate of growth (compare red diamonds with the blue bars).
Nine sectors enjoyed accelerating nominal wages growth.
However, it is very hard to see where the RBA sees so-called ‘sectoral wage pressures building up’.
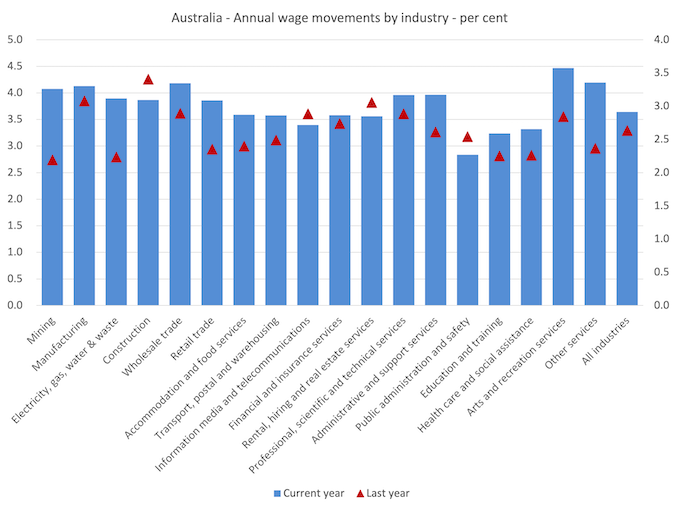
If we consider the situation over the last year, then we can see from the following graph that there is no evidence of any major wages breakout occurring.
There has been an uplift in annual nominal wages growth in most sectors but the rates of growth are still well below the inflation rate.
While nominal wages growth was positive, albeit modest, the next graph shows the movements in real wages across industries and you can see that real wages continued to fall in all sectors although the gap between the nominal wages growth and inflation is declining.
This on-going cut in the purchasing power of workers is almost unprecedented in our wages history and marks a massive redistribution of income towards profits.
Real wages continue to take sharp reductions in all sectors.
One can hardly say that wages push is causing the inflation spike.
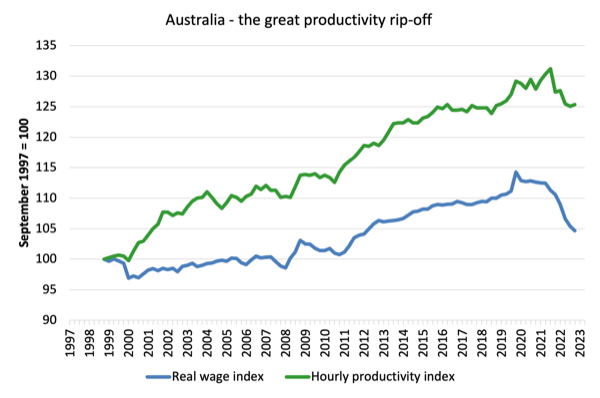
The great productivity rip-off continues
While the decline in real wages means that the rate of growth in nominal wages being outstripped by the inflation rate, another relationship that is important is the relationship between movements in real wages and productivity.
Historically (up until the 1980s), rising productivity growth was shared out to workers in the form of improvements in real living standards.
In effect, productivity growth provides the ‘space’ for nominal wages to growth without promoting cost-push inflationary pressures.
There is also an equity construct that is important – if real wages are keeping pace with productivity growth then the share of wages in national income remains constant.
Further, higher rates of spending driven by the real wages growth can underpin new activity and jobs, which absorbs the workers lost to the productivity growth elsewhere in the economy.
Taking a longer view, the following graph shows the total hourly rates of pay in the private sector in real terms (deflated with the Employee SCLI) (blue line) from the June-quarter 1999 (when the SCLI series began) and the real GDP per hour worked (from the national accounts) (green line) to the June-quarter 2023.
It doesn’t make much difference which deflator is used to adjust the nominal hourly WPI series. Nor does it matter much if we used the national accounts measure of wages.
But, over the time shown, the real hourly wage index has grown by only 4.7 per cent (and falling sharply), while the hourly productivity index has grown by 25.4 per cent.
So not only has real wages growth turned negative over the 18 months or so, but the gap between real wages growth and productivity growth continues to widen.
If I started the index in the early 1980s, when the gap between the two really started to open up, the gap would be much greater. Data discontinuities however prevent a concise graph of this type being provided at this stage.
For more analysis of why the gap represents a shift in national income shares and why it matters, please read the blog post – Australia – stagnant wages growth continues (August 17, 2016).
Where does the real income that the workers lose by being unable to gain real wages growth in line with productivity growth go?
Answer: Mostly to profits.
The next graph shows the gap between the real wage index and the labour productivity index in points.
It provides an estimate of the cumulative redistribution of income to profits as a result of real wage suppression.
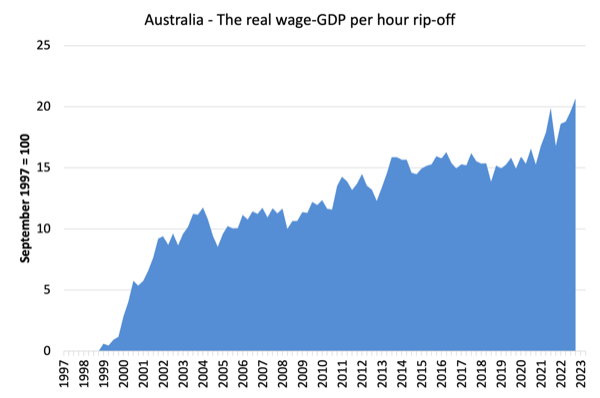
Now, if you think the analysis is skewed because I used GDP per hour worked (a very clean measure from the national accounts), which is not exactly the same measure as labour productivity, then consider the next graph.
It shows the movements in the wage share in GDP (at factor cost) and profit share since the June-quarter 1960 to the December-quarter 2022 (latest data).
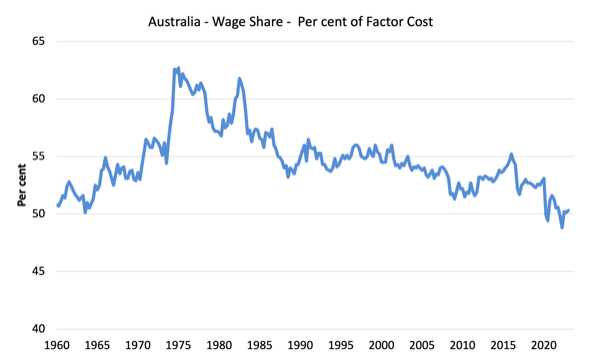
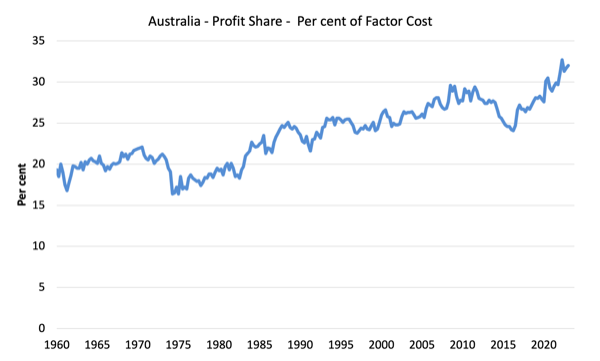
While the series move around from quarter to quarter, the trend is obvious.
The only way that the wage share can fall like this, systematically, over time, is if there has been a redistribution of national income away from labour.
I considered these questions in a more detailed way in these blog posts:
1. Puzzle: Has real wages growth outstripped productivity growth or not? – Part 1 (November 20, 2019).
2. 1. Puzzle: Has real wages growth outstripped productivity growth or not? – Part 2 (November 21, 2019).
And the only way that can occur is if the growth in real wages is lower than the growth in labour productivity.
That has clearly been the case since the late 1980s. In the June-quarter 1991, the wage share was 56.6 per cent and the profit share was 22.2 per cent.
In the December-quarter 2022, the wage share stood at 50 per cent of total income.
There has been a massive redistribution of income towards profits has occurred over the last 40 years.
The relationship between real wages and productivity growth also has bearing on the balance sheets of households.
One of the salient features of the neo-liberal era has been the on-going redistribution of national income to profits away from wages. This feature is present in many nations.
The suppression of real wages growth has been a deliberate strategy of business firms, exploiting the entrenched unemployment and rising underemployment over the last two or three decades.
The aspirations of capital have been aided and abetted by a sequence of ‘pro-business’ governments who have introduced harsh industrial relations legislation to reduce the trade unions’ ability to achieve wage gains for their members. The casualisation of the labour market has also contributed to the suppression.
The so-called ‘free trade’ agreements have also contributed to this trend.
I consider the implications of that dynamic in this blog post – The origins of the economic crisis (February 16, 2009).
In summary, the substantial redistribution of national income towards capital over the last 30 years has undermined the capacity of households to maintain consumption growth without recourse to debt.
One of the reasons that household debt levels are now at record levels is that real wages have lagged behind productivity growth and households have resorted to increased credit to maintain their consumption levels, a trend exacerbated by the financial deregulation and lax oversight of the financial sector.
Real world impact
Yesterday (August 15, 2023), the Federal Fair Work Commission, which is the judicial body overseeing wage agreements issued a – Decision – regarding a dispute between the United Firefighters’ Union of Australia and Fire Rescue Victoria (the latter being the state government’s fire service authority).
The hearing was in relation to the UFUA seeking “increases to allowances within the 2020 Agreement” to compensate firefighters for lost purchasing power.
The main evidence allowed in the dispute was:
An economic analysis report prepared by Professor William Mitchell, Director of the Centre of Full Employment and Equity, University of Newcastle was received as evidence in support of the UFU’s claims.
The Commission also considered oral testimony from FRV who claimed they could not afford to pay the increases sought.
There is a detailed analysis of my research work in this case provided in the Decision.
The Commission ruled in favour of the Union and said that:
1. “Professor Mitchell’s report persuasively identifies that the purchasing power of the allowances in the agreement has diminished over time and that, at least for those allowances couched as a reimbursement of expenses incurred, an increase of at least 9.5% is warranted.”
2. “The evidence put forward by the UFU and particularly in the form of the report from Professor Mitchell cogently establishes that increases are warranted and especially because the relative purchasing power of the allowances has diminished since the last formal Commission approved or ordered movements in the allowances.”
I often do research work and modelling for trade unions to help them achieve better conditions for their members.
This particular modelling effort was very interesting and quite complicated given the number of allowances and different bases for computing the allowances.
I was really pleased that my work helped the union improve the workers’ wage outcomes.
Conclusion
In the June-quarter 2023, Australia’s nominal wage growth remained well below that necessary to restore the purchasing power losses arising from cost-of-living increases.
The data shows that the significant cuts to workers’ purchasing power continue, and, in my view, constitute a national emergency.
Further with the gap between productivity growth and the declining real wages increasing, the massive redistribution of national income away from wages to profits continues.
Further, the conduct of the RBA in this environment is contributing to the damage that workers are enduring.
They have maintained the line that there is a threat of a wages breakout and so interest rates have to keep rising to create the necessary unemployment increase to prevent that from happening.
They have paused the interest rate hikes for now because they realise the monetary policy lags are yet to chime in.
That is enough for today!
(c) Copyright 2023 William Mitchell. All Rights Reserved.
As long as people are stupid enough to volunteer as slaves / victims or evil enough to victimise and enslave others the current system will remain in place.
I’m not a fan of the Job Guarantee but at least it would give people an option to contribute to society rather than merely top up the bank accounts of the leisure and donor classes.
But for the Job Guarantee to work the relations between corporations and governments need to be destroyed. Otherwise, they will end up manipulating the Job Guarantee much the same way as they have the financial and legal system…. and everything else controllable from that foundation.
Alan, when the choice is between a shitty job and homelessness and hunger, opting for a shitty job is not stupidity – it’s survival. Nobody is voluntarily in that position.
We need to be destroying inegalitarian social structures not endorsing their existence / construction.
Play stupid games win stupid prizes.
I wasn’t disagreeing with the rest of what you said, just your first statement.
Trouble is, how can you both keep democracy and eliminate stupidity in politics, when there is a sizeable population that, by definition, is below average intelligence?
You solve that and you would be up for a Nobel Prize.
I have never come across an actual persuasive argument against the job guarantee. The job guarantee, as best described by Bill Mitchell, has proven, in essence, to be a theorem. The problem is never the job guarantee, it is always ones understanding of the job guarantee.
Whilst attempting to disprove a theorem is commendable, in this context, it always seems disparaging – in this case we absolutely must be results oriented. A theorem can be applied to serve its purpose, but that doesn’t mean it solves what lies beyond its means. I would welcome a job guarantee in today’s environment because it would instantly change the relationship dynamics BUT MORE IMPORTANTLY it would instantly wake people up to the reality of what’s possible beyond what they otherwise believed to be possible – one should never underestimate a people’s ability to willingly serve for free in the pursuit of collective power.
I always ponder whether it would be worth investing time in nudging traders, who since the pandemic have began to swing towards the MMT perspective, that they should start with understanding the job guarantee; it is the ultimate form of effective altruism after all!
“Trouble is, how can you both keep democracy and eliminate stupidity in politics, when there is a sizeable population that, by definition, is below average intelligence?.
You solve that and you would be up for a Nobel Prize.”
Someone give Bill his nobel prize…not that fake one, the real one! Better yet, let’s rename it the ‘The Mitchell Motion Peace Prize’, now that would be dynamite!
Congratulations on the union case Bill. Fantastic outcome.