Go back to the headlines in 2010 - – “Countries with debt over 90 percent…
Australia – stagnant wages growth continues
The Australian Bureau of Statistics published the latest – Wage Price Index, Australia – for the June-quarter 2016 today. Annual private sector wages growth remained steady at 2.0 per cent (0.5 per cent for the quarter), which is the third consecutive month that the annual growth in wages has recorded its lowest level since the data series began in the December-quarter 1997. In the 2015-16 fiscal statement (aka ‘The Budget’), the Government assumed wages growth for 2015-16 would be 2.5 per cent rising to 2.75 over 2016-17. On current trends, that is highly unlikely to occur, which means the forward estimates for taxation revenue are already falling short and the fiscal deficit will be larger than assumed. Depending on how we measure inflation, the annual wages growth translates into only a modest real wage rise since January 2016 for Australian workers. More importantly, real wages are growing well below trend productivity growth and Real Unit Labour Costs (RULC) continue to fall. This means that the gap between real wages growth and productivity growth continues to widen as the wage share in national income falls (and the profit share rises). The flat wages trend is intensifying the pre-crisis dynamics, which saw private sector credit rather than real wages drive growth in consumption spending. The lessons have not been learned.
The low wages growth raises several questions that are not unique to the Australian setting.
1. With household consumption a major part of aggregate spending, low wages growth threatens a major source of growth. Private investment will also not pick up the pace if consumption spending is weak.
2. The Australian government is mired in a trap of its own making – it seeks to withdraw a massive $A6 billion in public spending (a significant cut) because in its blinkered eyes the fiscal deficit is too large.
As cuts spending, growth falters and taxation revenue falls – the Federal government is then just chasing its own tail at the expense of the unemployed who have to wear the costs of this folly.
Suppressing growth also leads to this flat wages growth profile, which further undermines the tax base of the Government.
Round and round it goes – totally unnecessary and very damaging.
Unfortunately, real wages growth in Australia these days does not follow productivity growth in any proportional way as it did in the period before this neo-liberal domination began.
The conservatives like to say that productivity growth is passed on to workers but they know that for the last three decades or so that has not been the case. Moreover, the labour market policies of successive governments on both sides of politics have created a situation where it is increasingly difficult for workers to gain real wages growth.
Nominal wage and price inflation and real wage trends
The wage series used in this blog is the quarterly ABS Wage Price Index published by the ABS. The Non-farm labour productivity per hour series is derived from the quarterly National Accounts.
A compact dataset can be downloaded from the RBA Table H2 Labour Costs and Productivity. I extrapolated the average growth over the last five years to get the June-quarter productivity result, given the national accounts data is not released until early September.
Please read my blog – Inflation benign in Australia with plenty of scope for fiscal expansion – for more discussion on the various measures of inflation that the RBA uses – CPI, weighted median and the trimmed mean The latter two aim to strip volatility out of the raw CPI series and give a better measure of underlying inflation.
The deflator used in this blog is the RBA’s ‘core’ or ‘underlying’ inflation measure. The RBA says (Source):
Because of the noise in short-horizon movements in the CPI, policymakers and other analysts often look to measures of underlying or core inflation, which should be subject to less noise than headline inflation …
The most widely used underlying measure is the inflation rate for the CPI basket excluding a few items which historically have had particularly volatile prices. The items typically excluded are various types of food and/or energy, and in some countries the resulting measure is often referred to as ‘core’ inflation. These ‘exclusion’ measures of underlying inflation remove the direct effect of movements in the prices of those items on the rationale that they tend to be volatile and often not reflective of the underlying or persistent inflation pressures in the economy. They are obviously easily calculated and explained to the public.
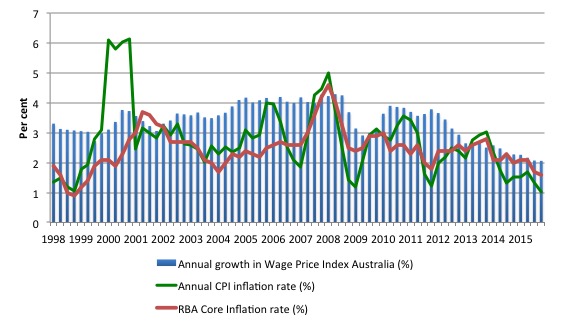
The first graph shows the overall annual growth in the Wage Price Index since the September-quarter 1998 (this series was first published in the September-quarter 1997).
I also superimposed the annual inflation rate (Consumer price index) – the green line and the annual core inflation rate (red line). The bars above the green or red lines indicate real wages growth and below the opposite.
The big funny-looking jump in 2001 in the CPI-inflation rate series reflected the introduction of the Goods and Services Tax which created a once-off adjustment in the level of the CPI.
Once we take out the volatile factors in the CPI (that is, use the red line), we see that the real wage has fallen in three out of the last six quarters.
It has only grown in the last two quarters because the inflation rate is so low – a reflection of the weakness of the economy
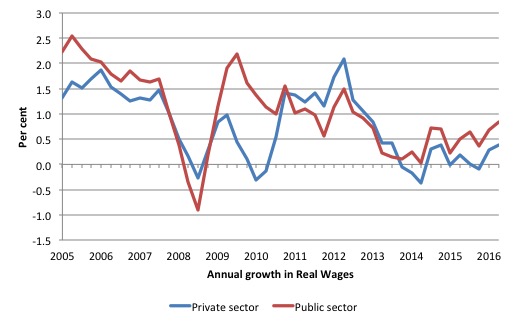
The following graph shows the annual growth in real wages from the September-quarter 1998 to the June-quarter 2016 for the public and private sectors.
After a few quarters of hard real wage cutting in 2013-14, the private sector returned to positive real wages growth but at very subdued rates.
In the last three quarters real wages growth has been fairly modest.
The rise in real wages in 2012 into 2013 was the result of the strong economic growth supported by the fiscal stimulus. The declining profile after that is associated with the end of the mining investment boom exacerbated by the obsessive fiscal austerity that was introduced (too early).
Workers not sharing in productivity growth
Even though there has been some modest real wages growth in the last two quarters, it is clear that workers have not been sharing in the productivity growth generated in the Australian economy over the same period.
Productivity growth provides the ‘non-inflationary’ space for real wages to grow and for material standards of living to rise.
But, one of the salient features of the neo-liberal era has been the on-going redistribution of national income to profits away from wages. This feature is present in many nations.
This has occurred because real wages growth has lagged behind productivity growth and the extra real income produced as been expropriated by capital in the form of profits.
The suppression of real wages growth has been a deliberate strategy of business firms, exploiting the entrenched unemployment and rising underemployment over the last two or three decades.
The aspirations of capital have been aided and abetted by a sequence of ‘pro-business’ governments who have introduced harsh industrial relations legislation to reduce the trade unions’ ability to achieve wage gains for their members. The casualisation of the labour market has also contributed to the suppression.
That redistribution of national income to profits continues in Australia.
I consider the implications of that dynamic in this blog – The origins of the economic crisis. As you will see, I argue that without fundamental change in the way governments approach wage determination, the world economies will remain prone to crises.
In summary, the substantial redistribution of national income towards capital over the last 30 years has undermined the capacity of households to maintain consumption growth without recourse to debt.
One of the major reasons that household debt levels are now at dangerous, record levels is that real wages have lagged behind productivity growth.
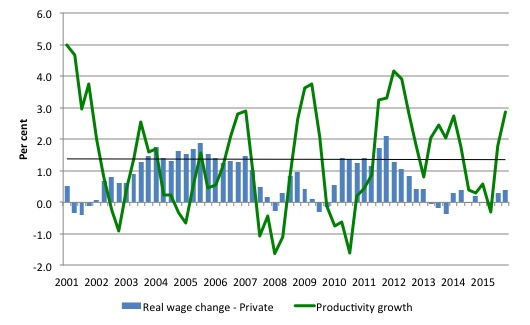
The next graph shows the annual hourly real wage change for the private sector (blue bars) and the annual hourly productivity growth (green line) since the March-quarter 2001. The black line is the trend productivity growth over the same time period.
Productivity growth has strengthened over the last two quarters and over the last 5 years has been well above the growth in real wages.
Historically (for periods which data is available), rising productivity growth was shared out to workers in the form of improvements in real living standards. Higher rates of spending driven by the real wages growth then spawned new activity and jobs, which absorbed the workers lost to the productivity growth elsewhere in the economy.
The neo-liberal period marked a shift in that relationship as we discuss below.
Clearly, since the September-quarter 2011, the payoff to workers from the positive productivity growth has been absent with real wages growth lagging productivity growth.
Real wages and productivity growth – a massive redistribution to profits
To understand the significance of the gap between real wages growth and labour productivity growth the following points should be noted:
- Employment is measured in persons (averaged over the period).
- Labour productivity is the units of output per person employment per period (in this case per hour).
- The wage and price level are in nominal units; the real wage is the wage level divided by the price level and tells us the real purchasing power of that nominal wage level.
- The total economy-wide wage bill is employment times the wage level and is the total labour costs in production for each period.
- Real GDP is thus employment times labour productivity and represents a flow of actual output per period; Nominal GDP is Real GDP at market value – that is, multiplied by the price level. So real GDP can grow while nominal GDP can fall if the price level is deflating and productivity growth and/or employment growth is positive.
- The wage share in national income (GDP) is the share of total wages in nominal GDP and is thus a guide to the distribution of national income between wages and profits.
- Unit labour costs are in nominal terms and are calculated as total labour costs divided by nominal GDP. So they tell you what each unit of output is costing in labour outlays.
- Real unit labour costs are calculated by dividing Unit labour costs by the price level to give a real measure of what each unit of output is costing. RULC is also the ratio of the real wage to labour productivity and through algebra I would be able to show you that it is equivalent to the Wage share measure.
From the last point, if real wages growth is above productivity growth then RULC are rising, which is the same thing as saying that national income is being redistributed to wages (workers).
However, if real wages growth is below productivity growth then RULC are falling, which is the same thing as saying that national income is being redistributed away from wages (workers) to profits (capital).
It can get a little more complicated if the share that government claims changes but that is normally stable, which means the dynamics of national income distribution are between wages and profits.
The following graph shows the indexed growth in hourly real wages and labour productivity per hour since the September-quarter 1997 (the start of the Wage Price Index series).
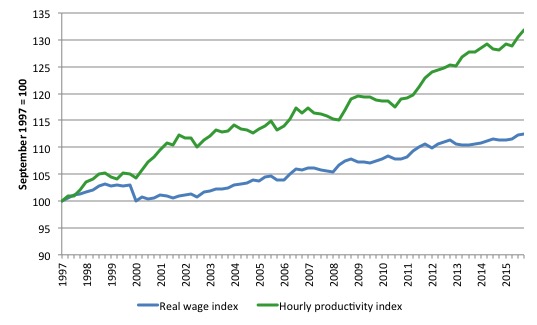
If I started the index in the early 1980s, when the gap between the two really started to open up, the productivity index would stand at around 180 and the real wage index at around 115.
Starting the index in the September-quarter 1997 produces a smaller gap, which just goes to show that one can manipulate data to achieve a range of ends (often quite contrasting) by altering the sample size.
What is clear is that since the September-quarter 1997, real wages have grown by only 12.4 per cent (so just over 0.6 per cent on average per year), whereas hourly labour productivity has grown by 31.9 per cent (or 1.7 per cent on average per year).
This is a massive redistribution of national income to profits and away from wage-earners and the gap is widening each quarter.
Where does the real income that the workers lose by being unable to gain real wages growth in line with productivity growth go? Answer: Mostly to profits. One might then claim that investment will be stimulated.
At the onset of the GFC (December-quarter 2007), the Investment ratio (percentage of private investment in productive capital to GDP) was 23.8 per cent.
It peaked at 24.3 per cent in the June-quarter 2013. But in recent quarters as the gap between real wages growth and productivity growth widens, the Investment ratio has fallen and in the March-quarter 2016 it stood at 19.3 per cent and is falling.
The downward shift in the non-mining investment ratio is more stark than that.
Some of the redistributed national income has gone into paying the massive and obscene executive salaries that we occasionally get wind of.
Some will be retained by firms and invested in financial markets fuelling the speculative bubbles around the world.
For workers, the problem is that they rely on real wages growth to fund consumption growth and without it they borrow or the economy goes into recession. The former is what happened around the world in the lead up to the crisis (and caused the crisis).
The latter is more or less what is happening now.
One of the essential changes that needs to happen to ensure that another bout of financial instability doesn’t hit soon is that real wages have to grow in proportion with productivity growth – exactly the reverse of what is happening now.
Real wages growth and employment
The recent labour force data has revealed on-going weak employment growth.
The standard mainstream argument that unemployment is a result of excessive real wages and moderating real wages should drive stronger employment growth.
The problem with this ‘theory’, when applied to the recent Australian experience, is that wages growth has been moderate for several years now while employment growth has been zig-zagging across the zero line over the same period – but generally very weak itself.
The coincidence of both the flat wages growth and the poor employment growth for the last several quarters is supportive of the Modern Monetary Theory (MMT) position – that both are responding to the weak overall spending in the economy.
Firms will not employ new labour, no matter how cheap it becomes, if they cannot sell the extra goods and services that would be produced.
The claim that real wage cuts or growth retardation is necessary to stimulate employment is never borne out by the evidence.
As Keynes and many others have shown – wages have two aspects:
First, they add to unit costs, although by how much is moot, given that there is strong evidence that higher wages motivate higher productivity, which offsets the impact of the wage rises on unit costs.
Second, they add to income and consumption expenditure is directly related to the income that workers receive.
So it is not obvious that higher real wages undermine total spending in the economy. Employment growth is a direct function of spending and cutting real wages will only increase employment if you can argue (and show) that it increases spending and reduces the desire to save.
There is no evidence to suggest that would be the case.
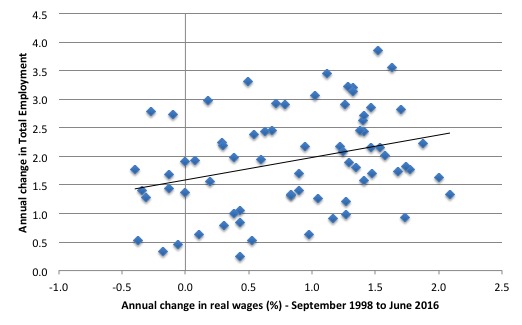
The following graph shows the annual growth in real wages (horizontal axis) and the quarterly change in total employment. The period is from the September-quarter 1998 to the June-quarter 2016. The solid line is a simple linear regression.
Conclusion: When real wages grow faster so does employment although from a two-dimensional graph causality is impossible to determine.
However, there is strong evidence that both employment growth and real wages growth respond positively to total spending growth and increasing economic activity. That evidence supports the positive relationship between real wages growth and employment growth.
International comparison
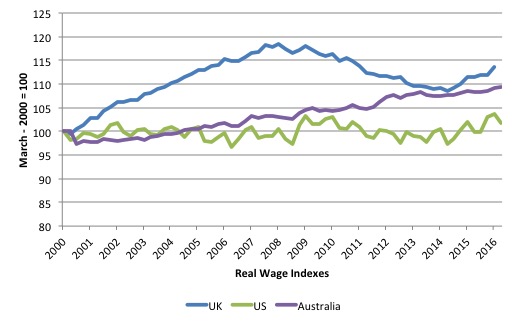
The following graph shows real wage movements since the March-quarter 2000 in the UK, US and Australia. The measures of wages growth are slightly different due to the different ways that the US Bureau of Statistics and the UK Office of National Assessments classifies and accumulates the data, compared to the ABS in Australia.
But the definitional differences are not so great that the trends in each nation are distorted to much.
It is clear that American workers have experienced very little movement in real wages over the period.
In fact, real wages in the US are only 1.3 per cent higher than they were in the March-quarter 1979. That is a scandalous indictment of the policies that have been pursued in that nation.
The GFC clearly has undermined real wages growth in the UK and flattened real wages growth in Australia.
Conclusion
For the last two-quarters, nominal wages growth in Australia has been at the lowest levels since the data series began (September-quarter 1997).
Depending on how we measure inflation, real wages growth is at best modest at present but has zig-zagged across the zero growth line several times in the last year.
The slow wages growth is a cause and reflection of the slow growth in overall economic activity and employment. Workers are adopting a much more cautious approach to spending and firms will not lift the investment rate while sales are flagging.
The on-going subdued economic activity will also undermine the Government’s fiscal strategy, which can be summarised as squeezing net public spending out of the economy in the hope that in three years they will achieve a fiscal surplus.
That folly will be exposed. Economic growth will not be strong enough to match their assumptions and that means the growth in tax receipts will be less than assumed.
It would be better for the Government to stimulate the economy more now with larger fiscal deficits and then see the fiscal balance drop on the back of income growth.
Higher (and more reasonable) wages growth would both benefit from and provide support to such a fiscal strategy.
At the moment, we are in a race-to-the-bottom, which is nowhere any reasonable policy strategy should aim for.
That is enough for today!
(c) Copyright 2015 Bill Mitchell. All Rights Reserved.
I guess what worries me is that there is less and less room for wages and employment to grow even if a government adopted MMT [itself a dismal prospect]. I believe we are forever stuck in a low growth, not to say diminishing economy as the principle that we cannot grow forever in a finite world impacts us. The finiteness of our world is becoming ever more evident. MMT can of course smooth the path down and in all probability will be adopted once the inevitable crash is visible to all of us. But it will take a super event to clear out the mainstream cobwebs.
John Doyle – it depends on your definition of “growth”!
See http://www.thenation.com/article/196721/workers-think-tank#
“In a series of papers written over the past few years, Levy Institute scholar Pavlina Tcherneva has outlined an American version of the job guarantee. The program would give federal grants to local nonprofits working on environmental cleanups and sustainable development projects like urban gardens, farmers’ markets and locally run grocery stores. Tcherneva’s goals are similar to those of UMass Amherst professor and Political Economy Research Institute economist Bob Pollin, who has developed a detailed model for a program that would simultaneously tackle the jobs crisis and kick-start the green economy.”
______________________________________
Modern Monetary Theory in Canada
http://mmtincanada.jimdo.com/
Bill,
In the UK we are constantly being told are productivity is abysmal compared to other nations as our employment numbers increase – are both statistics being gerrymandered?
Only struggle for fair wages is seen in strike action currently railways in the UK, refineries in France etc.
Dear Bill,
first of all, thanks for your great blogè I have learned a lot from reading it the last months.
I have a question which might be stupid or inappropriate but nevertheless makes me think: In your text you say that the stagnating household incomes are a cause for rising household debt. I can see the connection clearly, and overall I think you are right. However, nobody forced people to “unsave”. I live in Germany and here real wages have also been stagnating for decades but german private households would not pile up so much debt (made other countries do that for them).
Germans are, wrongly I think, super-moralistic about their “frugal ways” – sth. I do not agree with, and do not want to promoet here. I ask this question, because, it looks like a weak spot in your argument from my humble laymans opinion? Maybe apart from the least earning people nobody HAS “to maintain consumption growth”, or are there active Promotion schemes to make people take up new debts?
I would be happy about a short reply and clarification.
Thanks and Keep up the great work!!!
Sebastian
@John Doyle
“I guess what worries me is that there is less and less room for wages and employment to grow even if a government adopted MMT [itself a dismal prospect].”
As Bill has pointed out in the past. Government doesn’t adopt MMT, it already has it!
It’s just a case of them understanding what they already have.
Its too complicated for me but I enjoy the learning.
I just cant see how we can have stagnant wages in the private sectors and increasing private household debt at the same time. The magic of compounding seems to be working backwards.
Must this end in a bust and reset?
Cheers Punchy