In addition to the basis academic research that occupies my working time and is funded…
Australia’s lowest paid workers get some real wage relief from the latest adjustment to the minimum wage
On June 3, 2025 Australia’s minimum wage setting authority – the Fair Work Commission (FWC) issued their decision in the – Annual Wage Review 2025 – which provides for wage increases for the lowest-paid workers – around 0.7 per cent of employees (around 88 thousand) in Australia. In turn, around 20.7 per cent of all employees, who are on the lowest tier of their pay award (grade) receive a flow-on effect. The FWC provided a 3.5 per cent nominal wage increase for the lowest paid workers in its 2025 National Wage Case decision. Against the current CPI growth, that provides for some modest real wage increase for this cohort. However, note the discussion above as to the best purchasing power measure to use. Against the more applicable Employee Selected Cost of Living Index (SCLI), the decision provides for barely any real wages growth and fails to redress the massive real wage cuts in recent years. The media has failed to pick up on that reality, and has instead given oxygen to the employers’ responses which called the decision irresponsible while at the same time pocketing record profits as a result of their profit gouging. But at least the lowest-paid workers gained some relief as a result of the decision as the FWC largely ignored the whining of the employers.
In this blog post – Australia’s minimum wage rises – but not sufficient to end working poverty (June 6, 2017) – I outlined:
1. Progressive minimum wage setting principles.
2. The way staggered wage decisions (annually) lead to falling real wages in between the wage adjustment points.
I won’t repeat that analysis here. But it is essential background to understanding why the decisions taken by Fair Work Australia have been inadequate for a long time.
Who is affected?
Only a small proportion of workers are deemed to be NMW-reliant – that is, reliant exclusively on the national minimum wage.
The FWC notes in its Decision (linked above) that:
… the Australian Government’s estimate (based on 2023 EEH data) of 32,100 (representing about 0.25 per cent of the entire employee workforce) and was ‘likely to be very small’ …
The Expert Panel in the AWR 2024 decision observed that ‘the NMW has very limited practical effect in the Australian industrial relations landscape notwithstanding its role in the statutory annual wage review scheme’.
However, a much larger proportion of the available workforce is deemed to be ‘modern award reliant’ employees, which means that they are being paid under Australia’s award wage system, which is the lowest allowable wage for the relevant sector.
These awards are adjusted upwards when the NMW is altered.
The FWC noted that in this case:
The 2025 Profile shows that 20.7 per cent of all employees were modern award-reliant, up slightly from 20.5 per cent in the 2023 Profile. The number of modern award-reliant employees is about 2.61 million.
What this means is that a small number of workers actually get the National Minimum Wage (NMW) but a much larger number (the 2.61 million or 20.7 per cent of total workforce) are paid at minimum levels on so-called ‘modern award’ arrangements, which apply in each sector.
There are 121 modern awards in the industrial structure.
The practice is that when the NMW is changed, that decision then flows directly into these minimum levels for the modern awards.
The characteristics of these workers are outlined in the FWC Decision:
1. “It is predominantly made up of employees working part-time hours (less than 35 hours per week)”.
2. “A majority of modern award-reliant employees is now casual (52.8 per cent)” and rising.
3. “predominantly female (58.6 per cent)”.
4. “The modern award-reliant workforce is, on average, younger than the workforce as a whole (33.9 years compared to 39.9)”.
5. “Modern award-reliant employees are more likely to be employed in a small business (33.6 per cent) than the workforce as a whole (25.0 per cent).”.
6. “Over one third (35.6 per cent) of modern award-reliant employees are low-paid … and 56.9 per cent of all low-paid employees are modern award-reliant.”
These characteristics document the secondary labour market in the Australian economy – low-paid, casualised jobs with high degrees of occupational segregation biased against females and the young.
Given the low pay and low hours worked relative to the rest of the economy, the FWC estimated that the NMW adjustment would not have a significant impact on overall wages growth in the economy:
The relatively small contribution to the national ‘wage bill’ made by the wages of modern award-reliant employees means that the effect of Review decisions on annual Wage Price Index (WPI) outcomes is limited. In the AWR 2024 decision, the Expert Panel estimated that the 3.75 per cent increase which it awarded would contribute approximately 0.4 of a percentage point to the WPI for the 12 months to March 2025.
Which means the decision directly improves the outcomes for these low-paid workers but the broader economic effective of the Annual Wage Review decisions is limited and “The proportion of the national ‘wage bill’ for modern award-reliant employees is considerably smaller, at 10.5 per cent, than their share of the total employee workforce.”
Which then should discourage anyone from believing the employer organisations that have conniptions when the FWC provides some wage relief for the very low paid workers in Australia.
Their claims reflect their own greed and willingness to exploit the most vulnerable workers rather than being based on any economic analysis.
The FWC also made it clear that:
The principal consideration which has guided our decision is the fact that, since July 2021, employees who are reliant on modern award minimum wages or the National Minimum Wage have suffered a reduction in the real value of their wage rates. In the case of modern awards, the benchmark C10 award rate of pay has declined by 4.5 percentage points relative to inflation as measured by the Consumer Price Index.
Where the parties stand
The FWC received bids (submissions) from various parties in the process of making its decision – the ACTU (peak union body), government (federal and state), various employer groups.
The Australian Chamber Commerce and Industry (ACCI), which represents around 400,000 employers demanded the FWC limit the increase to 2.5 per cent.
This was representative of the claims made by the employer groups the lowest claim being for only a 2 per cent rise.
The FWC responded:
… it is difficult to see therefore that a Review outcome within the range could make any difference of significance to inflation (by reason of an effect on wages growth).
For similar reasons, detrimental effects on national economic and business competitiveness are unlikely. Nor, in the context of a labour market which remains strong overall, is it likely that there would be any aggregate disemployment effects. The last three annual wage reviews have seen nominal increases in the NMW and modern award minimum wage rates that have, because of the rate of inflation, been significantly higher than for the preceding decade, but there has not been any discernible adverse consequence for employment growth or the rate of unemployment. Some positive national economic effect is likely, in that modern award minimum wage rate increases will support household consumption and consumer sentiment.
ACCI claimed that:
To be sustainable, any increase in wages must be linked to productivity. ACCI agrees that workers should share in the benefits of productivity gains. Yet, labour productivity has been contracting, down 1.2 per cent in 2024 calendar year and this is expected to persist in 2025. Failure to align wages growth with genuine productivity improvements risks will only add to inflationary pressure, exacerbating economic challenges.
Other employer groups made the same claim.
It is interesting that even though productivity growth has been slow in recent years, when it has been growing on trend, the employer groups have resisted any notion that nominal wages should grow in proportion.
As I have demonstrated in this blog post (and the previous updates) – Australian wages growth – real wages stable – no breakout evident (May 14, 2025) – since 1999, the real hourly wage index has grown by only 5.5 per cent, while the hourly productivity index has grown by 24.1 per cent.
Had nominal wages grown with productivity growth over the last several decades, on average, weekly earnings in Australia would be $A284.60 higher or $A14,230 higher on annual basis.
So perhaps the employer groups might like to get their cheque books out and pay up!
But the other important point, is made by the FWC Decision:
However, as with employment growth, it is necessary to differentiate between productivity growth in the market and non-market sectors. It is also necessary to separate out the mining sector, for which measured productivity is not always an accurate representation of productive efficiency because resources that are easier to mine are depleted first, with higher commodity prices leading mining companies to pursue harder-to-mine resources … Annualised productivity growth (gross value added (GVA) per hour worked) in the non-mining market sector from the December quarter 2019 to the December quarter 2024 was a reasonably healthy 1.5 per cent. This is reduced to 0.5 per cent in the market sector once mining is included, and across the whole economy, including the non-market sector, GDP per hour worked was -0.1 per cent annualised, or -0.7 per cent over the whole period …
Therefore, leaving aside the mining sector, it appears that the national economy’s ‘productivity problem’ is largely a consequence of the non-market sector’s disproportionate growth in its share of GVA and hours worked. This flows from governmental policy decisions to improve the availability and quality of services in areas such as healthcare and social services. The measurement of productivity in the non-market sector is problematic since it is not possible to measure output by reference to the market prices paid for goods and services, as in the market sector. The Australian Bureau of Statistics (ABS) generally uses production costs as a proxy for output prices, meaning that when rapid employment growth occurs in the non-market sector, particularly in lower-paid employment, this has the consequence of increasing measured output by less than the increase in hours worked, thus lowering measured productivity.
Which all means that the NMW decision will not compromise the available non-inflationary nominal wage growth space created by productivity growth.
The Australian Council of Trade Unions wanted a 4.5 per cent rise, which was rejected but would have helped workers at the bottom of the distribution recoup some of the massive real wage losses endured over the last several years.
An important aspect of this decision is that the federal government was strong in supporting a wage adjustment at the bottom which would provide for real wages growth.
This is one significant difference between the Labor government and the previous conservative government, even though on macroeconomic policy, the differences are minor.
The Federal Minimum Wage (FMW) Decision
In its 2025 decision – Fair Work Australia wrote:
The decision we have made is to increase the National Minimum Wage and all modern award minimum wage rates by 3.5 per cent, effective from 1 July 2025 …
The principal consideration which has guided our decision is the fact that, since July 2021, employees who are reliant on modern award minimum wages or the National Minimum Wage have suffered a reduction in the real value of their wage rates. In the case of modern awards, the benchmark C10 award rate of pay has declined by 4.5 percentage points relative to inflation as measured by the Consumer Price Index.
Staggered adjustments in the real world
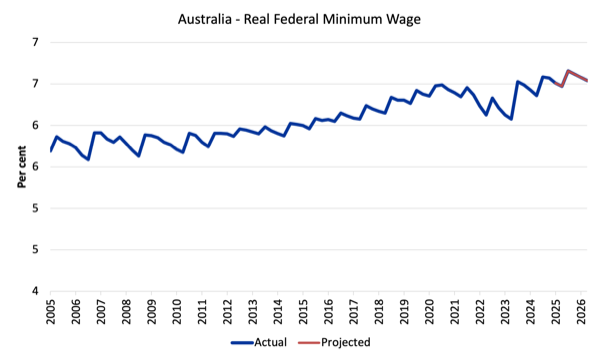
The following graph shows the evolution of the real purchasing power of the NMW since 2005.
We have extrapolated the current decision, which applies from July 1, 2024, over the next 12 months (until the next decision) using RBA inflation forecasts to deflate the nominal NMW.
The familiar saw-tooth pattern is clear.
I explained this pattern in detail in this blog post – Australia’s minimum wage rises – but not sufficient to end working poverty (June 6, 2017).
Each of the peaks represents a formal wage decision by the Fair Work Commission so that at the time of the nominal adjustment (July 1 each year) the real NMW usually rises somewhat (perhaps not back to where it was 12 months earlier).
Each period that the curve heads downwards the real value of the FMW is being eroded.
That is, in between the decision periods, the inflation is on-going and erodes the nominal NMW.
That is one problem with these discrete adjustments and I would much rather the FWC built into the system, a feature that is common on most multi-period bargains, escalation.
That is, they could easily index wages to the quarterly inflation rate which would better protect real wages.
You can gauge the annual growth in the real wage by comparing successive peaks.
The decisions since 2012 have provided for some modest real income retention by these workers although it depends on how inflation is measured.
You can also see the troughs became shallower between 2012 and 2016 than in the past because the inflation rate moderated as a result of the GFC and the austerity since that has kept economic activity at moderate levels.
In more recent years the peak-trough amplitude has risen again and the FMW adjustments have failed to redress the purchasing power erosion to the nominal FMW even though each adjustment provides some immediate real wage gain for workers, those gains are ephemeral and the inflation process systematically cuts the purchasing power of the FMW significantly by the time the next decision is due – these are permanent losses.
Last year’s decision meant the purchasing power of the FMW returned to a level not seen since 2020.
The current decision almost holds that line.
The other issue is that in the 12 months ahead, there is modest real wage erosion compared to the real NMW at the end of 2023.
The other problem relates to the appropriate measure of inflation.
I discuss that issue in detail in this blog post – Real wage cuts continue in Australia as profit share rises (May 15, 2024).
In a nutshell, the FWC uses the CPI as the measure.
However, the Australian Bureau of Statistics (ABS) recognise that there was a “need to develop a measure of ‘the price change of goods and services and its effect on living expenses of selected household types” and they now publish their so-called Selected Living Cost Indexes (SLCIs), which use expenditure patterns of different cohorts in society (as weights in the index) to assess the “the extent to which the impact of price change varies across different groups of households in the Australian population”.
One of their SCLI is the Employee Households index.
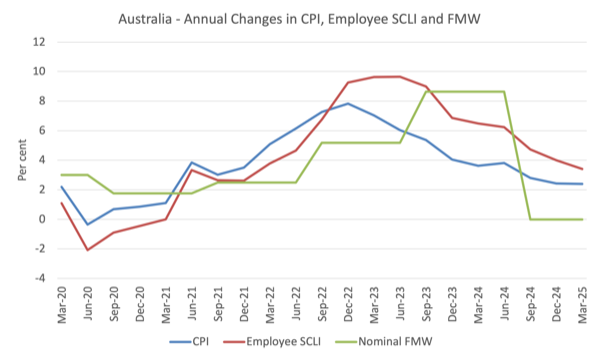
In the March-quarter 2025, for example, the annual growth in the CPI was 2.4 per cent, while for the Employee SCLI it was 3.4 per cent.
Over the recent inflationary episode the SCLI has been well above the CPI in growth terms.
What this means is that recent nominal wage adjustments designed to preserve real purchasing power that use the CPI as the inflation measure will seriously understate the real wage erosion.
The following graph shows the problem – it shows the annual movements in the CPI, Employee SCLI and the nominal FMW since the March-quarter 2020.
When the FMW is above the other lines then the real purchasing power of the minimum wage is rising and vice versa.
You can see that since the December-quarter 2021, the real erosion in the nominal FMW has been significant apart from the 2024 decision and the most recent decision.
In that context, the 3.5 per cent increase in the NMW and its flow-ons, barely preserves the purchasing power of the workers in receipt, which is not something that the media narrative in the last 24 hours has picked up on.
Lowest-paid workers improve relative to other workers but all workers still fail to share in productivity growth
Another perspective is to compare the movement in the Federal Minimum Wage with growth in GDP per hour worked (which is taken from the National Accounts).
GDP per hour worked is a measure of labour productivity and tells us about the contribution by workers to production.
Labour productivity growth provides the scope for non-inflationary real wages growth and historically workers have been able to enjoy rising material standards of living because the wage tribunals have awarded growth in nominal wages in proportion with labour productivity growth.
The widening gap between wages growth and labour productivity growth has been a world trend (especially in Anglo countries) and I document the consequences of it in this blog post – The origins of the economic crisis (February 16, 2009).
But the attack on living standards has targetted more than the bottom end of the labour market, although the minimum wage workers have certainly been more deprived of the chance to share in national productivity growth than other workers.
The recent FWC decisions provides some relief to that trend.
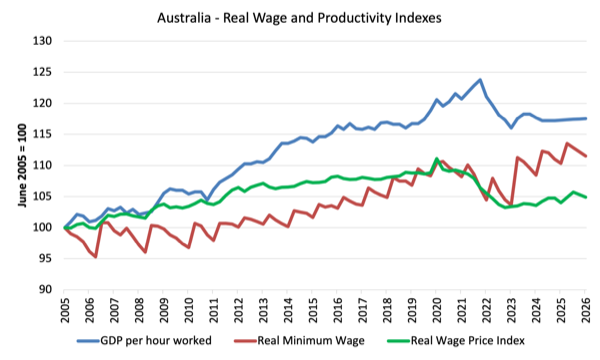
The following graph shows the evolution of the real Federal Minimum Wage (red line), GDP per hour worked (blue line), and the Real Wage Price Index (green line), the latter is a measure of general wage movements in the economy.
The graph is from the June-quarter 2005 up until June-quarter 2026 (indexed at 100 in June 2005 and extrapolated as above out to 2024).
The last known observation is the March-quarter 2025.
I have extrapolated out to the June-quarter 2026 using standard assumptions of steady growth in productivity, and RBA inflation forecasts for the CPI series.
By the March-quarter 2025, the respective index numbers were 117.6 (GDP per hour worked), 104.9 (Real WPI), and 111.0 (real FMW).
All workers have failed to enjoy a fair share of the national productivity growth. However, the most recent FWC decisions have seen the lowest paid workers improve their position relative to other workers.
Like all graphs the picture is sensitive to the sample used. If I had taken the starting point back to the 1980s you would see a very large gap between productivity growth and wages growth, which has been associated with the massive redistribution of real income to profits over the last three decades.
The extent of real wage erosion at the bottom
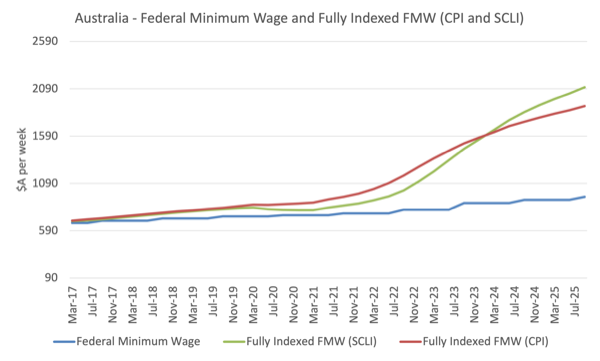
I calculated what the Federal Minimum Wage (NMW) would be had the FWC (and its antecedents) fully indexed the FMW from the March-quarter 2016 level of $A672.70 per week.
I used the CPI and the Employee SCLI to inflate that nominal weekly wage out to the September-quarter 2025, which is when the latest FWC decision takes effect.
The following graph compares the actual NMW since the March-quarter 2016 with what it would have been in nominal terms had it grown in line with the CPI and the Employee SCLI – that is, had it been fully indexed.
The differences are massive:
1. The nominal NMW in the September-quarter 2025 will be $A948 per week.
2. If fully indexed to the CPI since the March-quarter 2016, it would have been $A1,908.37 per week a difference of $A960.37 per week (almost double).
3. If fully indexed to the Employee SCLI since the March-quarter 2016, it would have been $A2,106.10 per week a difference of $1,158.10 per week.
Conclusion
The FWC provided a 3.5 per cent nominal wage increase for the lowest paid workers in its 2025 National Wage Case decision.
Against the current CPI growth, that provides for some modest real wage increase for this cohort.
However, note the discussion above as to the best purchasing power measure to use.
Against the more applicable Employee SCLI, the decision provides for barely any real wages growth and fails to redress the massive real wage cuts in recent years.
Of course, the employers were aghast at the decision while at the same time pocketing record profits as a result of their profit gouging.
Same old.
That is enough for today!
(c) Copyright 2025 William Mitchell. All Rights Reserved.
According to blissex comments: paper by one of the conservative think thanks published in the late 70s that showed that even given the same level of income and education and classvoters were far more likely to vote to the right if:
They owned and used a car rather than using public transport.
They owned shares rather than having a pension.
They owned a house instead of renting.
That is even middle-upper class voters were more likely to vote left instead of right if they used public transport, had a pension, and rented, and most importantly even working class voters would vote for the right if they owned a car, some shares, and a house, no matter how thin such ownership was.
pushing up house prices and pushing down wages may be break even for a voter – but what it does is mean they have a far greater % of income coming from property. People notice when being landlords nearly doubles their income. How will mmt deal with this change in political economy??