Over the last several years, I have been indicating that I think we are in…
Full employment = mass idle labour – detaching language from meaning
In the Golden Egg by Donna Leon, which I was reading on a flight over the weekend, there was a discussion about language and meaning. The detective in question was musing about how crimes are described and concluded that when we “detach language from meaning … The world is yours”. The worst crimes become anaesthetised. In my professional domain (economics), this detachment is rife and leads to poor policy choices. One such example, which is close to the focus of my own research work over the years has been the way in which the mainstream economists have revised the concept of full employment. We now read that Australia, for example, is at “full employment” when its official unemployment rate is 5.7 per cent (1.7 per cent above its previous low in February 2008), underemployment is 8.4 per cent, and the participation rate is still a full 1 percentage below its November 2010 peak (meaning some 190 thousand workers have dropped out of the labour force). By any stretch, the total labour underutilisation rate (that is, idle but willing labour) is in excess of 16 per cent. But to some smug journalists who cannot even get their facts straight, that is ‘full employment’. Mainstream economics – detaching language from meaning and misleading a nation as a result.
We have many examples in the recent past of this capacity to detach language from meaning.
I have noted in the past the absurdity of the so-called ‘Output Gaps Working Group’ estimates within the European Commission which noted in 2013 that fiscal deficits in the Eurozone were mostly structural in nature rather than cyclical – which means they believed that the Member States were close to ‘full employment’ at the time.
On Wall Street Journal report (September 19, 2013) – Austerity Seen Easing With Change to EU Budget Policy said that:
… some of the bloc’s weakest economies are operating relatively close to full capacity … For example, the latest commission estimate is that the Spanish gap is just 4.6% of gross domestic product, despite nearly 27% of Spain’s labor force being officially unemployed … The commission believes that the “natural” rate of unemployment – if the Spanish economy were operating at full potential – is 23%.
It was obviously ridiculous to assume that the Spanish unemployment rate had risen so sharply in such a short period of time due to ‘structural’ factors.
Similarly, in an attempt to dispute the negative comments coming from last week’s very poor Australian labour market data, a Fairfax journalist published her own view of the data (June 18, 2016) – Forget ‘and growth’ – it’s the ‘jobs’ that do the work.
The article detaches language from meaning and, in addition, to being error ridden (on fact not opinion), presents a preposterously, uncritical view of the way we see the world.
I agree with the journalist that when assessing the state of the economy, the labour force data is more current than the National Accounts and/or CPI data. The National Accounts data, for example, tells us what was happening three months ago, which is interesting but not very helpful in telling us where the economy is at now.
I also agree that what is happening with employment is an important signal to the general health of the economy and, by its intrinsic link, society.
However, caution always must be exercised when dealing with the monthly labour force survey data given the unreliability of the underlying population estimates. So we tend to assess the data with moving averages over at least six months to gauge trends.
The journalist is correct to note that any reasonable concept of full employment, where everyone who wants a job has one, will include some positive unemployment rate.
Economists have long used taxonomies to organise their thoughts about unemployment. An often used categorisation focuses on the distinction between frictional, structural, cyclical (demand-deficient), and seasonal categories of unemployment.
It is recognised that the labour market is in a constant state of flux. Jobs are continually being created and destroyed, which means that workers who have been laid-off or quit are moving between jobs while firms are seeking workers for new jobs created or to fill existing jobs where the previous incumbent has left.
Further, new entrants into the labour force seek work while retirees leave jobs.
Thus frictional unemployment arises because the matching of these demand and supply flows is not instantaneous.
It takes time for workers and employers to gather relevant information and move between labour force states.
Frictional unemployment is considered to be a short-term phenomenon and part of normal functioning of the labour market.
While it is debatable, this category would comprise around 1 to 2 per cent of the labour force.
Structural unemployment is said to arise then there are enough jobs available overall to match the total pool of unemployment but that there are mismatches between the skill demanded and the skills supplied and/or between the location of the jobs available and the location of the unemployment.
This category of unemployment is often discussed in the context of industrial restructuring (for example, the decline of the manufacturing sector or deindustrialisation).
Changes in the composition of industry create jobs losses in declining sectors and new job opportunities in emerging sectors.
Further, given that industry is not spread evenly across regional space, the decline of a major firm in one region will have significant implications for the local labour market.
Changes in technology are also considered to have structural impacts in the sense that new skills become relevant while old skills cease to be in demand by firms.
All of these disruptions to the pattern of employment take time to resolve.
The relocation and re-training of workers displaced by structural change is sometimes a lengthy process. It is the changing pattern of required skills, the changing location of jobs and the extended time taken to resolve the resulting demand and supply imbalances that distinguishes the concept of structural unemployment from frictional unemployment.
However, there are two important qualifications to the normal conceptualisation of structural unemployment, which is not often considered in the mainstream narrative.
First, the concept of a skills shortage is a relative concept, implying some distance from an optimal state, which begs the question: according to whom.
Unsurprisingly, analyses of skills shortages by industry and governments invariably consider the issue from the perspective of business and profitability, which places the emphasis on containment of labour costs both in terms of wages and conditions, and hence, whenever possible, externalising the costs associated with developing the skills firms require in their workers.
Within this context the notion of structural unemployment arising from “skills mismatch” can be understood as implying an unwillingness of firms to offer jobs (with attached training opportunities) to unemployed workers that they deem to have undesirable characteristics.
When the labour market is tight, the willingness of firms to indulge in their prejudices is more costly and they clearly alter (lower) their hiring standards.
However, when labour underutilisation is high firms can easily increase their hiring standards (broaden the desired characteristics they demand from workers) and the training dynamism driven by labour shortages is lost.
Then we observe, in a static sense, ‘skill mismatches’ which are really symptoms of a ‘low pressure’ economy.
Second, the fact that hiring standards and the willingness of firms to offer training slots to correspond with job offers varies with economic activity means that the concept of structural unemployment is difficult to distinguish from the demand-deficient unemployment, which is related to a lack of aggregate spending in the economy.
Cyclical or demand-deficient unemployment arises when there is a shortage of jobs overall relative to the willing supply of labour resources (persons and hours) at the current wage levels.
This category is termed demand-deficient unemployment because it relates to a deficiency in aggregate demand. Unemployment thus varies over the economic cycle – rising when aggregate spending falls below the level needed to fully employ the available workforce and falling when aggregate spending moves closer to the level needed to full employ the available supply of labour.
Cyclical unemployment is also known as mass unemployment and arises because of the macroeconomic system fails to generate enough jobs to match the preferences of the available workforce. It is also related to the concept of an output gap, which measures the percentage deviation of real GDP from the potential production levels at any point in time.
During an economic downturn (which may become a recession), cyclical unemployment will be the dominant proportion of measured unemployment. When economic activity improves as a result of increased aggregate demand, cyclical unemployment falls.
So to ground the rest of this blog, I consider that the full employment state in Australia as being satisfied if:
1. The official unemployment rate is between 2 and 3 per cent, leaning towards the lower edge of the band. So remaining unemployment is of a frictional nature – moving between jobs.
2. There is zero underemployment – that is, no part-time workers signals they desire more hours of work.
3. There is zero hidden unemployment – that is, participation rates are at their peak.
We can debate the qualitative aspects of that quantitative definition, which bears on the quality of jobs defined under Criterion 1 and the lack of skills-based underemployment under Criterion 2.
The Fairfax journalist suggests that the best proxy for ‘full employment’ is the “Non Accelerating Inflation Rate of Unemployment – the lowest that the jobless rate can go without sparking inflation pressure”.
That is, the so-called NAIRU.
I have written several blogs about why the NAIRU is, essentially a dangerous and deeply flawed concept.
Among others:
1. The dreaded NAIRU is still about!.
2. NAIRU mantra prevents good macroeconomic policy.
3. Why we have to learn about the NAIRU (and reject it).
4. No coherent evidence of a rising US NAIRU.
5. Structural deficits and automatic stabilisers.
6. Structural deficits – the great con job!.
7. Redefining full employment … again!.
I won’t repeat the detail in those blogs.
By way of summary, the NAIRU evolved out of the Monetarist attack on discretionary fiscal policy in the late 1960s. Milton Friedman introduced the ‘natural rate of unemployment’ into the literature which posited that there is only one unemployment rate consistent with stable inflation.
Accordingly, under this hypothesis there is no discretionary role for aggregate demand management and only microeconomic changes can reduce the natural rate of unemployment should it be considered by policy makers to be too high.
If governments tried to reduce the unemployment rate below the so-called natural rate by increasing its deficit spending, then inflation would accelerate and the attempt to reduce the unemployment would be self-defeating.
Full employment as genuine policy goal was abandoned at that point and the policy debate became increasingly concentrated on deregulation, privatisation, and reductions in the provisions of the Welfare State with tight monetary and fiscal regimes instituted.
The result has been that high unemployment persisted in most nations even prior to the most recent meltdown associated with the GFC.
The Fairfax journalist tried to make the NAIRU ‘operational’ for her readers – that is, give it meaning as some “procy for full employment”.
She wrote:
Treasury used to estimate it as about 5 per cent, but the Organisation for Economic Co-operation and Development recently estimated it may be closer to 5.7 per cent, because of a slowdown in labour productivity and a higher rate of long-term unemployment.
Factual error – the OECD actually estimate the Australian NAIRU to have risen from 5 per cent in 2008 to a current value of 5.9 per cent.
Estimates of the NAIRU have long, been plagued by imprecision.
An early investigation into this imprecision, Staiger, Stock and Watson in 1997) and their so-called “state-of-the-art” estimation of NAIRU models led them to conclude that:
… these estimates are imprecise; the tightest of the 95 percent confidence intervals for 1994 is 4.8 to 6.6 percentage points. If one acknowledges that additional uncertainty surrounds model selection and that no one model is necessarily ‘right’, the sampling uncertainty is prudently considered greater than suggest by the best-fitting of these models.
What they came up with (Page 39) was 95 percent confidence intervals of 2.9 percent to 8.3 percent. In other words, they were claiming that they were equally confident that the NAIRU was 2.9 per cent or 8.3 per cent.
This range of uncertainty about the location of the NAIRU is clearly too large to be at all useful. Say the unemployment rate was currently 6 per cent. Then at the lower confidence interval bound (2.9 per cent) this would allow for a major fiscal expansion without inflationary consequences (using the flawed NAIRU logic).
But if the NAIRU was actually at the upper confidence interval bound (8.3 per cent), then according to the same (flawed) logic such a fiscal expansion would be highly inflationary.
The econometricians were unable to discriminate between the two possibilities – they were equally confident that both were true.
Undaunted by these ridiculous results, the policy makers ignored the imprecision of the estimates and just focused on point estimates (that is, ignoring the confidence bands), which invariably supported their ideological preference against any government fiscal intervention.
Further, it is common for mainstream economists (such as in the OECD reports) to claim that lowere productivity growth and higher rates of long-term unemployment have pushed up the full employment unemployment rate.
However, both lower productivity growth and rising long-term unemployment are typically cyclical events (as in the current period) – the result of the economy operating at well below its potential.
I discuss that issue in these blogs – Redefining full employment … again! and The unemployed cannot find jobs that are not there!.
A prolonged recession or slowdown creates conditions in the labour market which mimic structural imbalance but which can be redressed through aggregate policy without fuelling inflation.
The concept of rising NAIRU estimates is hardly novel. It have been wheeled out in every major recession that has occurred since the NAIRU entered the literature in the late 1960s (as the natural rate).
The NAIRU concept is totally bereft – on theoretical and empirical grounds (this is what my 2008 book with Joan Muysken – Full Employment Abandoned – is partly about).
The reality is that labour market imbalances and cyclical adjustment processes do occur during recessions. But these processes also unwind again when the economy grows. The faster is the GDP growth the more quickly the firms get to the end of the labour queue and are forced by market pressures to take on the long-term unemployed and other disadvantaged workers and offer them the requisite training.
If the national government allows the economy to languish with tepid growth in the recovery then this queue lengthens initially and takes years to start shortening again. The resulting monumental waste of human capacity is directly attributable to poor macroeconomic policy interventions driven by neo-liberal misconceptions.
And to put it in finer relief: the national government in most countries (if they are sovereign in their own currency) can prevent the jobless queue from increasing in the first place by creating a buffer stock of public sector jobs that they unconditionally offer to anyone who wants to work at the minimum wage. This is the Job Guarantee.
With the current unemployment rate of 5.7 per cent in Australia, the Fairfax journalist wrote:
Estimating the NAIRU is notoriously hard, but those worried about our economic future should take heart from this week’s jobs report showing the unemployment rate steady at 5.7 per cent.
Wow, full employment!
No, not quite. But it’s certainly a number doomsayers should keep in mind. Indeed, Australia’s jobs market is acting as an important anchor in choppy economic waters.
So what does that mean? We are at full employment or close? It seems that the message is that the Australian labour market is performing well.
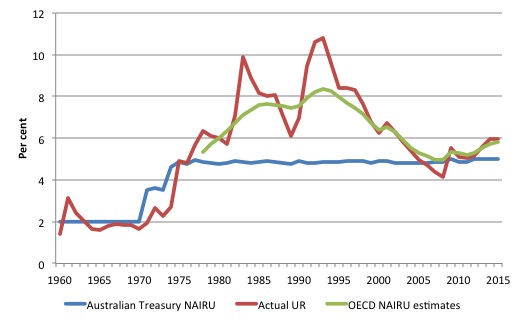
The following graph shows the evolution of the actual Australian unemployment rate (red line), the Australian Treasury estimates of the NAIRU (blue) and the OECD estimates of the NAIRU (green) from 1960 to 2015.
The Treasury estimates of the NAIRU just jump sharply in the 1974 recession. There was nothing ‘structural’ happening then to justify that jump. The only event that happened was the stagflation – a cyclical event.
The OECD estimtes of the NAIRU are even worse. They just track the actual unemployment rate (in a smoothed lag fashion). The unemployment rate is very cyclical and asymmetric – it rises sharply in recessions and falls slowly during the recovery.
That is a common pattern in all economies. The estimated NAIRU just tracks that pattern. The point is that there are no structural changes going on here which would justify the claim that ‘structural’ unemployment rose sharply in the second half of the 1970s or fell sharply in the 1990s.
Nor that it rose again sharply in recent years.
When we have examined the so-called structural determinant so the NAIRU (such as, unemployment benefits, replacement ratios (dole), tax wedges (on-costs etc) we find: (a) they are highly cyclical; and (b) when you strip the cyclical component out (detrend) you find they don’t explain any change in the underlying estimates of the NAIRU.
One concludes that there is no ‘separate’ and meaningful informational content in these NAIRU estimates.
I have a short video in this blog – Why we have to learn about the NAIRU (and reject it) – where I demonstrate this point.
Facts about idle labour
The Fairfax journalist wrote:
The underemployment rate – the proportion of the labour force who have jobs, but would like to, and are able to, work more – was steady at 8.4 per cent in the month.
A broader measure of unsatisfied demand for work in the economy, the under-utilisation rate rose slightly from 14.1 to 14.2 per cent.
The under-utilisation rate adds up the jobless, the under-employed and discouraged jobseekers and expresses them as a percent of the labour force.
Factual error: the under-utilisation rate she refers to does not include “discouraged jobseekers” (the participation effect that follows an economic slowdown).
In last week’s Labour Force data report – Australia, the part-time employment nation – further poor labour market data – I noted that in the May-quarter 2016, total underemployment was 8.4 per cent (1,067.3 persons – up by 10.3 thousand since February) and the ABS broad labour underutilisation rate (the sum of unemployment and underemployment) was 14.2 per cent (up by 0.1 percentage points).
There were 1,067.3 thousand persons underemployed and a total of 1,793.7 thousand workers either unemployed or underemployed.
Here is an additional graph that I didn’t publish in that Report. It shows the ABS broad underutilisation rate which, Jessica, is the sum of the unemployment rate and the underemployment rate.
In the period before the 1991 recession, underemployment was modest and so this series was dominated by movements in the official unemployment rate.
Underemployment soared in the 1991 recession and afterwards as firms increasingly replaced full-time jobs with part-time (and casual) work.
Even at the low-point unemployment rate in the last cycle (February 2008), the broad underutilisation rate was 10 per cent.
The unemployment rate was 4 per cent and could hardly have been deemed a full employment state given that on average the 663.3 thousand part-time workers who desired, on average 15.1 extra hours of work at the time.
The situation has deteriorated considerably since then.

Further, as my recent Labour Force report calculated, with the participation rate at depressed levels (at least 1 percentage point below the November 2010 peak, the implied extra hidden unemployment would mean:
1. The official unemployment rate of 5.7 per cent would rise to 7.1 per cent if these workers had not dropped out of the labour force.
2. That means that unemployment would rise from 724.8 thousand to 914.6 thousand and that does not include the hidden unemployed that existed prior to November 2010.
3. All up, the idle labour embodied in official unemployment plus underemployment plus the change in hidden unemployment since November 2010 would sum to around 15.5 per cent or 1981.4 thousand workers in a total labour force of 12,637 thousand.
To construe that much idle labour as being at or even close to full employment is to detach language from meaning.
It beggars belief that Australia is near full employment. Other observations include:
1. Real GDP is below trend and Real net national disposable income has declined over the last 12 months. Australia is in an income recession at present – Australian national accounts – growth on back of volatile exports.
2. Wages growth is at its lowest level since the data series began – Australia is caught in a cyclical malaise – there is nothing ‘new normal’ about it.
3. Australia has now entered a deflationary state – Australia enters the deflation league of sorry nations.
I have also shown in the past (both in published academic work and via my blogs) that there is a tenuous relationship between unemployment and inflation these days anyway.
With underemployment above 1 million people in Australia, much lower unemployment rates than before are associated with stable inflation rates (that latter relationship which the NAIRU tries, poorly, to capture).
In other words, we would expect the NAIRU estimates to be lower if the wage equations (from which they are derived – mostly) were correctly specified.
I discuss that sort of research in this blog – Why did unemployment and inflation fall in the 1990s?.
That research allowed us to better understand why unemployment and inflation fell at the same time during the 1990s, even when the actual unemployment rate was falling well below the official estimates of the NAIRU (by the OECD, the IMF, Treasury, central banks, organisations like the US Congressional Budget Office etc).
The NAIRU is meant to be an inflation constraint. The work shows that the NAIRU is a very slippery concept and of zero policy use. The reason that unemployment and inflation was falling together in the 1990s and later is because underemployment was rising.
Firms devised a new way of creating labour slack, which allowed them to restrain the growth in wages and pursue higher margins.
The Fairfax journalist tries to explain away the fact that employment growth has been weak and dominated by part-time work over the last several years by claiming:
It remains to be seen if this trend towards part-time work is sustained and whether it is a choice people are making, or if they are having it thrust upon them when they would prefer to work full-time.
It doesn’t remain to be seen at all.
Since February 2016, an extra 10.3 thousand workers became underemployed as growth in full-time work evaporated.
There are now 1,067 thousand underemployed workers on average wanting in excess of 15 hours extra work.
The jury is out on whether this rise in part-time work is chosen or not!
The journalist then, again in denial of reality, writes:
Overall, however, the jobs outlook remains sturdy. The pace of annual jobs growth has slowed slightly this year from a rapid clip in the second half of last year, but new jobs are keeping up with new demand for them.
This is language detached from meaning.
Over the last year, the labour force growth rate has fallen with participation dropping, which is why the employment growth has been able to keep pace with the labour supply growth.
And it has been dominated by part-time work.
But over the last 6 months employment has barely grown (0.3 per cent only) at all and the trend is somewhat bleak.
That doesn’t conjure up images of sturdy – when we attach meaning to that word.
Job Guarantee Challenge
I always think of a simple challenge to these characters who claim that full employment is consistent with in excess of 15 per cent idle labour.
If we introduced a Job Guarantee – where the government offered anyone who wanted to work an unconditional job at a decent minimum wage – what would happen to the unemployment rate (and the broader measures of underutilisation)?
If you really believed the economy was at full employment then nothing much would happen at all.
I would predict that more than 1.5 million Australians would virtually immediately line up for a job – a fair swag of the unemployed, underemployed and the hidden unemployed.
As the offer became better understood, more would desire to get a Job Guarantee position and regain some income security.
And inflation – wouldn’t move a tick or more!
Conclusion
When we use terms such as full employment they have to actually mean something.
We lose that meaning when the concepts get tied up in ideological and technical exercises designed to nurture a particular policy position that has abandoned the pursuit of full employment and wants to disguise that fact from the voting public.
The ideologues then get journalists who leave their brains behind to con the public into accepting the new mantra.
But meaning is gone by then.
That is enough for today!
(c) Copyright 2016 William Mitchell. All Rights Reserved.
‘Skills shortage’ is almost always an ‘investment shortage’ in reality – either in automation, better processes or training opportunities.
We need to switch the system to tight labour markets and intense competition to drive the investment process. And if that doesn’t work, then markets don’t work.
Completely agree with Bill’s post. Bill’s work is empirically based. It astonishes me that the unempirical nonsense of the neocons and monetarists still holds sway after all these years of its continuous failure. It shouldn’t astonish me of course. If there is one thing that a lifetime of observation has taught me, it is that “life supporting false beliefs” are incredibly tenacious… usually held until systemic collapse.
Very interested Bill in your comment on language. One of the principal impediments in understanding economics, the empirical MMT kind, is the use of descriptors that are different from the usual meaning associated with the word.
A few obvious ones: “Budget surplus”. Is in reality the gap between the tax take and the spending shortfall by government. But is not a surplus in any meaningful sense, just a shortfall, money not yet even created.
“Budget Deficit”, the opposite of course but is actually extra money injected into the economy. Not what one would consider a deficit.
“Government debt”. Here we see the descriptor from the government’s side which is not the way we see our own bank deposits, bank debts. Yet government debts are investors’ bank deposits. Why not pick a more appropriate descriptor?
I’m sure there are others, but these common ones cause a lot of misunderstanding
John Doyle, The very word “budget” applied to describe the federal fiscal position misrepresents the actual process that is taking place. How would Joe Public, who has never heard of Modern Money Theory, ever get a glimpse of reality when politicians and the media constantly bombard us with words like this?
To continue upon John’s point, in particular the terms budget surplus and budget deficit imply a comparison, and this comparison is all but meaningless in MMT, as it provides no useful information upon which to act. That MMTers would even used then seems to cede otherwise to MMT’s opponents.