Over the last several years, I have been indicating that I think we are in…
Australia, the part-time employment nation – further poor labour market data
The latest labour force data released today by the Australian Bureau of Statistics – Labour Force data – for May 2016 show that those ominous signs that have been apparent for most of this year have brought the Labour market to a halt – stagnating with low to zero employment growth and static (slightly rising) unemployment at elevated levels. Trend employment growth has is slowly receding to zero. Total employment growth was virtually non-existent with only 17,900 (net) jobs created. Full-time employment remained unchanged after declining last two months. Almost all of the employment growth was part-time and most of that occurred in the teenage segment of the labour market, although that cohort went backwards in terms of full-time employment. Over the last six months, full-time employment has contracted by 44.4 thousand (net) jobs. Australia is becoming a part-time employer and that signals badly for the quality of work. Underemployment has also risen by 10 thousand or so since February 2016. The teenage labour market remains in a poor state and requires urgent policy intervention. Overall, with weak private investment now on-going, the Australian labour market is looking very weak and the Federal government should have introduced a rather sizeable fiscal stimulus in its May 2016 fiscal statement. This should have included a large-scale public sector job creation program which would ensure teenagers regained the jobs that have been lost due to the fiscal drag over the last several years. However, the Federal government appears incapable of addressing this dire issue. The current election campaign is bogged down in arcane and mythical discussions about running out of money and not being able to defend the economy if there is another crisis. Both major parties are constantly pretending they will be the best at “budget repair” (as if the fiscal balance is a car or something) even though the reality requires higher discretionary fiscal deficits at present. All make believe, while the real world does head towards another major rift. It should be up to the Opposition to shift the political agenda in the current election campaign. But, they are missing in action on these important issues.
The summary ABS Labour Force (seasonally adjusted) estimates for May 2016 are:
- Employment increased 17,900 (0.2 per cent) with full-time employment unchanged (the third consecutive month of zero or no growth) and part-time employment increasing by 17,900.
- Unemployment increased by 1,600 to 726,400.
- The official unemployment rate remained steady at 5.7 per cent.
- The participation rate remained steady at 64.8 per cent. This is well below its November 2010 peak (recent) of 65.8 per cent.
- Aggregate monthly hours worked increased 27.7 million hours (1.7 per cent), after three consecutive month of negative growth.
- The quarterly ABS broad labour underutilisation estimates (the sum of unemployment and underemployment) for the May quarter were updated this month. Underemployment rose by 10.8 thousand at 8.4 per cent of the labour force. The total labour underutilisation rate (unemployment plus underemployment) rose by 0.1 per cent to 14.2 per cent. There were 1,067.3 thousand persons underemployed and a total of 1,793.7 thousand workers either unemployed or underemployed. The next quarterly release will be in the August 2016 publication.
The ABS said that:
Monthly trend employment growth in Australia eased further in May 2016 … Over the past month, trend employment increased by 3,700 persons to 11,919,400 persons – a monthly growth rate of 0.03 per cent. This monthly growth rate was below the monthly average over the past 20 years (0.15 per cent), and down further from the recent peak of 0.26 per cent in September 2015 …
This is the eleventh consecutive month with part-time employment increases of more than 10,000 persons; and fourth consecutive month with full-time employment decreases of more than 5,000 persons …
Hours worked have decreased by 13.7 million hours (0.8 per cent) over the last 6 months, down from the high point at December 2015.
Employment growth – nearly non-existent
Total (net) employment in May 2016 is estimated to have increased by 17,900 jobs. Full-time employment was unchanged and part-time employment increasing by 17,900.
There has been no growth in full-time employment since January 2016, which highlights the deteriorating labour market situation in Australia.
The zig-zag pattern that we have observed over the last 36 months or so – where the employment estimates have been switching back and forth regularly between negative employment growth and positive growth with the occasional spikes – continues.
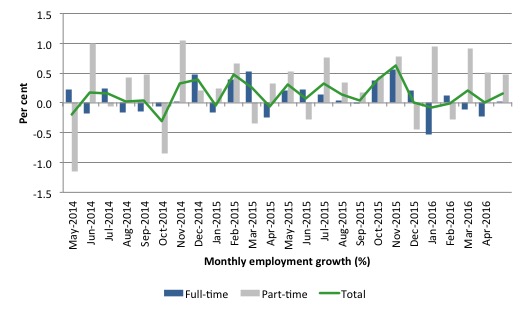
The following graph shows the month by month growth in full-time (blue columns), part-time (grey columns) and total employment (green line) for the 24 months to May 2016 using seasonally adjusted data.
It gives you a good impression of just how flat employment growth has been over the last 2 years.
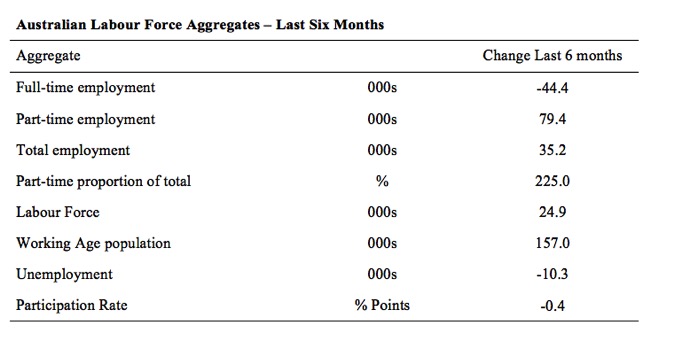
The following table provides an accounting summary of the labour market performance over the last six months. The monthly data is highly variable so this Table provides a longer view which allows for a better assessment of the trends. WAP is working age population (above 15 year olds).
Full-time employment has fallen by 44.4 thousand jobs (net) while part-time work has risen by 79.4 thousand jobs. Thus, 225 per cent of the total employment created (net) over the last 6 months has been part-time.
The conclusion – overall there have only been 35.2 thousand jobs (net) added in Australia over the last six months while the labour force has increased by only 24.9 thousand. Employment growth has thus outstripped the increase in the supply of labour with the result that unemployment has fallen by 10.3 thousand.
This should not be taken as an indication of strong employment growth. Rather, the labour force growth is pathetic, and labour force participation has declined markedly (-0.4 percentage points), which shows a declining labour market. The participation rate remains at depressed levels.
Unemployment is thus being exported out of the labour force into hidden unemployment given the poor employment growth.
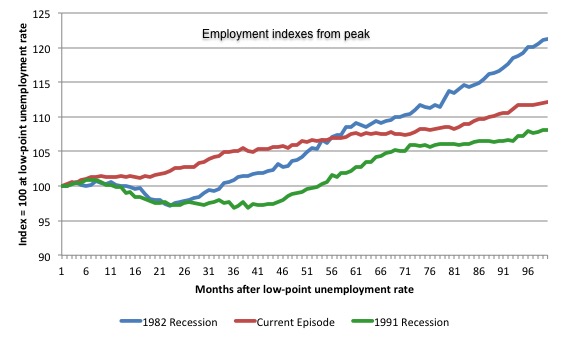
The following graph shows employment indexes for the last 3 recessions and allows us to see how the trajectory of total employment after each peak prior to the three major recessions in recent history: 1982, 1991 and 2009 (the latter to capture the current episode).
The peak is defined as the month of the low-point unemployment rate in the relevant cycle and total employment was indexed at 100 in each case and then indexed to that base for each of the months as the recession unfolded.
I have plotted the 3 episodes for 99 months after the low-point unemployment rate was reached in each cycle – the length of the current cycle.
The initial employment decline was similar for the 1982 and 1991 recessions but the 1991 recovery was delayed by many months and the return to growth much slower than the 1982 recession.
The current episode is distinguished by the lack of a major slump in total employment, which reflects the success of the large fiscal stimulus in 2008 and 2009.
However, the recovery spawned by the stimulus clearly dissipated once the fiscal position was reversed and the economy fell back into producing very subdued employment outcomes.
While the employment growth was stronger in October and November 2015 we now know that the estimates were distorted by the rotational issues in the sample used by the ABS as well as other issues relating to survey reliability over that period.
Moreover, since February 2008, employment has grown by a miserly 12 per cent, which is a very slow pace in historical terms for such a long period.
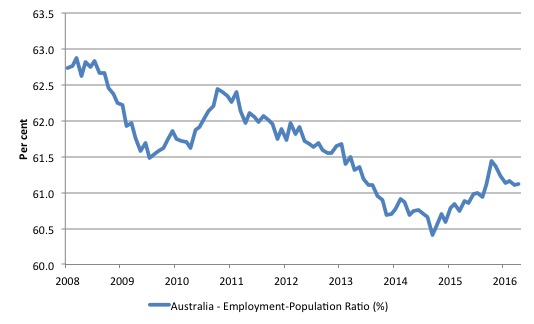
Given the variation in the labour force estimates, it is sometimes useful to examine the Employment-to-Population ratio (%) because the underlying population estimates (denominator) are less cyclical and subject to variation than the labour force estimates. This is an alternative measure of the robustness of activity to the unemployment rate, which is sensitive to those labour force swings.
The following graph shows the Employment-to-Population ratio, since February 2008 (the low-point unemployment rate of the last cycle).
It dived with the onset of the GFC, recovered under the boost provided by the fiscal stimulus packages but then went backwards again as the last Federal government imposed fiscal austerity in a hare-brained attempt at achieving a fiscal surplus.
The ratio began rising in October 2014 which suggested to some that the labour market had bottomed out and would improve slowly as long as there are no major policy contractions or cuts in private capital formation.
However, the peak in November is now gone and the ratio is once again in retreat.
The on-going fiscal deficit is still supporting some growth in the economy as the spending associated with the mining boom disappears. But the deficit is clearly too small given the behaviour of the real aggregates.
The series remained unchanged in May 2016 but remains 1.8 points below the May 2008 peak of 62.9 per cent.
Teenage labour market – mixed but remains in poor shape
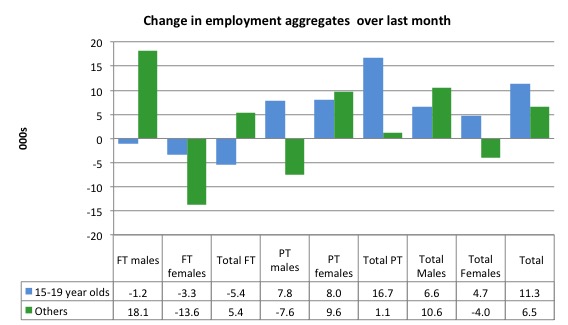
The teenage labour market presented a mixed bag in May 2016 with full-time employment falling by 5.4 thousand and part-time employment rising by 16.7 thousand (net) jobs. Teenagers accounted for almost all the growth in overall part-time employment in May 2016.
Total employment thus rose by 11.1 thousand (net).
The following graph shows the distribution of net employment creation in the last month by full-time/part-time status and age/gender category (15-19 year olds and the rest)
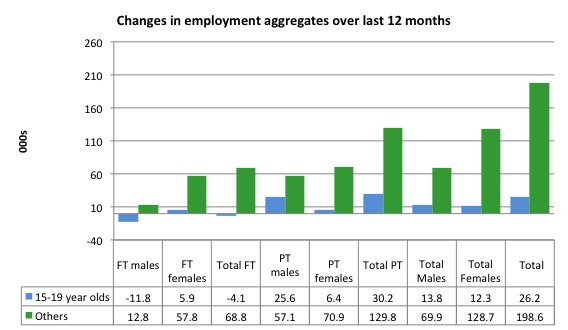
Over the last 12 months, teenagers have gained only 26.2 thousand (net) jobs overall while the rest of the labour force have gained 198.6 thousand net jobs. Remember that the overall result represents a fairly poor annual growth in employment.
However, full-time employment growth for teenagers over the last 12 months has been negative.
The teenage segment of the labour market is being particularly dragged down by the sluggish employment growth, which is hardly surprising given that the least experienced and/or most disadvantaged (those with disabilities etc) are rationed to the back of the queue by the employers.
The following graph shows the change in aggregates over the last 12 months. It is as if the teenagers have not had a stake in the labour market either way (blue bars barely visible).
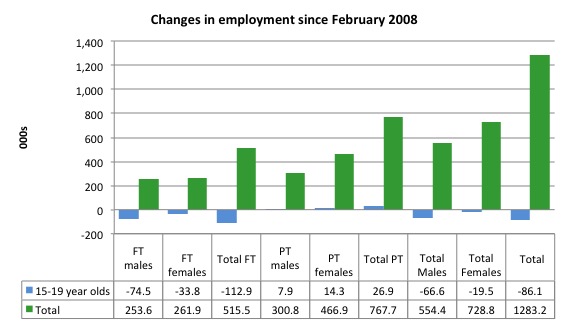
To further emphasise the plight of our teenagers, the following graph extends the time period from February 2008, which was the month when the unemployment rate was at its low point in the last cycle, to the present month (May 2016). So it includes the period of downturn and then the so-called “recovery” period. Note the change in vertical scale compared to the previous two graphs.
Since February 2008, there have been only 1,283.2 thousand (net) jobs added to the Australian economy but teenagers have lost a staggering 86.1 thousand over the same period. It is even more stark when you consider that 112.9 thousand full-time teenager jobs have been lost in net terms.
Even in the traditionally, concentrated teenage segment – part-time employment, teenagers have gained only 26.9 thousand jobs (net) even though 767.7 thousand part-time jobs have been added overall.
Overall, the total employment increase is modest. Further, around 60 per cent of the total (net) jobs added since February 2008 have been part-time, which raises questions about the quality of work that is being generated overall.
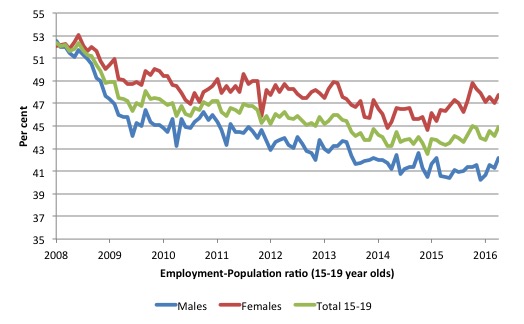
To put the teenage employment situation in a scale context the following graph shows the Employment-Population ratios for males, females and total 15-19 year olds since February 2008 (the month which coincided with the low-point unemployment rate of the last cycle).
You can interpret this graph as depicting the loss of employment relative to the underlying population of each cohort. We would expect (at least) that this ratio should be constant if not rising somewhat (depending on school participation rates).
The facts are that the absolute loss of jobs reported above is depicting a disastrous situation for our teenagers. Males, in particular, have lost out severely as a result of the economy being deliberately stifled by austerity policy positions.
In the last month, with the part-time employment situation improving, there has been some reversal in the downward trends in these ratios.
The male ratio has fallen by 10.3 percentage points since February 2008, the female ratio has fallen by 4.4 percentage points and the overall teenage employment-population ratio has fallen by 7.4 percentage points. That is a substantial decline in the employment market for Australian teenagers.
The other staggering statistic relating to the teenage labour market is the decline in the participation rate since the beginning of 2008 when it peaked in January at 61.4 per cent. In May 2016, the participation rate was just 54.2 per cent.
That is an additional 102.6 thousand teenagers who have dropped out of the labour force as a result of the weak conditions since the crisis.
If we added them back into the labour force the teenage unemployment rate would be 26.8 per cent rather than the official estimate for May 2016 of 17.2 per cent. Some may have decided to return to full-time education and abandoned their plans to work. But the data suggests the official unemployment rate is significantly understating the actual situation that teenagers face in the Australian labour market.
Overall, the performance of the teenage labour market remains poor. It doesn’t rate much priority in the policy debate, which is surprising given that this is our future workforce in an ageing population. Future productivity growth will determine whether the ageing population enjoys a higher standard of living than now or goes backwards.
I continue to recommend that the Australian government immediately announce a major public sector job creation program aimed at employing all the unemployed 15-19 year olds, who are not in full-time education or a credible apprenticeship program.
Unemployment increased by 1,600 to 726,400
TThe official unemployment rate remained steady at 5.7 per cent in May 2016.
Overall, the labour market still has significant excess capacity available in most areas and what growth there is is not making any major inroads into the idle pools of labour.
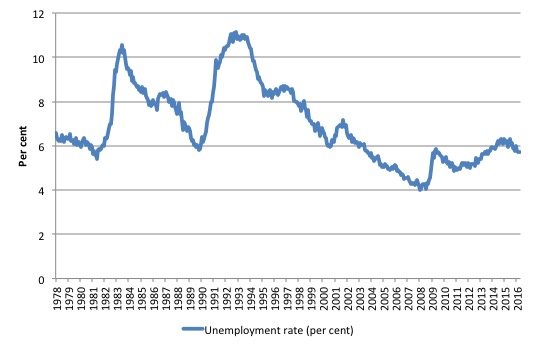
The following graph shows the national unemployment rate from February 1978 to May 2016. The longer time-series helps frame some perspective to what is happening at present.
After falling steadily as the fiscal stimulus pushed growth along, the unemployment rate slowly trended up for some months.
It is now above the peak that was reached just before the introduction of the fiscal stimulus. In other words, the gains that emerged in the recovery as a result of the fiscal stimulus in 2009-10 have now been lost.
Given the weak employment growth, the unemployment rate would be much higher if the labour force was growing as previous trend rates.
Broad labour underutilisation – upwards of 14.2 per cent
The ABS published its quarterly broad labour underutilisation measures for the May-quarter in this month’s data release.
In the May-quarter, total underemployment was 8.4 per cent (1,067.3 persons – up by 10.3 thousand since February) and the ABS broad labour underutilisation rate (the sum of unemployment and underemployment) was 14.2 per cent (up by 0.1 percentage points).
There were 1,067.3 thousand persons underemployed and a total of 1,793.7 thousand workers either unemployed or underemployed.
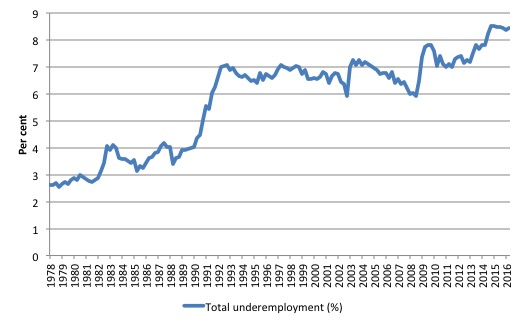
The following graph plots the history of underemployment in Australia since February 1978 to the February-quarter 2015.
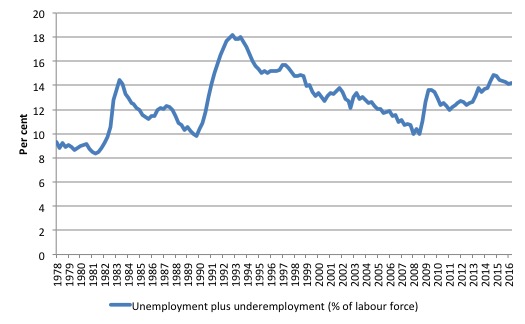
The next graph shows the evolution of the broad underutilisation rate over the same period. You can see the three cyclical peaks corresponding to the 1982, 1991 recessions and the more recent downturn.
Unemployment was a higher proportion of the two earlier peaks but underemployment now dominates the current cycle (just).
The other difference between now and the two earlier cycles is that the recovery triggered by the fiscal stimulus in 2008-09 did not persist and as soon as the ‘fiscal surplus’ fetish kicked in in 2012, things went backwards very quickly.
The two earlier peaks were sharp but steadily declined. The last peak fell away on the back of the stimulus but turned again when the stimulus was withdrawn.
If hidden unemployment (given the depressed participation rate) is added to the broad ABS figure the best-case (conservative) scenario would see a underutilisation rate well above 16 per cent at present. Please read my blog – Australian labour underutilisation rate is at least 13.4 per cent – for more discussion on this point.
The next update will be for the August-quarter 2016 and will be published published in the September 2016 Labour Force release.
Aggregate participation rate – stready 64.8 per cent and remains at depressed levels
The May 2016 participation rate remained steady at 64.8 per cent. It remains substantially down on the most recent peak in November 2010 of 65.8 per cent when the labour market was still recovering courtesy of the fiscal stimulus.
What would the unemployment rate be if the participation rate was at the last November 2010 peak level value?
The following graph tells us what would have happened if the participation rate had been constant over the period November 2010 to May 2016. The blue line is the official unemployment rate since its most recent low-point of 4 per cent in February 2008.
The red line starts at November 2010 (the peak participation month). It is computed by adding the workers that left the labour force as employment growth faltered (and the participation rate fell) back into the labour force and assuming they would have been unemployed. At present, this cohort is likely to comprise a component of the hidden unemployed (or discouraged workers).
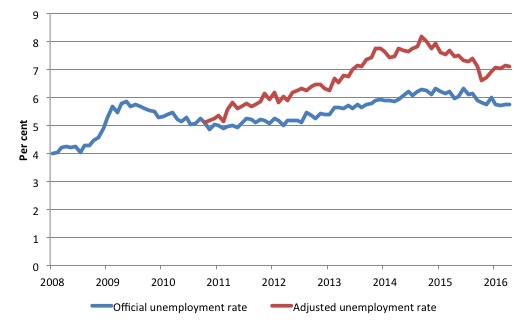
Total official unemployment in May 2016 was estimated to be 726.4 thousand. However, if participation had not have fallen relative to November 2010, there would be 911 thousand workers unemployed given growth in population and employment since November 2010.
The unemployment rate would now be 7.1 per cent if the participation had not fallen below its November 2010 peak of 65.8 per cent. The official unemployment in May 2016 was 5.7 per cent.
The difference between the two numbers mostly reflects, the change in hidden unemployment (discouraged workers) since November 2010. These workers would take a job immediately if offered one but have given up looking because there are not enough jobs and as a consequence the ABS classifies them as being Not in the Labour Force.
There has been some change in the age composition of the labour force (older workers with low participation rates becoming a higher proportion) but this only accounts for about a 1/3 of the shift. The rest is undoubtedly accounted for by the rise in hidden unemployment.
Note, the gap between the blue and red lines doesn’t sum to total hidden unemployment unless November 2010 was a full employment peak, which it clearly was not. The interpretation of the gap is that it shows the extra hidden unemployed since that time.
This gap shrinks as participation rises relative to the November 2010 peak.
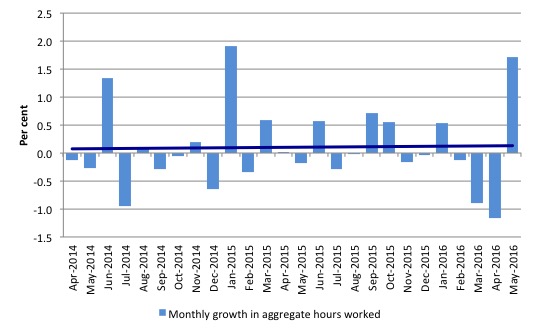
Hours worked – rose 1.7 per cent in May 2016
Aggregate monthly hours rose by 27.7 million hours (1.7 per cent) in May 2016 in seasonally adjusted terms after declining for three consecutive months.
The following graph shows the monthly growth (in per cent) over the last 24 months. The dark linear line is a simple regression trend of the monthly change – which depicts a close enough to zero trend
You can see the pattern of the change in working hours is also portrayed in the employment graph – zig-zagging across the zero growth line.
Conclusion
I repeat my monthly warning – we always have to be careful interpreting month to month movements given the way the Labour Force Survey is constructed and implemented.
Today’s figures show that while employment growth was just positive this month the pattern of growth continues to zig-zag across the zero growth line.
The full-time employment situation has clearly stagnated since the beginning of this year
Further, the growth in part-time work suggests that overall the quality of work in Australia declined in May 2016.
The conclusion remains that the overall demand side of the labour market is very weak.
Unemployment rose slightly this month but this is largely because the weak employment growth is interacting with weak labour force growth. If labour force growth was consistent with past trends, then the jobs shortfall would be much larger.
The teenage labour market remains in a poor state even though the 15-19 year olds enjoyed part-time employment growth.
I consider this situation to warrant immediate attention by the Federal Government. The neglect of our teenagers will have a very long memory indeed and the negative consequences will be stronger given the ageing population.
The Federal government appears incapable of addressing this dire issue.
The current election campaign is bogged down in arcane and mythical discussions about running out of money and not being able to defend the economy if there is another crisis.
Both major parties are constantly pretending they will be the best at “budget repair” (as if the fiscal balance is a car or something) even though the reality requires higher discretionary fiscal deficits at present.
All make believe, while the real world does head towards another major rift.
That is enough for today!
(c) Copyright 2016 William Mitchell. All Rights Reserved.
Dear Bill,
On a different matter there is an interesting article in Social Europe on Greece’s and Japan’s debt. I call it interesting because at no point the author – a former chairman of the FSA – makes clear that while Japan issues its own currency Greece does not. It is a terrible article.
2GB radio is one of the worst neo liberal transmitters around – A. Jones shouldnt be allowed to shovel nonsense into the Sydney masses.
What is worse in R.Greenwood who is meant to know something about economics sprouts utter garbage that will only have a detrimental effect of naive masses that listen.
How Is MMT going to counter neoliberalism ??
Is there an overall plan ???
Mark, fighting neo-liberalism is fighting big moneyed interests. Whole generations of economics students are programmed with nonsense as many are funded or depend on funding or a job by spouting neo-liberal nonsense. The only way is to tell people you know and keep spreading the word.
The Australian employment party has been started with a focus on MMT and educating people on MMT. Support them if you can or support whatever country you are in to do something similar it’s the only way. Unfortunately politics requires a lot of money these days and the mainstream media is owned by big moneyed interests. It’s going to have to be grassroots unless we can outspend them.
The more people you tell the better. I’ve opened many people’s eyes and they’re continuing to do the same so there is hope. The more people who read bill Mitchell’s amazing blog and work the better chance we can get to a critical threshold maybe within a generation hopefully. Either way climate change is going to cause something to give in a major way. Hopefully MMT can become mainstream and help us solve this huge problem! I try to have hope. There’s quite a few MMT Facebook groups too now spreading the word I recommend joining them to get into the discussion.
Jason, the Greens were given an MMT lecture in South Australia by Steven Hail, back when Hokey [sic] had the treasury portfolio.
It was promoted by the Greens. But Steven told me nothing came of it.
For me that is a black mark against them. They cannot say they are ignorant now, so they don’t represent any worthwhile benefit to Aust politics.
It shows spreading the word is an uphill task.
http://vimeo.com/117137212
If only Malcolm Turnbull could start an economic expansion in China like John Howard did back in 1997.
John,
I watched the presentation too and concluded the Greens present did not “get it”. I must say the presentation was not helped by the poor camera work whre slides were briefly displayed and the camera reverted far too quickly on Steve. The Greens are stuck on the “take money from others” concept as much as Labor is. They are weak on economics.
The Greens are weak on everything except laying the boot into the poor and unemployed.
John, I’m well aware of the video etc. I was initially with the Australian progressives who I thought would embrace MMT then watched how they just couldn’t “get it” and fall into the same trap as other leftists for the same reasons the left supports the failed Eurozone setup.
Anyway thankfully I’ve moved on and if you click on my name it’ll take you to the AEP website and they’re doing YouTube education on MMT etc and have a fairly simple policy platform based on MMT JG etc.
It seems to me that there is a world wide trend towards a casualisation of the work force or a fixed term form of work contract. The idea of creating permanent full-time jobs seems to be an anachronism. I put this down to a deterioration in union membership among various industries and particularly the service sector. Unless union membership increases, I predict a downturn in the creation of more full-time well paid jobs.
I have been a member of the Australian Employment party and have been spreading the word for the last year on facebook …the battle is ongoing.
I watched the above video, Steve’s presentation was excellent (particularly his comments on superannuation!) — but I’m not surprised there is a sense that the audience did not “get it”.
It is all very well starting out big and bold with the statement that the central government is not constrained in its spending. MMTers do this all the time. In many cases you never properly get to the “…but”. The “but” is the important bit: that it is prudentially constrained elsewhere, by the unused productive capacity of the economy. So being freed of worries about tax as revenue and debt accumulation, we are now apparently confronted
with the far trickier business of calculating (or agreeing on) output potential. Life used to be so easy: tax revenue as a constraint needs nothing more than an adding machine. Politicians, policy makers, and citizens will still have to thrash out allocation of scarce resources. So “money” is not a scarce resource (of the state), but everything else is…which is measured in money also? Are we getting anywhere here, practically speaking?
I know MMTers believe that bad policy is coming off the back of bad (economic) theory. What I see as an alternative at this point is bad policy coming from good theory (see Paul Samuelson quote at 58:15).
So how do things look when we all talk MMT? Are we talking about a complete revolution in the way politics, allocation of resources, taxation policy, etc. are determined? Which probably sounds like hard work to that audience. Or is it simply adopting a different viewpoint as to where the constraints really lie? WHich at the moment, for practical minded people (that audience), would be no significant difference at all.
The tax revenue constraint may be a fallacy but it is easy to understand. Are you to deny the average citizen one of the great democratic cudgels: “You are spending MY tax dollars!” “Not with MY tax dollars you don’t!” etc. Ok so it’s “wrong”. What is the alternative that keeps us disciplined? An MMT lecture won’t do it, I think most people get theory by looking at the practice of it.
I’d like to see MMT collaborate with other disciplines: political science, sociology, microeconomics. Out of that,
develop a modern monetary practice. Something practical minded people can engage with.
PS Re Jason H – The AEP site is very interesting and remarkably straightforward–we would be all better off if they got similar air-time as the Greens. If nothing else it could enliven the currently stale economic/policy debate in this country.
MMT is now being offered to study in Maastricht university of all places, the irony of the EU being founded there under the Maastricht treaty. https://www.maastrichtuniversity.nl/education/course/modern-monetary-theory-and-european-macroeconomics
So there is hope there might be at least a small number of new economics graduates coming out in the future. There is hope.
J W M I think you offer good feedback it’s something people get but its a hard battle to change the narrative on mass that’s why neo-liberalism is powerful.
The Greens probably do get it, but nobody has given a practical solution. As I think suggested by JWM a revolution will go nowhere.
A shotgun approach is not what is needed.
For me just try one thing at a time ie why do we let banks create money and the gov’t go into debt. The gov’t should be able to create money.
MMT needs to have a long term strategy and narrative. This is not up to Bill he is providing the vision.
All of us need to work harder or society will not have any where to go.
One brick at a time.
@JWM
You wrote:
“So ‘money’ is not a scarce resource (of the state), but everything else is…which is measured in money also? Are we getting anywhere here, practically speaking?”
If I understand you, you accept that MMT removes one constraint on government policy. It, however, leaves other constraints. What’s gained?
A longer answer is possible and I trust others shall provide it.
I’ll try a shorter more direct answer for an economist: One doesn’t need to be an expert on mathematical optimization to know that a constrained optimum cannot improve upon an unconstrained one. Either the constraint rules out the unconstrained optimum or it does not. If it does not rule out the optimum, then removal of the constraint shall have no effect, positive or negative; if it does rule out the optimum, removal of the constraint shall have a positive effect.
In English: at worst, MMT leaves you no worse than you already are and it may improve your situation. Isn’t that a gain?
OFC it gets you somewhere practically speaking, basically what Magpie is saying is:
IF right now your main bottleneck is financial/monetary, removing it will increase output. MMT shows that this constraint can be removed and then we will have to worry about the other REAL constraints.
The problem is assuming, as mainstreamers and politicians do, that out current constraints are REAL, and the financial constraints are just a byproduct of those real constraints, because under a retorted logic where Say’s law applies to real world and Ricardian equivalence is something this is what is happening and suddenly we will get (hyper)inflation while the output gap and unemployment is through the roof. Which is absolutely bonkers and bullshit.
What macro economists should be worried about is coming with better ways to measure output gaps and understand their “micro” structure, and better explanations of why, where and when inflation happens. Instead we are living in an imaginary world where our current constraints are due to real resources instead of imaginary (financial) constraints because all the fallacy of composition and false analogy going around in the minds of the people, a true collective disgrace.
JWM, Even in MMT the dollar is still the “taxpayers dollar” because the money gets it’s value due the fact that we must use it to pay our taxes.
This is not the understanding the term “taxpayers dollar” evokes but the use of the term is still valid and it is still a duty of every MP to understand and the monetary system and treat the “taxpayers dollar” with the greatest care.
People in a democracy need to develop some understanding of how the monetary system functions before they are able to judge party fiscal policy platforms sensibly. Politicians everywhere use this general lack of understanding of the monetary system to camouflage what would otherwise be viewed widely as unacceptable political reasons for fiscal choices. Putting lipstick on a pig so to speak.