Well my holiday is over. Not that I had one! This morning we submitted the…
Australia enters the deflation league of sorry nations
The smug Australian government – conservative to the core, dishonest on a daily basis, running a daily scare campaign that all that matters is the fiscal deficit and how our AAA rating from the (corrupt) rating agencies will be lost if we don’t record a fiscal surplus as soon as possible. It fails to mention that we have around 15 per cent (at least) of our willing labour resources not being utilised at present. It fails to mention that inequality and poverty is on the rise. And now, the Australian Bureau of Statistics has told us that this is a government that has finally plunged the nation into a deflationary spiral. We are now so obsessed with fiscal balances that do not matter that we ignore the things that actually impact on the well-being of the citizens. And now deflation has arrived. The Australian Bureau of Statistics released the Consumer Price Index, Australia – data for the March-quarter 2016 yesterday. The March-quarter inflation rate was negative (-0.2 per cent), which means Australia has now entered a deflationary period – a reflection of our poorly performing economy. The annual inflation rate is 1.3 per cent, which is well below the Reserve Bank of Australia’s lower target bound of 2 per cent. The RBA’s preferred core inflation measures – the Weighted Median and Trimmed Mean – are also now below the lower target bound and are trending sharply down. Various measures of inflationary expectations are also falling, quite sharply, including the longer-term, market-based forecasts. It is time for a change in policy direction although next week’s fiscal statement (aka ‘The Budget’) will likely just reinforce the current malaise. A sorry state.
The summary Consumer Price Index results for the March-quarter 2016 are as follows:
- The All Groups CPI fell by 0.2 per cent compared with a rise of 0.4 per cent in the December-quarter 2015.
- The All Groups CPI rose by 1.3 per cent over the 12 months to the March-quarter 2016, compared to the annualised rise of 1.5 per cent over the 12 months to December-quarter 2015.
- The Trimmed mean series rose by 0.2 per cent in the March-quarter 2016 (down from 0.6 per cent in the December-quarter 2015) and by 1.7 per cent over the previous year (down from 2.1 per cent for the 12 months to December-quarter 2015).
- The Weighted median series rose by 0.1 per cent in the March-quarter 2016 (down from 0.4 per cent in the December-quarter 2015) and by 1.4 per cent over the previous year (down from 1.9 per cent for the 12 months to the December-quarter 2015).
- The significant price rises this quarter were for secondary education (+4.6 per cent), medical and hospital services (+1.6 per cent) and pharmaceutical products (+4.8 per cent).
- The most significant offsetting price falls this quarter were for automotive fuel (-10.0 per cent), fruit (-11.1 per cent) and international holiday travel and accommodation (-2.0 per cent).
The pressure is now on the RBA to reduce interest rates given that their preferred measures (see below) are now well below their targetting range (2 to 3 per cent).
The RBA might drop rates though if interprets yesterday’s inflation data to be a further sign that the economy is in trouble.
But then the RBA has little scope to influence total spending anyway. I dealt with that issue in this blog – Monetary policy is largely ineffective – which detailed why fiscal policy is a superior set of spending and taxation tools through which a national government can influence variations in activity in the real economy.
What is apparent from yesterday’s inflation figures and the most recent labour market data (see blog – Australian labour market – still weak with a moderate upturn – is that there is plenty of room for further fiscal stimulus.
How to align that reality with the political narratives from both sides of politics which is running the exact opposite line.
Next week (Tuesday, the Federal government will bring down the fiscal statement (aka ‘The Budget’) for 2016-17 and the public discussion leading up to that event has been asinine to a degree that is almost unimaginable. It gets worse every year.
Even the more sensible media commentators have fallen into the ‘deficit hysteria’. For example, the Fairfax economics editor Peter Martin wrote in his article (April 26, 2016) – Federal budget 2016: Deficit $21b worse, despite iron ore rise, says Deloitte – that:
The government’s budget position has deteriorated $21 billion in the past four months, despite the resurgent iron ore price, a new analysis has found …
And then the journalist proceeded to act as the media spokesperson for the company who makes profits out of their regular warnings of doom (Access Economics).
First, the role of the media (particularly analytical pieces) is not to just rehearse the statements of a known neo-liberal organisation that has an appalling record in its fiscal predictions.
Please read my blog – A Budget that reduces growth and increases joblessness – for no sound reason – for more discussion on this point.
Second, the journalist did not seek alternative opinion, which is a damning statement of the biased reported.
Third, the only alternative voice presented was the Opposition Labor Treasury spokesperson, who embarassed himself, once again, by attacking the Government for not having “a better result than this” – meaning they should have been running a smaller fiscal deficit – just like the fatuous Labor Party aspires to.
And this is one of the more reasonable articles – if you can believe that.
Why is a rising fiscal deficit a “deterioration”? Why isn’t the deterioration expressed in terms of a significantly declining real GDP growth rate, the persistently elevated levels of labour underutilisation, the rising income inequality and poverty rates, and now the beginnings of a deflationary spiral?
The fiscal balance is just a reflection of the state of the real economy and the fact that it is higher than expected just reflects the damage that the restrictive fiscal policy (the pursuit of surplus) is doing.
The ‘unexpected’ rise in the likely fiscal deficit over the next two years is a statement in itself.
In my forecasts as part of this year’s Fairfax Annual Economic Survey panel, I forecast the fiscal deficit to rise this year (2015-16) to $A45 billion (after the government had forecast it to come in at $A37.4 billion. I also forecast a rise to $A50 billion next fiscal year (2016-17), while the government forecast was $A33.7 billion.
Those forecasts are certainly in the right direction and reflect my assessment of how poorly the economy is performing.
The rising deficits are ‘good’ in the sense they are helping to support aggregate spending in an economy where private investment expenditure is declining rapidly and households are becoming (understandably) more cautious.
What a reasonable commentary would have said is that there is no such thing as a ‘deteriorating’ fiscal balance. It is what it is. The question is why it is changing and what we assess to be the quality of those factors that are driving these changes.
The media is resolutely silent on those sorts of understandings.
Anyway, the newly recorded deflation for the March-quarter 2016 is one part of the sorry story that political incompetence is generating in this nation.
Far from being a nation of free souls, we are, in reality, a collective of idiots – running headlong towards the cliff!
Trends in inflation
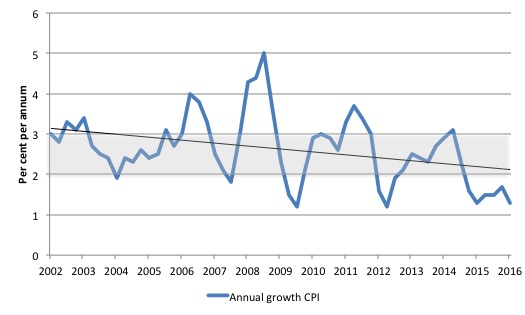
The headline inflation rate decreased by 0.2 per cent in the March-quarter 2016 translating into an annualised increase of 1.3 per cent, down from 1.7 per cent in the December-quarter 2015.
It is the first time that the inflation rate has been negative since the December-quarter 2008, when the GFC was threatening to engulf us and thanks to the significant fiscal stimulus did not.
The following graph shows the annual headline inflation rate since the first-quarter 2002. The black line is a simple regression trend line depicting the general tendency. The shaded area is the RBA’s so-called targetting range (but read below for an interpretation).
The trend inflation rate is quite steeply heading downwards.
Implications for monetary policy
What does it mean for monetary policy?
The Consumer Price Index (CPI) is designed to reflect a broad basket of goods and services (the ‘regimen’) which are representative of the cost of living. You can learn more about the CPI regimen HERE.
Please read my blog – Australian inflation trending down – lower oil prices and subdued economy – for a detailed discussion about the use of the headline rate of inflation and other analytical inflation measures.
Is a headline rate of CPI at -0.2 per cent for the March-quarter 2016 significant for monetary policy decisions? To examine its lasting significance we have to dig deeper and sort out underlying structural inflation pressures and ephemeral price factors.
The RBA’s formal inflation targeting rule aims to keep annual inflation rate (measured by the consumer price index) between 2 and 3 per cent over the medium term. Their so-called ‘forward-looking’ agenda is not clear – what time period etc – so it is difficult to be precise in relating the ABS data to the RBA thinking.
What we do know is that they do not rely on the ‘headline’ inflation rate. Instead, they use two measures of underlying inflation which attempt to net out the most volatile price movements. How much of today’s estimates are driven by volatility?
To understand the difference between the headline rate and other non-volatile measures of inflation, you might like to read the March 2010 RBA Bulletin which contains an interesting article – Measures of Underlying Inflation. That article explains the different inflation measures the RBA considers and the logic behind them.
The concept of underlying inflation is an attempt to separate the trend (“the persistent component of inflation) from the short-term fluctuations in prices. The main source of short-term ‘noise’ comes from “fluctuations in commodity markets and agricultural conditions, policy changes, or seasonal or infrequent price resetting”.
The RBA uses several different measures of underlying inflation which are generally categorised as ‘exclusion-based measures’ and ‘trimmed-mean measures’.
So, you can exclude “a particular set of volatile items – namely fruit, vegetables and automotive fuel” to get a better picture of the “persistent inflation pressures in the economy”. The main weaknesses with this method is that there can be “large temporary movements in components of the CPI that are not excluded” and volatile components can still be trending up (as in energy prices) or down.
The alternative trimmed-mean measures are popular among central bankers.
The authors say:
The trimmed-mean rate of inflation is defined as the average rate of inflation after “trimming” away a certain percentage of the distribution of price changes at both ends of that distribution. These measures are calculated by ordering the seasonally adjusted price changes for all CPI components in any period from lowest to highest, trimming away those that lie at the two outer edges of the distribution of price changes for that period, and then calculating an average inflation rate from the remaining set of price changes.
So you get some measure of central tendency not by exclusion but by giving lower weighting to volatile elements. Two trimmed measures are used by the RBA: (a) “the 15 per cent trimmed mean (which trims away the 15 per cent of items with both the smallest and largest price changes)”; and (b) “the weighted median (which is the price change at the 50th percentile by weight of the distribution of price changes)”.
Please read my blog – Australian inflation trending down – lower oil prices and subdued economy – for a more detailed discussion.
So what has been happening with these different measures?
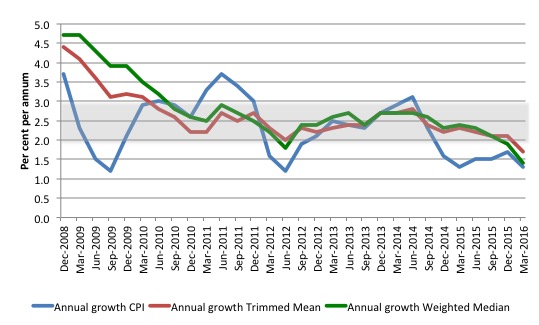
The following graph shows the three main inflation series published by the ABS since the December-quarter 2008 – the annual percentage change in the all items CPI (blue line); the annual changes in the weighted median (green line) and the trimmed mean (red line). The RBAs inflation targetting band is 2 to 3 per cent (shaded area).
The data is seasonally-adjusted.
The CPI measure of inflation (falling to 1.3 per cent) is now well below the target band, while the RBAs preferred measures – the Trimmed Mean (1.7 per cent down from 2.1 per cent) and the Weighted Median (1.4 per cent down from 1.9 per cent) – are both also well below the lower bound of the RBAs targetting range of 2 to 3 per cent.
How to we assess these results?
First, there is clearly a downward trend in all of the measures. The “core” measures used by the RBA have been benign for many quarters even with a relatively large fiscal deficit and record low interest rates. They are now trending down sharply.
Second, it is clear that the RBA-preferred measures are well below the lowest inflation-targeting band rate of 2 per cent.
The RBA will also be mindful that real GDP growth is well below trend and faltering and the labour market is weak and getting weaker.
In terms of their legislative obligations to maintain full employment and price stability, one would think the RBA would have to cut interest rates in the coming month given the failing economy and the benign inflation environment.
The RBA has little excuse but to cut now that all three measures are below the targetting range and deflation has arrived.
What is driving inflation in Australia?
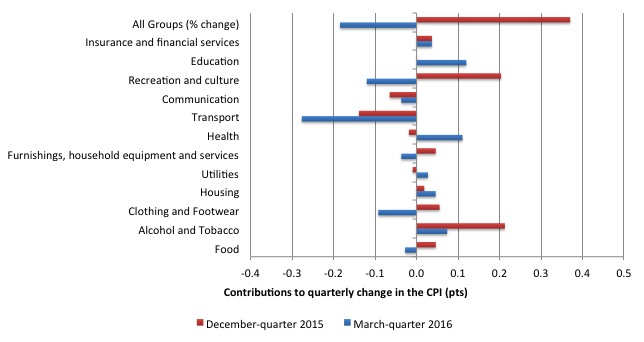
The following bar chart compares the contributions to the quarterly change in the CPI for the March-quarter 2016 (blue bars) compared to the December-quarter 2015 (red bars).
The ABS say that:
The most significant price falls this quarter are automotive fuel (-10.0%), fruit (-11.1%) and international holiday travel and accommodation (-2.0%).
The most significant offsetting price rises this quarter are secondary education (+4.6%), medical and hospital services (+1.6%) and pharmaceutical products (+4.8%).
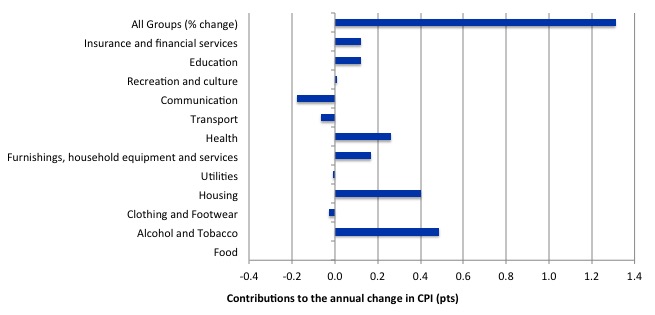
The next bar chart provides shows the contributions in points to the annual inflation rate by the various components.
In the twelve months to March 2016, the major drivers of inflation were Health, Housing, and Alcohol and Tobacco Prices, and, to a lesser extent, Insurance and Financial Services and Education. The tobacco and health price rises largely reflect government policy changes.
Inflation and Expected Inflation
The fear of inflation, in part, drives the misplaced faith in monetary policy over fiscal policy.
If we went back to 2009 and examined all of the commentary from the so-called experts we would find an overwhelming emphasis on the so-called inflation risk arising from the fiscal stimulus. The predictions of rising inflation and interest rates dominated the policy discussions.
The fact is that there was no basis for those predictions in 2009 and seven years later inflation is turning into deflation despite the rising estimates of the fiscal deficit.
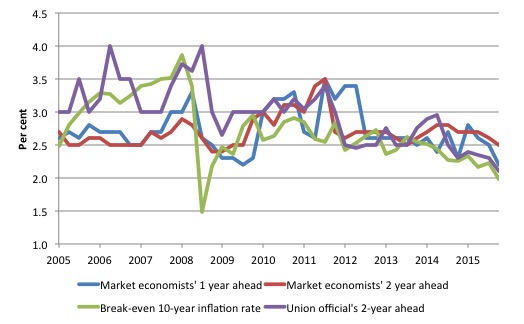
The following graph shows four measures of expected inflation expectations produced by the RBA – Inflation Expectations – G3 – from the June-quarter 2005 to the March-quarter 2016.
The four measures are:
1. Market economists’ inflation expectations – 1-year ahead.
2. Market economists’ inflation expectations – 2-year ahead – so what they think inflation will be in 2 years time.
3. Break-even 10-year inflation rate – The average annual inflation rate implied by the difference between 10-year nominal bond yield and 10-year inflation indexed bond yield. This is a measure of the market sentiment to inflation risk.
4. Union officials’ inflation expectations – 2-year ahead.
Notwithstanding the systematic errors in the forecasts, the price expectations (as measured by these series) are trending down in Australia, which will influence a host of other nominal aggregates such as wage demands and price margins.
The market economists’ two-year ahead is well above the Break-even 10-year inflation rate while the Union officials seem to have a more realistic outlook.
This is no surprise as the ‘market economists’ systematically get movements in the economy wrong and one wonders if their organisations actually bet money on their analysis!
The most reliable measure – the Break-even 10-year inflation rate – is at the lower bound of the RBA targetting range.
The expectations are still lagging behind the actual inflation rate, which means that forecasters progressively catch up to their previous forecast errors rather than instantaneously adjust, a further piece of evidence that refutes the mainstream economics hypothesis that we have ‘rational expectations’ (that is, on average get it right).
Conclusion
Just before the GFC hit all the macroeconomic policy talk in Australia was about getting deficits down and into surplus to ensure that inflation didn’t accelerate.
It was nonsensical talk even then when growth was stronger and unemployment lower.
The doomsayers were completely wrong when they predicted the fiscal stimulus in 2008-09 would generate dangerous inflation impulses.
The trend has been down for some years now and some nations are fighting deflation rather than inflation.
Australia has now joined the deflationary brigade of sorry nations that have incompetent government dominated by neo-liberal Groupthink.
Something has to give in the policy debate which remain dominated by a supposed urgent need to record fiscal surpluses.
We should be thankful that the fiscal deficits are actually rising (through the automatic stabilisers). The real economy – where peoples’ lives depend – would be in worse shape than it currently is if the politicians actually succeeded in carrying out their desires to reduce the fiscal balance.
Note for the next two weeks
I am travelling to Europe next week – see below – and I have a very heavy schedule of commitments to honour. The blog may be quite unreliable in that time and at times non-existent.
The commitments below begin next Thursday, May 5, 2016, but I have other (non-public) commitments in Europe from Monday, May 5, 2016 which will also take up time and keep me away from my desk.
We will see. I will try to report on the daily activities in Spain though.
Upcoming Spanish Speaking Tour and Book Presentations – May 5-13, 2016
Here are the details of my upcoming Spanish speaking tour which will coincide with the release of the Spanish translation of my my current book – Eurozone Dystopia: Groupthink and Denial on a Grand Scale (published in English May 2015).
You can purchase the Spanish version of the book – La Distopía del Euro – for 27.54 euros from Amazon.
You can save the flyer below to keep the details handy if you are interested. All events are open to the public who are encouraged to attend.
FINALLY – Introductory Modern Monetary Theory (MMT) Textbook
The KINDLE edition is now out – Details – or through the relevant Kindle store for your currency (you can search for the relevant link).
We have now published the first version of our MMT textbook – Modern Monetary Theory and Practice: an Introductory Text (March 10, 2016).
The long-awaited book is authored by myself, Randy Wray and Martin Watts.
It is available for purchase at:
1. Amazon.com (60 US dollars)
2. Amazon.co.uk (£42.00)
3. Amazon Europe Portal (€58.85)
4. Create Space Portal (60 US dollars)
By way of explanation, this edition contains 15 Chapters and is designed as an introductory textbook for university-level macroeconomics students.
It is based on the principles of Modern Monetary Theory (MMT) and includes the following detailed chapters:
Chapter 1: Introduction
Chapter 2: How to Think and Do Macroeconomics
Chapter 3: A Brief Overview of the Economic History and the Rise of Capitalism
Chapter 4: The System of National Income and Product Accounts
Chapter 5: Sectoral Accounting and the Flow of Funds
Chapter 6: Introduction to Sovereign Currency: The Government and its Money
Chapter 7: The Real Expenditure Model
Chapter 8: Introduction to Aggregate Supply
Chapter 9: Labour Market Concepts and Measurement
Chapter 10: Money and Banking
Chapter 11: Unemployment and Inflation
Chapter 12: Full Employment Policy
Chapter 13: Introduction to Monetary and Fiscal Policy Operations
Chapter 14: Fiscal Policy in Sovereign nations
Chapter 15: Monetary Policy in Sovereign Nations
It is intended as an introductory course in macroeconomics and the narrative is accessible to students of all backgrounds. All mathematical and advanced material appears in separate Appendices.
A Kindle version will be available soon (stay tuned for the announcement).
Note 1: There is a typographical mistake in the book which although not repeated might throw your understanding. This has been corrected in a revised edition which is now being sold.
In editions sold before April 19, 2016, the following errors occur:
On Page 138, Equation 7.15a is written as
(7.15) Y = E = A + [c(1-t) – m]Y
and solving for Y is then stated to give
(7.16) Y[1 – c(1-t) – m] = A
however this should instead read Y[1 – c(1-t) + m] = A.
Thanks to Brian S. for picking this up.
Note 2: We are soon to finalise a sister edition, which will cover both the introductory and intermediate years of university-level macroeconomics (first and second years of study).
The sister edition will contain an additional 10 Chapters and include a lot more advanced material as well as the same material presented in this Introductory text.
We expect the expanded version to be available around June or July 2016.
So when considering whether you want to purchase this book you might want to consider how much knowledge you desire. The current book, released today, covers a very detailed introductory macroeconomics course based on MMT.
It will provide a very thorough grounding for anyone who desires a comprehensive introduction to the field of study.
The next expanded edition will introduce advanced topics and more detailed analysis of the topics already presented in the introductory book.
That is enough for today!
(c) Copyright 2016 William Mitchell. All Rights Reserved.

Bill,
1. I have just yesterday received my textbook and scanning page 138 the equation appears corrected as you have written above except that it is equation 7.15b, not 7.16. (equations 7.16 are the expenditure multiplier).
2. Wouldn’t it be possible for Mr Morrison to reduce the budget deficit *and* increase inflation (thereby saving us from this deflation – which no doubt was Labor’s fault) simply by upping the GST?
I’m not suggesting it would be a good move, but it did cross my mind that it would an “in character” move for Scotty. Not sure of how they’d spin it for the election 🙂
@Cambowambo,
“Wouldn’t it be possible for Mr Morrison to reduce the budget deficit *and* increase inflation (thereby saving us from this deflation – which no doubt was Labor’s fault) simply by upping the GST?
You should try some of Bill’s weekend quizzes. You’d then start to understand that the government’s deficit cannot be reduced simply by increasing taxes and reducing spending.
If the government really wanted to reduce its deficit it would have to discourage everyone else saving. That would include our overseas trading partners who sell to Australia more than they buy from Australia and save the difference.
The way to do that would be to keep interest rates low and engineer some inflation into the system – by increasing government spending and reducing taxation. So, perhaps counter intuitively, the way to reduce the government’s deficit in the longer term is for it to spend more and tax less in the shorter term.
petermartin2001. How right you are, and question 1 on today’s (Firday’s) quiz deals with this very matter.
Bill, I agree that with inflation low or negative and unemployment high we need much more stimulus. What bothers me however is the discordant feature of inflated house prices and inflated rents. How can we stimulate overall aggregate demand and take pressure out of real estate at the same time? This bothers me as a practical question. Clearly, we are in this odd position of low overall CPI with an over-valued housing market due to much bad policy in the past. But how do we progressively correct it now? What are the real, practical policies which would achieve this?
Is it supposed to be confusing to the lay person about whether we’re in deflation or inflation? If the CPI has been altered in the last 35 years to not accurately represent the economy, are prices rising to back up the CPI or why are prices rising? Bills and the cost of living has risen dramatically, the price of a Big Mac has increased from $5.50 in February to $7.40 in June 2016. Yet there’s now an oversupply of housing, stagnant wages and companies and government cut costs by closing stores and laying off workers. Especially in hindsight people would be able to see the true economic situation as well as what was recorded. The Liberal party sell their policies by telling people they will solve the very scary fiscal deficit but they don’t. I can’t believe they won the last election.