Well my holiday is over. Not that I had one! This morning we submitted the…
Australia is caught in a cyclical malaise – there is nothing ‘new normal’ about it
There was another article in the financial media this weekend running the hypothesis that the stagnant economic conditions that Australia has found itself in is a “new normal”. This is now a repeating theme. I disagree with it. It ignores some basic realities and is ideologically loaded towards an austerity interpretation of the world. The article in the Fairfax press (May 21, 2016) – Low pay growth, price rises and the new normal – claims that the “central question in macro-economics today” is whether we are “waiting … for the economy to get back to normal, or has the economy shifted to a “new normal?”. I would pose the question differently. Waiting implies that we think it is just a matter of time before the ‘market’ does its work and restores normality. Moreover, Australia like most of the rest of the world remains locked in the aftermath of what we call a ‘balance sheet’ recession. As I explained to various audiences in Spain during my recent visit, this type of event is unusual (atypical or abnormal) and requires a quite different policy response to a normal V-shaped recession where private investment spending falls, governments stimulate, confidence returns and growth gets back fairly quickly on its trend path. The losses might be large but the recession and aftermath are short. A balance sheet recession requires elevated levels of fiscal deficits being maintained for many years to support growth as non-government sector spending remains below the norm while it reduces its debt levels (via increased saving). The problem in Australia, like elsewhere, is that governments have been hectored by neo-liberal ideologues to prematurely withdraw or reduce the fiscal support and growth has stalled. A range of problems then follow.
For background, please read the following blogs:
1. Balance sheet recessions and democracy.
2. The government has all the tools it needs, anytime, to resist recession.
3. Currency-issuing governments have unlimited financial resources to fight recession.
We are in the early weeks of an unduly long federal election campaign in Australia at present.
It is a curious period because the usual banter from the conservatives (and the Labor Party) that the federal government’s deficit is about to bring the nation to financial collapse has to be massaged a little differently because the main political parties also have to make some big ‘attractive’ spending announcements.
Watching how these characters try to maintain any semblance of credibility (read: consistency – they lost credibility a long time ago) is rather hilarious.
This New Daily article is the best commentary in the mainstream press so far – Turnbull hands Labor means to re-inflate the economy.
The article is not perfect but the message is clear – this is an extended cyclical downturn that the economy is experiencing and needs an major spending boost. With the “nation burdened with record levels of private debt …” then “negative GDP growth and falling prices … push up the real value of all debts”.
Cure?:
Australia badly needs to get aggregate demand back up to levels that will push inflation well into the 2 to 3 per cent band that the RBA sees as optimal.
… that restore wages growth and consumer confidence …
That sounds like a sensible input to the public debate. Unfortunately, the New Daily is a fringe national publication and the rubbish pumped out in the large media outlets like the Fairfax press dominates the public information sources.
The Fairfax article mentioned in the introduction (from its chief economist) says that the main macroeconomics question can be posed in economics terminology as such:
To put that question in econospeak, are the changes we see before us “cyclical” – just part of the normal ups and downs of the business cycle – or are they “structural”, a lasting change in the way the economy works.
The journalist concludes that “Trouble is, neither I nor anyone else can say with confidence what the answer is.”
I beg to disagree. The malaise that the Australian economy is stuck in is very much to do with the recovery phase of the last cycle which is being abnormally suppressed by the refusal by the Federal government to offset the moderation in non-government spending.
The facts are:
1. Inflation is well below the central bank’s lower targetting threshold (2 per cent) and last quarter was negative.
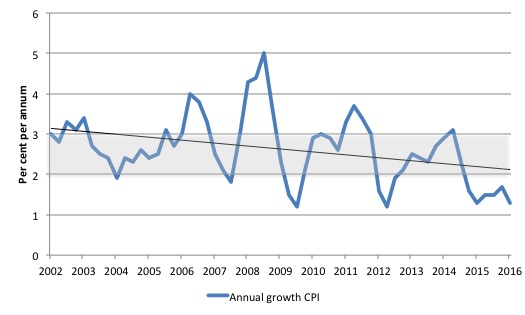
The headline inflation rate decreased by 0.2 per cent in the March-quarter 2016 translating into an annualised increase of 1.3 per cent.
The following graph shows the annual headline inflation rate since the first-quarter 2002. The black line is a simple regression trend line depicting the general tendency. The shaded area is the RBA’s so-called targetting range (but read below for an interpretation).
The trend inflation rate is quite steeply heading downwards.
Please read my blog – Australia enters the deflation league of sorry nations – for more discussion on this point.
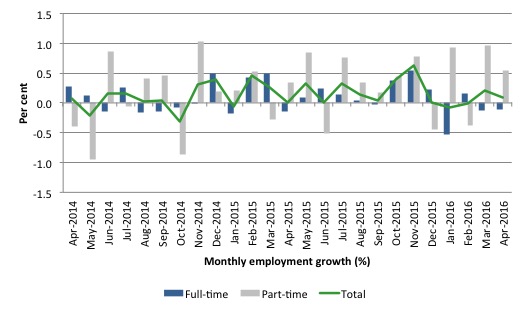
2. The labour market is stuck in a low employment growth, flat working hours state where the broad labour underutilisation rate (combination of official unemployment and underemployment) is around 14.6 per cent and that excludes the suppressed participation rate which adds at least another 2 per cent to that figure.
The following graph shows the month by month growth in full-time (blue columns), part-time (grey columns) and total employment (green line) for the 24 months to April 2016 using seasonally adjusted data. It gives you a good impression of just how flat employment growth has been over the last 2 years.
Please read my blog – Australian labour market – continues to languish – for more discussion on this point.
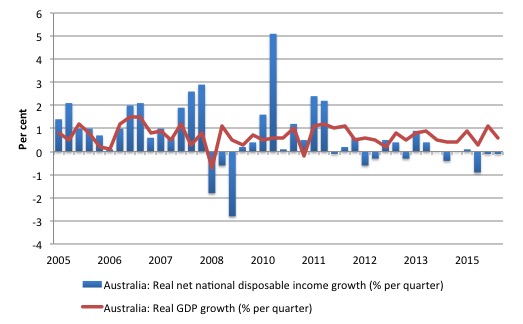
3. Real GDP growth remains well below its trend rate (before the GFC) and is being propped up by the on-going government deficits. Australia is in an income recession given that Real net national disposable income fell by 1.1 per cent over the year to December 2015 (the most recent data).
Real net national disposable income per capita has shown positive growth in only one of the last seven quarters. In other words, Australians are poorer in income terms that they were at the beginning of 2014.
The following graph shows the evolution of the quarterly growth rates for the two series since the March-quarter 2005. You can see the divergence between real growth in output (and income that is generated by the economy) and the real net national disposable income (the real income Australians get) over the last few years.
So while the economy was pumping out mining exports at increasing volumes, Australian households were going backwards in real income terms.
The decline in real income has intensified as the mining contribution to real output growth has declined. This subdued state is the result of the declining export prices manifesting in the significant decline over the last 12 months in Australia’s terms of trade and the flat wages situation.
In other words, our capacity (in real terms) to purchase imports has declined per unit of export and Australian workers are not sharing in productivity growth.
It means that Australians overall are poorer even though we are still producing more than 12 months ago.
Please read my blog – Australian national accounts – we are becoming poorer – for more discussion on this point.
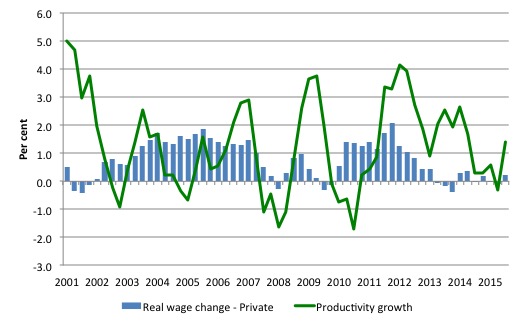
4. The growth in the Wage Price Index released last week was the lowest on record and real wages have barely moved over the last year and remain well below productivity growth (meaning labour’s share in national income has fallen and the profit share had risen).
The following graph shows the annualised real wages growth since the March-quarter 2001 (blue bars) and hourly labour productivity growth up to the March-quarter 2016.
Quite clearly, wages growth is being suppressed.
Please read the ABS press release – Slow wage growth continues in 2016 – for more discussion on this point.
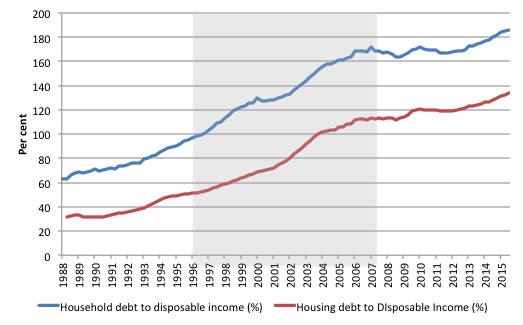
5. Australian households are currently carrying record levels of debt (mostly mortgage related) – 186 per cent of disposable income, with interest payments as a percent of disposable income standing at 8.7 per cent.
The latter fact means that the central bank has limited capacity to raise interest rates – any significant movement in rates would trigger a raft of personal insolvencies that would further dent non-government spending.
The following graph shows total household debt as a percentage of disposable income since 1988 to December-quarter 2015 (latest data). The blue line is total and the red housing mortgage debt.
The shaded area is the 10 out of 11 years of fiscal surpluses that the last conservative government recorded – all on the back of the growth driven by the unsustainable private credit binge. Hardly a ‘new normal’.
The credit binge was stark and in two decades pushed the ratio up from an historically steady 40-45 per cent to a peak of 152.9 in the September-quarter 2006.
At that point, the balance sheets of the households holding this debt became very precarious and the rising unemployment and falling economic growth that followed threatened major debt delinquencies.
Since the onset of the crisis and the rise in unemployment, there was a flattening out of ratio as the fiscal stimulus in 2008 supported growth.
However, with a slowdown in household disposable income growth and the withdrawal of the fiscal stimulus, the ratio has risen to now record levels.
Please read my blog – Non-government debt lessons are not being learned – for more discussion on this point.
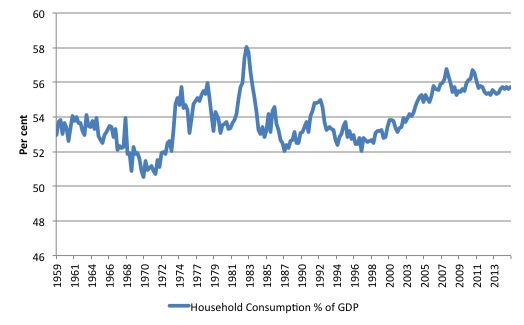
6. The record household debt, the persistently high unemployment, and flat wages growth has reduced household consumption as a ratio of GDP.
Households are now saving more as a per cent of disposable income (currently around 10 per cent) after a few years of negative saving ratios (during the credit binge).
The rising share of consumption in total national expenditure has now stabilised around 56 per cent (falling a little from the recent peaks in 2007 of 57 per cent) as households restrain their spending growth.
The following graph shows the share of household consumption in total expenditure since the September-quarter 1959 to the December-quarter 2015.
The government will not be able to rely on another surge in consumption spending any time soon.
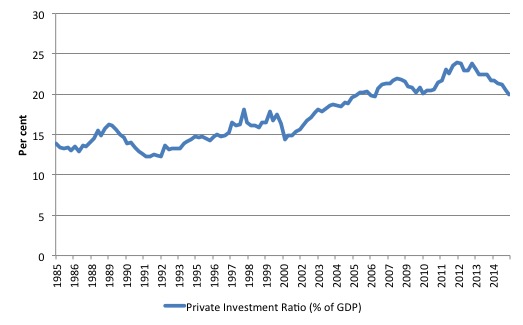
7. Private capital formation in Australia (investment spending) is in retreat following the boom associated with the record terms of trade (the so-called ‘mining boom’). The peak investment to GDP ratio was 23.9 per cent in the June-quarter 2012. It had dropped to 19.9 per cent in the December-quarter 2015 (latest data) and will be lower again when the first-quarter 2016 data comes out in a few weeks.
The following graph shows the investment ratio (share of private capital formation in total expenditure) since the September-quarter 1959 to the December-quarter 2015.
It is now in decline after the booming years of associated with the record terms of trade (driven by China’s growth). Non-mining investment has been in decline for some time now and the mining component of the total has largely dried up.
The outlook is also bleak. Surveys of Australian firms indicate they plan further cuts in investment spending over the next 12 months.
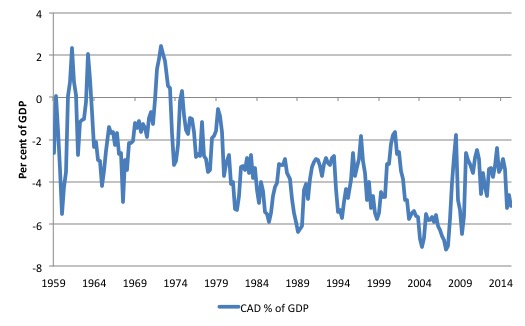
8. The external sector in Australia in net terms drains growth – given the on-going current account deficit of around 4.5 to 5 per cent of GDP.
The following graph shows the history of the current account (as a % of GDP) since the September-quarter 1959 to the December-quarter 2015.
The hopes that the ‘mining boom’ would push our external sector into surplus – and thus generate an exogenous growth source – were never likely to be realised. Even the trade balance (net of the income transfers component of the current account) are negative (currently -2.4 per cent of GDP).
Please read my blog – Australian national accounts – we are becoming poorer – for more discussion on this point.
All this amounts to an increasing output gap
All this evidence supports the obvious argument (when in doubt look for the obvious) – that Australia has a large cyclical output gap caused by suppressed spending relative to potential output.
I updated my estimates of the output gap over the last few days and the technical details are contained in this blog – Australia output gap – not close to full capacity.
What are output gaps? The output gap is usually defined as the difference between actual and potential real GDP, expressed as a percentage of potential output. Many agencies publish estimates of output gaps for their countries. For example, the – US Congressional Budget Office (CBO) regularly puts out estimates of the GDP and unemployment gaps as part of their exercise in decomposing the federal budget outcome into cyclical (automatic stabilisers) and structural components.
The IMF World Economic Indicators and the OECD Economic Outlook publications, also publish multi-country estimates of the annual output gaps.
As I note in this blog – Structural deficits and automatic stabilisers – the problem is that the estimates of output gaps are extremely sensitive to the methodology employed.
They rely on an estimate of potential GDP, which is non-observable. It is clear that the typical methods used to estimate potential GDP reflect ideological conceptions of the macroeconomy, which are problematic when confronted with the empirical reality.
The CBO, for example, despite saying that their estimate of Potential GDP is “the level of output that corresponds to a high level of resource … labor and capital … use”, actually define the potential as that level of GDP where the unemployment rate equals some estimated (unobservable) NAIRU.
Intrinsic to the computation is an estimate of the so-called ‘natural rate of unemployment’ or the Non Accelerating Inflation Rate of Unemployment. This is the mainstream version of ‘full employment’ but is, in fact, an unemployment rate which is consistent with a stable rate of inflation. Please read my blog – The dreaded NAIRU is still about! – for more discussion on why the NAIRU is a flawed concept that should not be used for policy purposes.
Given the history of estimates of the NAIRU, the “steady-state” unemployment could be as high as 8 per cent or as low as 3 per cent. The former estimate would hardly be considered “”high rate of resource use”. Similarly, underemployment is not factored into these estimates.
In our 2008 book – Full Employment abandoned we provide an extensive critique of the NAIRU concept. You can also read an earlier working paper I wrote – The unemployed cannot find jobs that are not there! which documents the problems that are encountered when relying on the rubbery NAIRU concept for policy advice.
The point is that the typical mainstream estimates the output gap usually understate the degree of slack in the economy, which then means that policy makers are biased towards adopting an excessively austere fiscal policy approach.
This also leads them to claim the economy is operating at near or at full employment, when in reality, the broad labour underutilisation indicators might be signalling massive wastage.
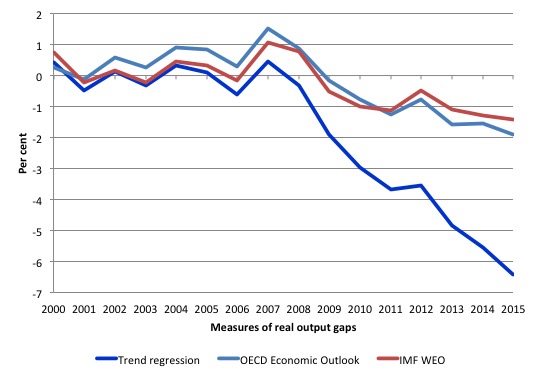
The next graph shows the estimates of the Australian output gap produced by the IMF and the OECD for the period 2000 to 2015. It also includes my own estimates (explained HERE), which are based on a log-linear regression (estimated for the period 2000Q1 to 2007Q4) and then forecast out from the first-quarter 2008 to the December-quarter 2015.
My own method is fairly standard and the results This model is entirely plausible and fits well with other data indicators that are available (some of which I have provided above).
The gap between real GDP and the estimated trend GDP is not strictly an output gap because that would require the additional assumption that trend growth always defines the potential growth of the economy. An economy may be held in a state of austerity for years (as we are seeing in Europe at present) and its trend will be much lower than its potential – given that tens of thousands to millions of people might be persistently unemployed or underemployed.
So we should more accurately call the gap between real GDP and trend GDP to be an incremental output gap because it does not presume that the trend output upon which the forecast was based coincided with potential output or full employment.
In other words, the incremental output gap depicts the increase in whatever gap existed at the time the forecast began (March-quarter 2008).
The graph shows that the OECD estimated that in 2015 the output gap was 1.9 per cent of potential and rising, while the IMFs estimate was 1.4 per cent of potential and rising.
The conclusion is that neither the OECD nor the IMF think that Australia is operating at capacity at present.
In other words, both organisations acknowledge that Australia remains in a cyclical state of under full employment.
My own estimates that are free from the NAIRU-bias (but not entirely without problems) suggest the output gap is around 6.4 per cent.
Calibrating that against the current performance of the Australian economy summarised above would suggest that my estimates are closer to the truth than the estimates of the IMF or the OECD.
But the truth lies between our estimates somewhere.
Irrespective of exactly where the output gap is it is clear that Australia remains caught up in a cyclical event. It still looks very much like the weak aftermath of a balance sheet recession to me.
In attempting to offer his readers an explanation as to why wages growth is weak, the best the Fairfax article can offer is to report on some recent research that says that wages growth is being suppressed by labour underutilisation (where the researcher includes underemployment in the broader measure).
I should note that in some 2004 research, I examined how the changing labour market impacted on the inflation generating process.
First, the standard Phillips curve model predicts that the official unemployment rate (a proxy for excess demand) impacts negatively on wage inflation. I found that in the sample tested (February 1978 to September 2004), the unemployment rate in a typical Phillips curve model exerted a statistically-significant negative influence on the rate of inflation.
Second, when I added an underemployment variable I found it exerts negative influence on annual inflation with the negative impact of the unemployment rate being reduced.
Third, I also found that movements in short-term unemployment are more important for disciplining inflation than unemployment overall. This result was consistent with the hysteresis model which suggests that state dependence is positively related to unemployment duration and at some point the long-term unemployed cease to exert any threat to those currently employed.
This suggests that a downturn, which increases short-term unemployment sharply, reduces inflation because the inflow into short-term unemployment is comprised of those currently employed and active in wage bargaining processes. In a prolonged downturn, average duration of unemployment rises and the pressure exerted on the wage setting system by unemployment overall falls.
This requires higher levels of short-term unemployment being created to reach low inflation targets with the consequence of increasing proportions of long-term unemployment being created. In addition, as real GDP growth moderates and falls, underemployment also increases placing further constraint on price inflation.
I updated that work in 2008 in this paper – Labour underutilisation and the Phillips Curve – which then fed into our 2008 book – Full Employment abandoned.
That insights reported by the Fairfax article at the weekend are not new at all.
The point is that even though unemployment has fallen in Australia since the worst period of the recent downturn, underemployment has not falling much and rose sharply as the economy slowed. The inflation discipline coming from the labour market is at present fairly strong and that is why I conclude there is not significant inflation threat coming from that source.
The Fairfax article also says that:
… weaker prices and productivity growth explain about 70 per cent of the weaker wages growth but, obviously, that leaves 30 per cent of it unexplained.
Next among the usual suspects is weaker growth in employers’ demand for labour. It’s well established that the strength of wages growth varies to some extent with the business cycle.
The problem is that productivity growth is intrinsically linked to the state of the economy as is the demand for labour.
Productivity growth falls when economic activity declines because firms do not immediately lay of all their staff in proportion with the lost output (sales). They tend to hoard skilled labour or overhead labour (front desk staff etc), which means that productivity declines.
Conclusion
Australia is clearly still locked into a balance sheet recession – the aftermath of which are painful and persistent.
The non-government sector typically enters a period of below normal growth while it sorts out its debt problems and regains confidence and this requires the government sector to maintain fiscal deficits at elevated levels for lengthy periods of time.
There is no other way out of this sort of atypical event.
The problem has been that governments have refused to take leadership and responsibility for steering their economies back into safer waters and have, instead, fallen prey to all the lies about fiscal deficits and have sought ways to get back into surplus – as if that state is the norm.
Not only are fiscal surpluses historically abnormal, but in a balance sheet recession, any move to austerity is very damaging.
Australia, like other nations, are suffering the effects of that irresponsible policy behaviour. There is nothing ‘new normal’ about it.
That is enough for today!
(c) Copyright 2016 William Mitchell. All Rights Reserved.
In as much as the ruling classes are determined to hold us in an artificial world of money scarcity, is it not reasonable to say that low inflation, low growth actually is the new (engineered) normal?
Much better to look at the situation as per the title of Jamie Galbraith’s book ‘The End of Normal.’ In that book, just as Bill points to 1976 in Britain being the start if the ‘Monetarist infestation’ , Galbraith refers to that time as the point at which housing bubbles start as banks realise that this is one of the few lucrative areas left. 40 years later…her we are .
Bill,
These articles are a huge relief. I always knew I wasn’t crazy and governments have power to deliver prosperity for all. MMT has given be a theoretical basis for this and proves I was correct in my thinking a decade ago in economics class that fiscal stimulus is under-utilised.
Slightly off topic- but only slightly. I’m suffering through Q and A since apparently the Q and A audience are who the parties are courting.
So far, I’ve heard all about scary hung parliments- you know, the sort of minority government we usually have. Deliberately. Basically set up that way as a brake on the two party system.
And I’ve heard a rant from a lady baby boomer about how “we need Surpluses” “or future generations have to pay” which turned into Albanese and Pyne out bidding each other on who’d get back to bloody Surplus quickest and Tony Jones doesn’t disturb the conversation with reality at all!
Christ on a bike! If THIS audience is who the parties are courting then God bloody help us!
Dr. Bill,
Why do you say that the micro impacts of (all of) our continuing (deepening) balance sheet recession should not be described as the new normal, when, as brendanm points out, money scarcity itself continues (i.e. being endogenously mired) – and has become the almost inevitable norm (absent heli-thinking) – and there is neither momentum nor new understandings to reverse these realities??
Your point about the continuing failure of the public powers to engage in broad-and-deep programmatic fiscal spending seems to confirm, more than anything, this ‘deeper-normal’ labeling of our macro-economic inertia.
At the Minsky conference, Dr. Kelton confirmed her experience at SenFin is to prove that an insurmountable wall exists in OUR nation’s capitol that prevents even the most well-meaning pols from engaging in public interest spending, and she defined that wall with another four-letter word ….. DEBT.
So, as long as money issuance is tied to debt, we’re all dead in the water, being the most likely basis that sec-stag arises as the new normal.
Thanks.
I guess “the new normal” could better be said to be the “new abnormal” as it is a result of policy distortion skewing the economy. Just the same we are in a secular cycle and that cycle says we are in the stagflation zone, and have been since about 1971. IMO the credit binge is masking the stagflation, but for how long can it continue?
Wolf Richter sent out a blog yesterday titled “Hedge Funds are Betting Record Amounts on Meltdown of Australian Banks and Housing Bubble”. He writes that the big four banks’ assets are 220% of Australia’s GDP! Is this skirting disaster or what? Is this a harbinger of trouble for the Banks rather than for the borrowers?
There is still a lot about MMT that I don’t understand and probably never will. Given that I have some background in economics I wonder just how if ever the public will be able to accept it.
Neo-Liberalism on the other hand is very easy to digest and is for the most part perceived to be understood by pretty much everyone be they economists or just anyone on the street.
I’ve completely sold out now to the Neo-Liberals and until I become unemployed will continue to pay the but I have a mortgage excuse.
Alan Dunn,
Neo-liberal economics is simple because it takes microeconomics from the household. (earn, spend, save) and applies that concept to macroeconomics. It’s an incorrect assumption to make.
I have my family and friends struggling to understand the benefits of deficits and the understanding of what government debt is. I actually had one family member think we went to the IMF to borrow money. The way I get through is to say money is a means to an end. If the government isn’t investing in things that are of benefit to the public they are failing. If we have high unemployment, increasing job insecurity, housing unaffordability, inadequate pensions and rising personal/household debt levels the government is failing.