I started my undergraduate studies in economics in the late 1970s after starting out as…
Non-government debt lessons are not being learned
There were two related articles in the Melbourne Age this weekend, a descriptive account of credit card debt vulnerability across Australian households – Default looms for millions of Australians (October 5, 2014), and an attempted analytical piece – If we are so wealthy, why are we in so much debt? (October 4, 2014). The latter is so intent on pushing an anti federal fiscal deficit angle that it fails to tie in the fact that its two central objects – the massive build up of private debt and the pursuit of fiscal surpluses are intrinsically related. The article attempts to rail against both without remotely understanding their connection. But that is what you expect from journalists who try to venture into areas they have lots of opinions but know little about.
The first of the articles is a report from information provided by an organisation that supplies credit ratings to lenders and has used more complete data sets to develop models which estimate the probability of default.
The scoring system generated an average of 760 for Australian credit card holders and the index is calibrated such that:
… a score of 200 means the person has a 50 per cent chance of having an “adverse credit event” within the next 12 months.
The research suggests that:
More than 2 million people, or 13 per cent of the estimated 16 million Australians using credit, are at risk of credit default.
That includes about 600,000 people who are at “high to extreme risk” of defaulting …
Given that private consumption is once again driving growth in Australia as the government sector seeks to impose increasing austerity, private investment spending is flat and net exports are draining growth, this data tells us that little has been done since the GFC to reduce the reliance on private credit.
The other fact is that with real wages growth flat or negative and productivity rising the gap between the two has continued to increase, which means that to maintain consumption growth at levels commensurate with the supply of goods and services onto the market, households have to rely on credit expansion.
Taken together, we have similar dynamics to those that existed prior to the collapse. The same trends are occurring in other advanced nations.
Who says that humans are capable of learning lessons?
Which brings me to the data, which comes from the RBA compilation of official ABS statistics – Household Finances – Selected Ratios – E2
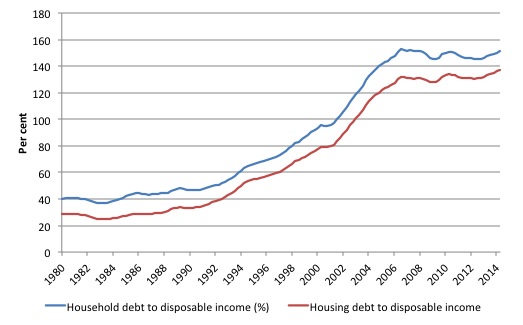
The first graph shows total household debt as a percentage of disposable income since 1980 (to June-quarter 2014). The blue line is total and the red housing mortgage debt.
The credit binge was stark and in two decades pushed the ratio up from an historically steady 40-45 per cent to a peak of 152.9 in the September-quarter 2006.
At that point, the balance sheets of the households holding this debt became very precarious and the rising unemployment and falling economic growth that followed threatened major debt delinquencies.
Since the onset of the crisis and the rise in unemployment, there was a flattening out of the debt ratio. The trend is now upward given that the ratio has risen for the last 8 consecutive quarters (last 2 years)
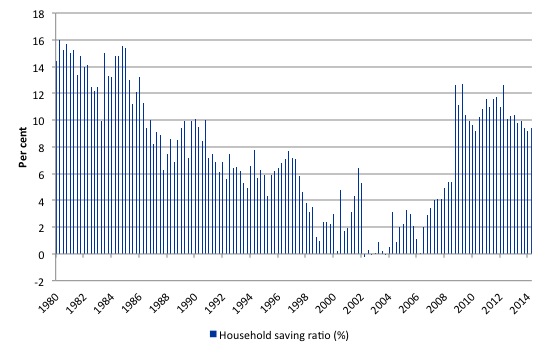
The other side of that credit behaviour is the Household saving ratio, which is shown here (as a percent of disposable income) over the same period (March-quarter 1980 to June-quarter 2014).
As the households were piling on the debt under the duress applied to them by the voracious financial engineers working for the large banks they actually started dissaving (negative saving) for a few periods in the lead up to the crisis.
Historically, the ratio has averaged around 15-16 per cent but in the neo-liberal era that average started falling and as the fiscal surplus fetish became more entrenched and governments bowed to the self-regulating free market myths and allowed financial markets to run loose, the ratio fell sharply to below zero.
At present, households have shown a desire to return to their previous behaviour and the saving ratio has returned to around 10 per cent as they try to stabilise the out-of-control debt levels.
I also remind you that the Federal government ran fiscal surpluses in 10 out of 11 years from 1996 only because the buildup in household debt kept consumption growth moving and tax revenues were robust.
Had the financial markets not foisted so much debt onto households, the Federal government would not have been able to get away with the increasing fiscal drag it imposed on the economy in the form of the surpluses. Within a year of two, the economy would have moved into recession and the tax revenue dried up.
The question you always need to ask is this: If households typically are returning to credit-binge behaviour and seeking to maintain higher saving ratios, does this not signify that the Government should return to its historical behaviour of running more or less continuous fiscal deficits, especially given the other historical fact that remains unchanged – that Australia runs external deficits, which continually drain spending and undermine growth?
More in a moment on that issue.
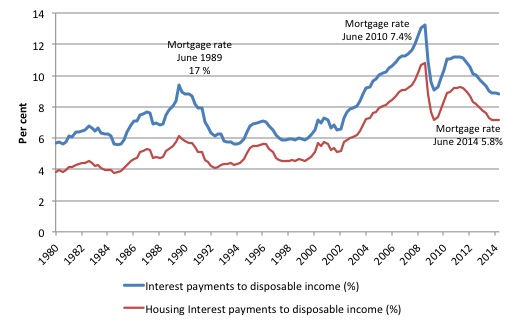
The next graph shows the related interest payment burden (as a percentage of disposable income) over the same period. You can see that even though the lower interest rates are bringing some relief at present, the nominal burden is still high due to the massive debt burdens.
The amount of discretionary income for households holding mortgages is, on average, now severely squeezed and that will work against any resumption in strong consumption spending growth.
You can see that as the crisis hit the RBA dropped interest rates quickly fearing a financial collapse. But then the inflation bogey entered – the fear not the actuality – and they prematurely started to tighten again at the same time as the government was beginning its obsessive (failed) pursuit of a budget surplus.
The combination of policy changes stifled economic growth well before it had recovered to trend and drove up the debt burden for households again.
Since then the RBA has cut the cash rate to historical low levels and held it at those levels for a record period.
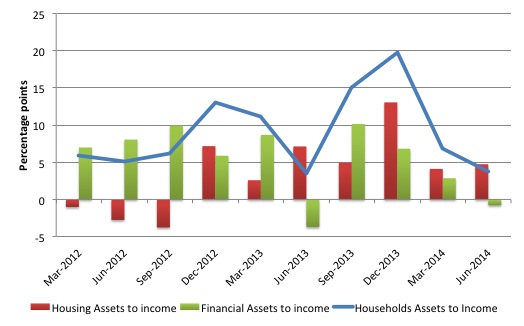
The other point worth noting is that as the household debt rose so did the corresponding ratio of household assets to disposable income. In the September-quarter 1988 (earliest data), that ratio was 521.5 per cent, of which the component relating to housing was 271.0 per cent and the financial assets component was 203.3 per cent.
As the household debt ratio rose, the assets ratio rose to a peak of 854.3 per cent in the September-quarter 2007 (just before the crisis), of which the housing assets ratio was 472.1 per cent and the financial assets ratio was 348.8 per cent.
The final graph shows the change in total Household Assets to Disposable Income ratio (blue line) since the March-quarter in percentage points. The red bars are the percentage point change in the housing ratio and the green bars depict the percentage point change in the financial assets ratio.
The point is that a significant portion of the rising assets to disposable income that the debt binge allowed were held as financial assets. These assets are much more volatile in value and in the crisis period significant losses were experienced yet the ‘margin’ debt that underpinned the escalation remained.
It is thus not correct to claim that the buildup in household debt is all down to the housing market. The housing market is important but the recent history is also been characterised by these increasing holdings of risky financial assets, which has made the overall household situation even more precarious.
Which brings me to the article by Paul Sheehan – If we are so wealthy, why are we in so much debt?, which appeared in the Melbourne Age on October 4, 2014.
Sheehan has been a major right-wing attack dog over the years and during the previous Federal Labor government he was ruthless in the way he demonised the return to fiscal deficit as a result of the crisis and the large discretionary fiscal stimulus that the Government introduced in late 2008 and early 2009.
The fact is that Australia avoided a recession as a result of that stimulus, a feat that was rare among the advanced nations. But Sheehan never acknowledges that.
In the current article, he attempts to consider the household debt situation, but then seems to get confused about whether he is talking about household debt or government debt, so eager is he always to attack the latter.
He sets the scene:
After a long commodities boom, 24 consecutive years without a recession, and a historic rise in household wealth, why are Australians as deep in debt as they have ever been?
Even with low interest rates, the amount of household income consumed by interest payments has trebled in a generation.
During the past 24 years of unbroken economic growth, real household debt has gone from $20,000 for every person to $80,000. The ratio of average household debt, when compared with average household income, has broadly trebled in 24 years, from 60 per cent to around 180 per cent. This takes us into new social territory.
First, the household debt dynamics reflect several related trends.
1. The attack on real wages by successive governments who introduced industrial relations legislation that made it harder for unions to operate and sustained labour underutilisation rates at high levels even in the growth phase to make it easier for firms to resist wage demands.
The resulting increase in the gap between labour productivity growth and real wages growth redistributed national income to profits and provided the wherewithal for the financial markets to go crazy.
2. Deregulation of the financial markets meant that households were able to tap into increasingly large credit streams, often relenting after massive pressure being placed on them by financial engineers who were operating in a new landscape where cowboys roam and prudence is put into the drawer.
A combination of free market zeal and the inevitable corrupt and manipulative practices that accompany a lack of government oversight stimulated the credit binge by households, who were being squeezed in the labour market and saw the credit card as the way to maintain consumption growth.
3. As noted above, a lack of spending support from the Federal government who were entrenched in the pursuit of fiscal surpluses.
4. The rising housing values have increased the average mortgage size. But the growth in financial market speculation and derivative products targetted at the household and the use of credit cards as an overdraft facility have also been important.
Second, with debt levels so high, lower interest rates have not relieved the absolute burden. The RBA worked out that the situation was in crisis and have been very sensitive to making interest rate changes as a consequence.
Third, it is meaningless to divide total household debt by the population.
But Sheehan is correct – we are in a period where households cannot sustain any more debt increases. What he doesn’t acknowledge is that the overall growth strategy of the Federal Government is to rely on more private debt as it attempts to reduce its own (very low) public debt exposure.
Sheehan notes that “core driver of debt is Australia’s obsession with property and over-capitalisation of housing”. As noted above, there is some truth in that statement but it is not the only story.
The rise in household debt has been driven also by the increasing importance of financial asset speculation and credit cards as a sort of emergency overdraft facility for wage-squeezed households.
But it is true that;
Australia is over-invested in real estate. Federal governments have encouraged this via tax incentives for negative gearing, more tax incentives for superannuation funds, and maintaining a sustained rate of high immigration. Demand for housing has also been stimulated by a multi-billion-dollar flow of funds from Chinese buyers.
Our foreign ownership rules have been perverted and the tax system favours investment in property. Both failures have pushed homeaffordability through the roof and disadvantaged the younger generations, who now face a life in rental accommodation and are effectively isolated from the major wealth accumulation activity of their parents – home ownership.
There is no doubt that changes to these rules and tax breaks should be made to restrict ownership of real estate to nationals and to eliminate the speculative incentive for investors to buy housing stock to create tax breaks. But that is another topic for another blog.
Sheehan then loses the message – which is normal for his narratives – he only has a certain number of words per article and always has to get stuck into what he considers to be slack fiscal policy and the role of the state.
He claims:
There are ways to reduce Australia’s excessive household debt levels yet the Senate is now in a state of gridlock and a majority of voters are in a state of denial about debt. They want Labor back in office.
Voters want Labor back, after six years in which it blew up the budget. Not, as it claims, to protect the nation from the 2008 financial crisis – which certainly inflicted plenty of damage in Australia – but because of a spectacular blow-out of spending.
In Labor’s final year in office it spent 50 per cent more per year than in its first year in office. That is a huge increase in spending, given that the economy and tax flows did not grow by even close to 50 per cent. The difference was funded by debt.
First, the statement that “it spent 50 per cent more per year than in its first year in office” is incorrect.
The previous Labor government (Rudd Mark I) was elected on December 3, 2007 and finally lost office (Rudd Mark II) on September 18, 2013.
The ABS data – Government Finance Statitsics, Australia – lets us see what the spending and tax revenue patterns were over this period. The data is quarterly and Table 3 in each spreadsheet gives the Commonwealth statistics.
The data shows that for the period from January 2008 to December 2008 (the first full year in office), total taxation revenue for the Commonwealth government was $A286,266 million, total revenue was $A307,359 million and total spending was $A293,166 million.
As a proportion of GDP, taxation was 23.1 per cent, total revenue was 24.8 per cent and total spending 23.7 per cent.
In their final year of office (from December-quarter 2012 to September-quarter 2013), total taxation revenue for the Commonwealth government was $A339,544 million, total revenue was $A363,617 million and total spending was $A385,127 million.
As a proportion of GDP, taxation was 22.1 per cent, total revenue was 23.7 per cent and total spending 25 per cent.
In between, there had been a massive fiscal stimulus which had been progressively withdrawn since 2011.
Total spending was 31.4 per cent higher in the last year than the first year of the Labor government, total taxation revenue was 18.6 per cent higher, and total revenue was 18.3 per cent higher.
But current value GDP was also 24.3 per cent higher.
Sheehan appears to have rounded 31.4 per cent to 50 per cent – in typical alarmist fashion.
Second, note that Sheehan has also now blurred the waters about which debt he is talking about. The early part of the article is about household debt and then he poses the question what can be done about it.
Immediately he launches into an assault on public debt.
Third, a fiscal balance is not a stick of dynamite. It cannot blow up. Please read my blog – Framing Modern Monetary Theory – for more discussion on the way in which metaphors are used to create and support and alarmist but essentially flawed narrative.
The Federal fiscal balance went further into deficit as the crisis deepened and taxation revenue fell with the slowdown in activity and spending rose as the government deliberately stimulated the economy.
It was a spectacular success and the stimulus should have been maintained for much longer than it was.
Sheehan clearly doesn’t understand the relationships between the macroeconomic aggregates.
The following Table breaks down the sectoral balances into five-year periods from the March-quarter 1960 to the June-quarter 2013 (the last period being from 2010-13).
Please read my blog – Answer to Question 1 – for the derivation and meaning of these balances if you are unsure. Remember they are derived from the National Accounts and (S – I) – (G – T) – (X – M) = 0.
In the full employment era spanning 1960 to the mid-1970s the fiscal deficit was continuous and stable and this provided the aggregate demand stimulus to offset the small drain in spending arising from the small external deficits.
The private domestic sector balance (saving minus investment) was in a small deficit as nation building continued but there was strong saving (as a result of strong real GDP growth) supporting strong investment (and building of productive capacity).
The situation started changing in the 1980s with deficits declining (and occasional surpluses recorded) as the neo-liberal anti-deficit mantra gathered pace. The external deficit rose on average and the private sector balance went into higher deficits as the saving ratio fell.
With the external deficit stable between 1985 and 2005 the shift to fiscal surplus was only possible because the private sector went further into debt.
Since the crisis, the private sector has radically altered its behaviour returning more to the behaviour of the 19060s (but constrained by higher debt levels) and growth is being supported by the return to fiscal deficits.
The fact that the growth rate is well below trend and unemployment is rising again tells me that with this private sector behaviour the fiscal deficit has to be higher.
That is the major message of all these graphs.

The point is that the period before the neo-liberal era was characterised by several features.
1. Relatively continuous use of fiscal deficits.
2. Stable household saving ratio of around 16 per cent of disposable income.
3. Real wages growing in line with labour productivity – so that consumption could be driven by real wages growth rather than credit.
The neo-liberal period is in fact the outlier – an atypical period. Which makes the claims by those who hold out that governments should return to surplus as a demonstration of fiscal responsibility rather difficult to understand.
In many cases, where actual fiscal surpluses were recorded, the economies went into recession soon after. The important point though is that the surpluses were made possible by the unsustainable growth in private credit which drove private spending and boosted tax revenue.
It is clear that we have returned to a more normal environment now where the private sector are attempting to save more out of disposable income and reduce its reliance on credit.
Two implications arise if that if the private consumption growth is returning to more normal (lower) levels then two things follow:
1. The government will more likely have to run fiscal deficits of some magnitude indefinitely – as in the past.
2. Real wages growth will have to be more closely aligned with productivity growth to break the reliance on credit growth.
And when the nature of the balance sheet adjustments that are going on at present are included in the assessment these two points become amplified.
This also makes the quest for fiscal austerity to be mindless and very destructive. Where will growth ever come from if consumers are returning to higher saving ratios, firms are very cautious, all countries are eroding each other’s export markets, and governments are adding tot he malaise?
Conclusion
The initial discussion about the increasing risk of insolvency among Australian credit card holders and the news today that the Government is thinking of cutting spending and increasing tax rates to fund the attacks on the extremists in Iraq tells me that nothing much has been learned from the GFC.
But it is little wonder when characters like Paul Sheehan command the national stage with the sort of nonsense that comes out of his word processor.
That is enough for today!
(c) Copyright 2014 Bill Mitchell. All Rights Reserved.
Dear Bill
I think that, just as we have a GDP deflator, we should have a wealth deflator. Suppose that in a country the stock of houses increases by 4% in a given period and that these new houses are worth on average 1.25 of what the previous houses were worth, then the total real value of houses should increase by 5%. If it increases by, say, 50% while consumer inflation was 20%, then it should be deflated by 150/105 x 1.2. Wealth is real things, not high prices, because for every price there is someone who receives it and someone who has to pay it. The benefit from the price increase that the seller gets is canceled out by the loss that the buyer has to incur.
Suppose that Peter bought a house in 2000 for 250,000. Last week, he sold it to Paul for 500,000 even though physically it is exactly the same house. Peter has a capital gain of 250,000 but Paul would have 250,000 more to his name if the price of the house had not doubled. As a pair, they are not better off because Peter’s gain is Paul’s loss.
Regards. James
James,
Quite a good idea. The same can be said for any short term speculation – it is often touted as investment but it is really an odd mix of gambling and wealth transference. The whole idea is to sell to someone who is going to make an economic loss, or in many cases a nominal loss. The risk/reward structure of this type of behavior is horrifying only due to its scale, though. Buying a packet of cigarettes for $20 is of course worse than speculating with it due to all of the externalities, but speculation tends to run into 4-7 figures, and then the behavior tends to steer markets more heavily than customer satisfaction, more heavily than democratically elected governments pursuing the neoliberal agenda, and in many cases more heavily than all others combined.
Something has to be done about high dollar speculation. Not even a pro free market acolyte could make an argument for what is essentially insider gambling.
“I think that, just as we have a GDP deflator, we should have a wealth deflator. ”
We do. It’s called a Government Budget Surplus. Thanks for playing.
Paul Sheehan’s not alone. Here’s a sample of a recent effort by Peter Hartcher (“Trouble comes in threes as Lucky Country reaches a crossroads”)
As Australia’s population ages inexorably, one effect will be to force the national budget into persistent annual deficit of 6.4 per cent of GDP, or around $100 billion a year in today’s dollars, according to the Productivity Commission.
The result would be cumulative national debt over the next third of a century of $2 trillion in 2002-03 dollars over the next third of a century. That would represent utter disaster. The most practical response to this challenge is to continue Australia’s big intake of skilled migrants.
Bill,
You claim that people have borrowed to make up for the lack of a deficit. That strikes me as debatable in that lending by commercial banks is PRO-CYCLICAL far as I can see.
Dear Ralph (at 2014/10/07 at 15:48)
How do you think that households maintained their consumption growth (and growth overall in the face of the fiscal drag) when real wages growth was flat and productivity growth was surging away?
Via credit. The evidence is indisputable.
best wishes
bill
“How do you think that households maintained their consumption growth . . . ”
In the UK the APS declined?
“That’s not that unusual in terms of the phases of recovery and in fact the levels of activity or the rate of growth in consumption is quite modest compared to previous recoveries. It is not debt-fuelled consumption; it is consumption out of income. In effect what’s happened in the last several months has been that the degree of precautionary savings of households has dropped, elevated levels to levels that are still quite high relative to where households were saving pre-crisis. But you have the drop and that has given a boost to consumption.”
from Page 16
Quarterly Inflation Report – 13th November 2013
http://www.bankofengland.co.uk/publications/Documents/inflationreport/2013/conf131113.pdf
What do you make of the ICB efforts to further reduce access to credit on behalf of domestic residents via its new deposit to loan ratios and the like while in such a open economy people outside the estate ..sorry state can buy up & thereore inflate local assets without credit restriction.
Me thinks this proves my thesis that central banks are always and everywhere a foreign body or contagion on a country.
The ultimate pox.
The social creditors have been proven correct beyond even my wild imaginings.
These pathogens known as central banks have always worked to refuse people the ability to purchase what is available to purchase.
First by various policies of reducing wages or basic income and now by using the credit mechanism as a external method of inflating assets in abundance or indeed charging a rent on vital but abundant resources such as water in Ireland.
The nice “Irish” gov
“And of course smaller banks will continue to be supervised wholly from Dublin (within the overall SSM approach), as will the 400 credit unions, some of which continue to need special attention as the sector strengthens and consolidates.”
Must attack the credit unions and their ability to redistribute capital outside central control.
Orwell lacked imagination me thinks.
“The latter is so intent on pushing an anti federal fiscal deficit angle that it fails to tie in the fact that its two central objects – the massive build up of private debt and the pursuit of fiscal surpluses are intrinsically related. The article attempts to rail against both without remotely understanding their connection. But that is what you expect from journalists who try to venture into areas they have lots of opinions but know little about.”
Sadly, I have to blame you economists, as a group. You keep using same words for different things. How can you possibly expect people to understand?
The way debt works in the private sector is that it is contractual obligation to deliver money on the specified terms. Sovereign issuing assets is said to be in debt too, but clearly it is not same kind of debt as debts of the private sector. When you have different things you should use different words to distinguish them apart for god’s sake.