Last Tuesday (May 12, 2026), the Australian Treasurer introduced the 2026-27 Fiscal Statement (aka Federal…
Australian government doesn’t deserve office, nor does the Opposition!
Yesterday (May 2, 2016), the Reserve Bank of Australia (RBA) dropped the short-term policy interest rate by 25 basis points (1/4 of a percent) to 1.75 per cent, a record low as a result of its assessment of a weakening economy and the deflation that has now been revealed by the ABS. I wrote about the latest CPI data in this blog – Australia enters the deflation league of sorry nations. The fact that the RBA is trying to stimulate growth is a sad testament to the current conduct of the Australian government (and the Treasury), which despite all the lying rhetoric that its corporate tax cuts, revealed in last night’s fiscal statement will stimulate jobs growth, is actually continuing to undermine growth. The fiscal contraction implied by last night’s statement by the Federal Treasurer is modest next year and then gets sharper in the year after (2017-18). Many would conclude that the contractionary shift is benign. However, in the context that the strategy is being delivered, the actual need is for the discretionary fiscal deficit to rise by around 1 to 1.5 per cent of GDP, at least, not contract at all. The federal government has moderated its ‘surplus at all costs’ mania which dominated the macroeconomic policy debate a few years ago but is still aiming for a surplus (or close to it) within 4 years. It will fail in that goal because the non-government spending behaviour will not allow that outcome and the government’s own fiscal contraction over that period will undermine growth further. The early statements by the Federal opposition are also idiotic. It is claiming it would make ‘tougher’ decisions (that is, cut the deficit more sharply). That just means it would end up with higher levels of unemployment than the conservatives will under their current strategy. Both unemployment levels will be unacceptable. Neither major political party in Australia is fit for office!
In the – Statement by Glenn Stevens, Governor: Monetary Policy Decision – the RBA said:
At its meeting today, the Board decided to lower the cash rate by 25 basis points to 1.75 per cent … This follows information showing inflationary pressures are lower than expected.
The global economy is continuing to grow, though at a slightly lower pace than earlier expected, with forecasts having been revised down a little further recently … Australia’s terms of trade remain much lower than they had been in recent years … uncertainty about the global economic outlook and policy settings among the major jurisdictions continues. Funding costs for high-quality borrowers remain very low and, globally, monetary policy remains remarkably accommodative.
In Australia … growth is continuing in 2016, though probably at a more moderate pace. Labour market indicators have been more mixed of late.
Inflation has been quite low for some time and recent data were unexpectedly low. While the quarterly data contain some temporary factors, these results, together with ongoing very subdued growth in labour costs and very low cost pressures elsewhere in the world, point to a lower outlook for inflation than previously forecast.
In central bank-speak, the statement means that the RBA is worried that the world economy is becoming stagnant and the Australian economy is performing poorly.
It is also worried that inflation has now turned into deflation and is well below the target range of 2-3 per cent.
In other words, it is doing the only thing it thinks will help boost demand – cut the cost of borrowing.
But, this is a weak policy instrument. Borrowing is not constrained by cost at present, given how low interest rates already are.
The reason business firms are not borrowing is because the spending outlook in the rest of the economy is looking weaker and the existing capacity is more than enough to satisfy the well-below trend spending growth.
And, please disregard the journalists last week that were trying to claim the data doesn’t indicate deflation.
The only accepted definition of deflation is a decrease in the general level of prices or a negative inflation rate. It is not the same as the technical definition of recession, which requires two successive quarters of negative real GDP growth to be recorded.
To claim that as one journalist did last week that “it’s simply not true … Not even close” that the negative inflation data last week indicated that Australia entered the league of sorry nations now recording deflation shows that she has lost a basic understanding of the topic she was writing about.
She claimed that anyone suggesting that Australia had entered a deflationary phase (after recording a negative inflation rate of -0.2 per cent) would also probably claim that “England took homethe Ashes because they won the first inning”.
An analogy is was a put-down’ attempt by the journalist being a smart-A, but pitiful nonetheless. There is no correspondence between the inflation record and a cricket match, sorry.
But I digress.
The Federal government’s fiscal strategy outlined in last night’s – Fiscal Statement Speech – to the Parliament should be seen the light of a weak economy with elevated levels of unemployment and underemployment and increasing inequality.
I don’t intend to analyse the fiscal statement in minute detail – it doesn’t really deserve that at a macroeconomic level, given how flawed the strategy is.
There is a plethora of detail at the micro level that different groups will have to come to terms with to determine who gains and who loses.
But at the macroeconomic level – the collective as a nation – we all lose as a result of this incompetent and venal display by a failing conservative government.
To understand why context matters, please read the following blog – MMT Fiscal Principles.
There you will see that a responsible fiscal policy requires two conditions be fulfilled:
1. The discretionary fiscal position (deficit or surplus), which is net of the automatic stabiliser effects (the cyclical impact on the fiscal balance) must aim to fill the spending gap between the non-government saving minus investment minus the gap between exports minus imports.
If the non-government sector is not willing to spend all its income (that is, recycle the income back into demand) to maintain the current levels of output, then there is only one sector left that can do it – the government sector via deficit spending.
2. When filling that spending gap, the government has to ensure that the non-government saving, import and investment levels are at their full employment levels.
These conditions specify a strict discipline on fiscal policy if the aim is to achieve full employment.
The 2016-16 Fiscal Statement (‘the Budget’) fails badly when judged against these conditions. To make matters worse, it doesn’t even consider them in any explicit way.
Not many other commentators or rival politicians seem to understand them either.
The context
he Australian government likes to tell us that the Australian economy is close to or at full employment. They frame their fiscal responses as if that was true.
The fact is that the Australian economy is a hundreds of thousands of jobs short of being at full employment and as a consequence the fiscal stance of the Government has been too biased towards austerity.
There needs to be a greater deficit to generate higher levels of activity in the economy and more employment given the current spending preferences of the non-government sector.
Here are some summary facts:
- In April 2016, there were 723,100 persons unemployed at an official unemployment rate of 5.7 per cent. This seriously understates the extent of labour wastage in the economy.
- The current participation rate is 0.9 percentage points below its recent peak in November 2010, which means that some 180,000 workers have left the workforce because of the lack of employment opportunities, the majority of which would quickly take jobs if they were offered.
- In February 2016, there were 1058.9 thousand persons underemployed. Remember to be classified as employed by the ABS a person only has to work 1 or more hours per week.
- The underemployed are workers who want more hours of work but cannot find them. On average they desire an additional 14.3 hours per person. The current underemployment rate is 8.4 per cent. To eliminate this labour wastage would require 399 thousand full-time equivalent positions (38 hour week).
- The total estimated labour wastage in Australia – taking into account unemployment, hidden unemployment and underemployment – is well over 15 per cent of the available labour force. For teenagers the equivalent figure is a over 40.1 per cent.
- Even at February 2008, the broad labour underutilisation rate was close to 10 per cent, which means the economy wasn’t at full employment then.
- If we define a reasonable full employment policy goal of 2 per cent unemployment, zero hidden unemployment and zero underemployment, then the Australian labour market needs to create a further 1,050 thousand jobs.
With real GDP well below trend and elevated levels of labour underutilisation, the conclusion we reach based on current non-government spending and saving behaviour is that the fiscal deficit is too small, probably by around 1 to 1.5 per cent of GDP.
The bottom line – no fiscal leadership being shown by this government
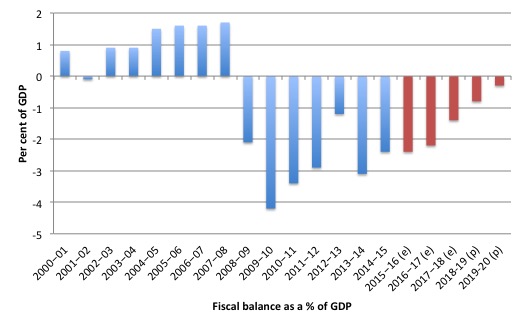
The fiscal statement released last night by the Treasure has the following forward estimates for the fiscal balance as a percentage of GDP. The graph starts in 2000-01 and goes to 2019-20.
The red bars are the latest projections from the current Government as outlined in last night’s statement.
The evidence is that the fiscal shift from last financial year to this year (nearly ended) is zero. The outstanding fiscal deficit is estimated to come in at -2.4 per cent of GDP.
The Treasury estimates that next year (2016-17), the government will reduce its contribution to growth and then more rapidly in the remaining three years of the forecast period until 2019-20, the fiscal deficit will be a minuscule -0.3 per cent of GDP.
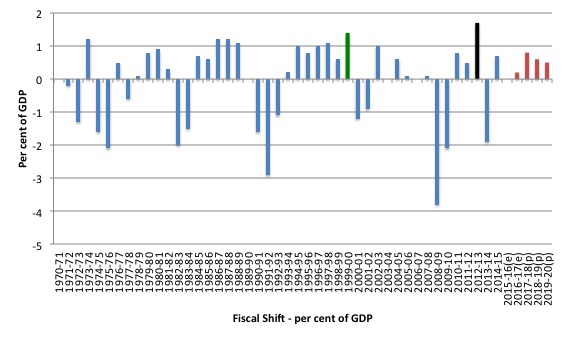
The fiscal shift from one year to another is the extent to which the fiscal balance as a percentage of GDP changes (a positive change means the deficit is falling).
The following graph shows the recent history (from 1970-71) of fiscal shifts.
The biggest fiscal swing in the previous conservative government’s tenure was in the financial year 1999-2000 (a shift of 1.4 per cent) which is shown in green.
A sharp slowdown in the economy followed that contraction and the fiscal balance was in deficit two years later (2001-02) – the only deficit they recorded in the 11 years in office.
The Australian economy only returned to growth after that because the Communist Chinese government ran large fiscal deficits themselves as part of their urban and regional development strategy. That spurred demand in our mining sector.
The largest fiscal shift in the sample period shown was the second-last fiscal statement from the previous Labor government in 2012-13 which was equivalent to 1.7 per cent of GDP. What followed was a major slowdown as the recovery from the GFC, spawned by the fiscal stimulus in the previous two years was deliberately withdrawn.
That Labor government was obsessively trying to achieve a fiscal surplus in 2013-14 and was blind to the reality that the private domestic sector was not going to fill the spending gap left by the retrenchment in net government spending.
The result – which was totally predictable – was that the economy took a nosedive, tax revenue fell even further and the fiscal balance moved further into deficit with unemployment rising.
The reversal in the fiscal balance was larger than the attempted contraction the year before (1.9 per cent compared to 1.7 per cent), which just tells you that it is folly to try to cut a deficit when private demand is weak.
In last night’s fiscal statement, the forward estimates imply a tightening of fiscal policy (red bars). The fiscal shift in the next year (2016-17) is only 0.2 per cent of GDP, and this increases in the following year (2017-18) to 0.8 per cent of GDP.
Unless there is an extraordinary pick up in private spending or net exports then the economy will not achieve the underlying growth assumed and we will be left at the end of the fiscal year with a fiscal deficit higher than they forecast and an even weaker economy than exists now.
While many commentators are claiming that the small discretionary contraction next year is benign, the reality is that it has to be set against the context and what that context implies.
My assessment is that the fiscal deficit should be much larger this year and next than it will be and that means the small fiscal contraction is still going to be irresponsible.
In other words, the government is invoking a pro-cyclical fiscal policy change, which are the anathema of responsible fiscal management.
Discretionary changes in fiscal policy should typically be counter-cyclical – to manage output gaps. The only time an expansionary discretionary fiscal change should be pro-cyclical is when growth is positive but not strong enough to achieve full employment. Once capacity is reached, fiscal policy should counteract non-government spending changes.
Here are some further questions the journalists should be asking but are not:
1. What reason does the government give for contracting net spending while the real GDP growth rate is falling and has been consistently below trend for some years now, and the unemployment rate remains at elevated levels well above even what the Government claims is full employment?
2. Why would a government deliberately impose massive daily national income losses on the economy, which are disproportionately endured by the poorest members of our society?
It is also clear that the Treasury was not even remotely correct in its economic assessment of real GDP having previously estimated it would be above 3 per cent in the coming years and has now downgraded its estimates to a paltry 2.5 per cent.
What is going on there? The simple answer is that their model frameworks are based on flawed macroeconomic theory – the same theory that led to policies around the world that caused the financial crisis.
Real GDP growth is well below trend
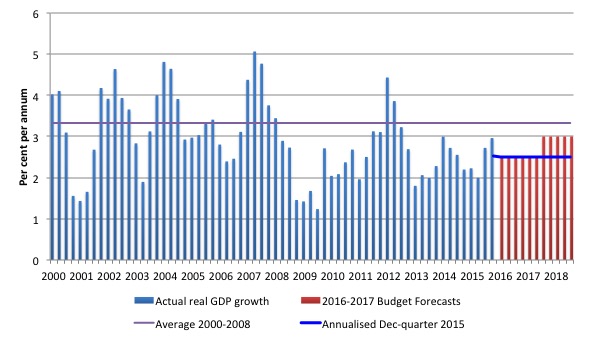
Real GDP growth is still well below its recent trend and that means that unemployment and underemployment remain at elevated levels.
The following graph shows the recent history of real GDP growth. The trend line (at 3.3 per cent) is calculated as the average annual growth rate between the March-quarter 2000 to the March-quarter 2008. In general a trend growth rate between 3.25 and 3.5 is found for Australia no matter which reasonably long growth sample you select.
The blue horizontal line is the annualised growth rate as per December-quarter 2015 (the most recent estimate). If that quarter’s performance continued then the economy would be growing at 2.5 per cent which is well below the rate required to keep unemployment from rising if labour productivity and labour force growth are at their usual levels.
The red bars are the real GDP forecasts out to 2017-18.
If the Government’ forward estimates are correct, then it is accepting that its policies will only generate below trend growth for the next three years at least.
It should be remembered that even when the economy was growing at the (purple) trend there were still high rates of labour underutilisation. Even at the peak of the last cycle (February 2008), the sum of unemployment and underemployment was around 9.9 per cent.
So this is a very mediocre aspiration for the Government to adopt. Moreover, there is nothing in the fiscal statement that would justify the optimistic increase in real GDP over the next few years.
There is every reason to expect, especially with the fiscal contribution to growth declining and business investment is forecast to be sharply negative or static over this period, that the economy will labour on at well below trend rates of growth, given the developments in China and elsewhere.
Certainly the Reserve Bank of Australia is more concerned about the persistence of below-trend growth rates than the Government (the Treasury) seems to be, even though it does not have the effective policy tools available to do anything about it.
The fiscal statement shows that the Australian government (and the Treasury) are jettisoning their responsibility for growth and all the talk about ‘enterprise tax plans’ cannot hide that.
The point is that the economic cycle is not overheating or even heading upwards. If anything a further slowdown would be expected.
In that context, running a contractionary fiscal position is irresponsible and the anathema of good policy.
Now that the Government has admitted (by implication) that there is no ‘fiscal emergency’ and that was all a beat up to scare voters into supporting them at the last election, it should take the next necessary step towards responsible government and increase its discretionary fiscal deficit to stimulate employment.
Had they done that they would then have been justified in claiming that their fiscal strategy will boost productivity and workforce participation.
The showpiece – Enterprise Tax Plan
The Government outlined what it called its 10-year “Enterprise Tax Plan”, which is a fancy term for cutting company tax on small and medium-sized firms. The Government claims this forms a centrepiece of its ‘growth and jobs’ strategy.
Unfortunately, the claims are not even remotely accurate.
In Statement 3: Fiscal Strategy and Outlook’, presented in ‘Budget Paper No.1’, we read (page 3-8) that:
Overall, the ten year enterprise tax plan is expected to deliver a permanent increase of GDP of just over one per cent in the long term.
Really, and this is the centrepiece plan that “will support growth, higher wages and jobs by lowering the company tax rate over time to an internationally competitive level, with early cuts for smaller businesses.”
But the Treasury also simultaneously published its – Economy-wide modelling for the 2016-17 Budget – which reveals that:
1. Lowering the company tax rate from 30 per cent to 25 per cent delivers an increase in GDP, per percentage decrease in the rate of between 0.16 to 0.22 per cent, depending on other assumptions.
These increases will be spread over 10 years – that is, out to 2026-27.
That sort of real GDP increase will not stimulate huge employment dividends, especially with the government progressively withdrawing spending from the economy.
2. Small and medium-size businesses typically are run by individuals or partners. Their company tax payments allow them to reduce the tax burden on any income they draw on profits as owners (via dividends). The upshot will be that any income withdrawn from businesses as the company tax rate is dropped will increase the tax paid by the owners.
Will that push owners to leave the money in the business and reduce their own personal standard of living? Unlikely, and it is difficult to see it boosting investment in any significant way.
Certainly, the projections for business investment in the forward estimates are poor (see below).
The private sector’s debt position is set to worsen
The economic predictions, which underpin the fiscal statement and are contained in Budget Paper No.1, show that the Treasury is forecasting the following outcomes:
1. The fiscal deficit for 2015-16 of -2.4 per cent of GDP reducing to -2.2 per cent of GDP in 2016-17, then -1.0 per cent (2017-18), -0.5 per cent (2018-19) and -0.1 per cent (2019-20).
2. The current account deficit to be at 4.75 per cent of GDP in 2015-16, -4 per cent in 2016-17 and -3.5 per cent in 2017-18.
I note that the average current account deficit since fiscal year 1974-74 to 2015-16 has been -3.9 per cent of GDP. So we might consider that sort of performance to continue over the fiscal projection period. There is certainly no expectation that the current account will suddenly record close to balance results over the fiscal forecast period.
So what does that mean in terms of the sectoral balances?
Remember that we can derive a relationship from the national accounts between spending and income for the three-major sectors in the economy: (a) the external sector; (b) the private domestic sector; and (c) the government sector. (a) and (b) sum to be the non-government sector.
The sectoral balances must hold as an accounting statement and we then need to interpret their evolution by understanding what drives the individual balances.
Please see – Answer to Question 3 – for the complete explanation of the sectoral balances approach and derivation.
The final sectoral balances expression that results from that derivation is that:
(S – I) = (G – T) + CAD
where S is private domestic saving from disposable income, I is private domestic capital formation investment, G is total government spending, T is government taxation receipts, and the CAD is the current account deficit (the trade deficit plus net income transfers abroad).
The sectoral balances equation is interpreted as meaning that government sector deficits (G – T > 0) and current account surpluses (CAD > 0) generate national income and net financial assets for the private domestic sector.
This allows the private domestic sector to save overall (which is different from household saving out of disposable income denoted S above). That means, the private domestic sector is spending less than its total income and building wealth in the form of financial assets.
Conversely, government surpluses (G – T less than 0) and current account deficits (CAD less than 0) reduce national income and undermine the capacity of the private domestic sector to add financial assets.
The previous expression can also be written as:
[(S – I) – CAD] = (G – T)
where the term on the left-hand side [(S – I) – CAD] is the non-government sector financial balance and is of equal and opposite sign to the government financial balance.
This is the familiar MMT statement that a government sector deficit (surplus) is equal dollar-for-dollar to the non-government sector surplus (deficit).
The sectoral balances equation says that total private savings (S) minus private investment (I) has to equal the public deficit (spending, G minus taxes, T) plus net exports (exports (X) minus imports (M)) plus net income transfers.
All these relationships (equations) hold as a matter of accounting and not matters of opinion.
The following graph shows the sectoral balance aggregates in Australia for the fiscal years 2000-01 to 2019-20, with the forward years using the Treasury projections published in ‘Budget Paper No.1’ and the current account position assumed constant at the 2017-18 estimate of -3.5 per cent of GDP.
All the aggregates are expressed in terms of the balance as a percent of GDP.
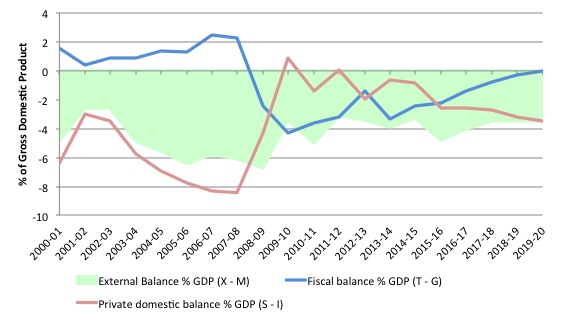
So it becomes clear, that with the current account deficit (green area) more or less projected to be constant over the forward period, the private domestic balance overall (red line) is the mirror image of the projected government balance (blue line).
In the earlier period, prior to the GFC, the credit binge in the private domestic sector was the only reason the government was able to record fiscal surpluses and still enjoy real GDP growth.
But the household sector, in particular, accumulated record levels of (unsustainable) debt (that household saving ratio went negative in this period even though historically it has been somewhere between 10 and 15 per cent of disposable income).
The fiscal stimulus in 2008-09, which saw the fiscal balance go back to where it should be – in deficit – and this not only supported growth but also allowed the private domestic sector to rebalance its precarious debt position.
The fiscal strategy outlined by the Government last night now implies as the graph shows that the private domestic sector will once again be accumulating debt as it progressively spends more than its income.
We are on the path back to the excessive private domestic debt levels that prevailed before the GFC.
Further, the fiscal estimates suggest that total private investment will decline by -11 per cent in 2015-16, -5 per cent in 2016-17 and be static in 2017-18.
So for the private domestic sector to move from a deficit of -2.6 per cent of GDP in 2015-16 to -3.5 per cent of GDP in 2019-20, with private investment in sharp decline or static (in the final year), implies that the household sector is going to have to be spending much more than its income, and, increasingly so, for the overall sector balances to have any coherence.
That would mean the implied build up of private sector debt will be borne by the household sector, already carrying record levels of debt.
But, then you examine the other fiscal projections in Table 1 of the Economic Outlook, presented in Budget Paper No.1 and the outlook for household consumption and dwelling investment are fairly constant or falling (in the case of home investment).
So the question then is obvious – where is all the private domestic sector spending implied by the sectoral balances analysis going to come from?
The answer is also obvious: the Treasury estimates are inconsistent. They do not add up. Which would not be the first time that observation has been apparent.
In other words, the fiscal estimates provided by the Government are concocted in an ad hoc manner which little recognition of the underlying relationships that have to hold between the three macro sectors.
If the projections are to be believed then the Government is expecting the private domestic sector to maintain the growth in the economy by increasing its indebtedness.
That would mean we are heading in the same direction as before the crisis – growth becomes reliant on private debt buildup.
The whole nation is transfixed on fears that the government debt in Australia is too high – courtesy of all the scaremongering that has been going on. But nary a word gets mentioned about the dangerous private debt levels. It is true that most of the debt is owed by higher income people in Australia, which makes an insolvency crisis of the likes of the sub-prime less likely here.
But the reality is that the debt levels and the growth in them (about the same as disposable income) means that consumer spending is likely to remain fairly subdued overall. It is unlikely we will see a return to the pre-crisis period when debt grew much faster than disposable income and the resulting spending maintained stronger economic growth.
And the Opposition?
The full response from the Federal Opposition will come later in the week. But the first reaction to last night’s fiscal statement form the Shadow Treasurer Chris Bowen showed he and the Labor Party are also not fit to govern.
In the news interview (May 3, 2016) – Morrison is fiscally reckless: Bowen – the Shadow Treasurer:
1. Criticised the company tax cuts for being an act of “fiscal recklessness” because there were “unfunded, un-costed tax cut for corporate Australia”.
2. Welcomed the “household tax cuts” even though they help the highest 25 per cent of the income distribution and give virtually nothing to the rest.
3. Said he was “very concerned about the AAA credit rating” – because the current Treasurer is not prepared to “prepared to take tough decisions” – that is, cut the fiscal deficit more harshly. Bowen claimed that if he was the Treasurer (spare the thought) he would have taken these “tough decisions”.
He didn’t also say that he would drive the economy into recession and increase unemployment if he did take these “tough decisions”. But then his comprehension of macroeconomics is so bad that he would not even know that would have been the consequence of trying to get into fiscal surplus under the current circumstances.
Please read the blog – Don’t fall for the AAA rating myth – to see why Bowen is an idiot for being “very concerned”.
What a shocking political choice Australian’s have in the upcoming July federal election.
The neo-liberal conservatives and the neo-liberal Labor party – both intent on keeping unemployment at elevated levels and neither Treasurer (or Shadow) coming to terms with the reality of what their current fiscal position would do to overall real GDP growth.
Conclusion
May each year comes with May Day, which is a cause for celebration. Then, usually at least a week later comes the fiscal statement from Australia’s federal government, which is always a cause for despair.
The highs and lows of life as an economist!
This year, there is little fiscal contraction but that has to be seen in the context of a glaring need for more discretionary fiscal stimulus. The federal government is taking fiscal policy in the wrong direction.
For further analysis in the lead up to this year’s fiscal statement, please read the following blogs – The CEDA Report – one of the worst ever and Australian PBO – hard to take seriously – is it vaudeville or what?.
Upcoming Spanish Speaking Tour and Book Presentations – May 5-13, 2016
Here are the details of my upcoming Spanish speaking tour which will coincide with the release of the Spanish translation of my my current book – Eurozone Dystopia: Groupthink and Denial on a Grand Scale (published in English May 2015).
You can purchase the Spanish version of the book – La Distopía del Euro – for 27.54 euros from Amazon.
You can save the flyer below to keep the details handy if you are interested. All events are open to the public who are encouraged to attend.

That is enough for today!
(c) Copyright 2016 William Mitchell. All Rights Reserved.
Great summary Bill.
Sadly, this is the only place where I can go to find a sectoral balance analysis relating to the budget.
Keep up the great work.
Yes, it’s sad when every media outlet spruiks the myth that surpluses are national savings and credit ratings matter. There is no focus on unemployment figures or inequality statistics. Inequality and unemployment reduction are indicators of a well performing economy.
Keep up the good work, Bill! I’m certainly learning a lot thanks to this blog! Looking forward to your new book.
What are the chances that Australia is going to go into a recession ? … ie by the definition proper …. 2 quarters of negative growth
This year was less bad than what I was anticipating!
This flyer doesn’t seem to be the final version. Just in case, I’d like to let the readers know that there is one extra talk by Professor Mitchell taking place on the 12th of May in Madrid.
See you in Madrid Bill!
Thank you for a readable analysis Bill. Does the term “corpocracy” mean anything to you?
Dear Javivi (at 2016/05/04 at 9:27 pm)
Thanks for the information – I have updated the flyer to reflect the latest schedule. It will be available in tomorrow’s blog (Thursday).
best wishes
bill
Thanks – a great summary. Love your blog.
Andrew Leigh (Shadow Asst Treasurer) tweets that debt that has “blown out” by “$5000 per person” under the LNP government.
Bill Mitchell on such ratios:
“Which is as stupid as saying that for every worker there are x square metres of publicly owned land”
Andrew Leigh could be a big part of Chris Bowen’s problem.
Sad that Labor as the only realistic alternative to the LNP/IPA regime does not understand modern macro-economics. Instead they would go harder on austerity. The Greens are too fixated on climate change (though this is important) but they too seem to not comprehend macro-economics. Steve Hail presented a lecture on MMT in 2014 but I gained the impression that the audience did not really “get it”.
https://www.youtube.com/watch?v=qBpm5sVmGYc
I was looking for Keynes quote re a 15 hour week and of course, in that essay (Economic Possibilities for our Grandchildren) he finishes with this great utopian statement:
But, chiefly, do not let us overestimate the importance of the economic
problem, or sacrifice to its supposed necessities other matters of greater and
more permanent significance. It should be a matter for specialists-like
dentistry. If economists could manage to get themselves thought of as humble,
competent people, on a level with dentists, that would be splendid!
Thanks, Bill,
That was a lot of material, but well worth the read.
I understand Australia’s increasing debt does not present the risk of running out of money. But what about running out of agricultural land?
How do you respond to these concerns, Bill?
1. Large foreign corporations are no longer paying the tax they used to pay before 2014.
2. Hence gross debt has increased by $147 billion since the 2013 election.
3. Interest paid to non-resident creditors has increased by $6.76 million per day up to $29 million per day. Every day. That’s 205.5 million Aussie dollars paid to foreigners each week. Or 10.5 billion each year.
4. With the Aussie dollar in the toilet, this cannot be swapped profitably for other currencies and taken out of the country.
5. Hence non-residents spend much of this buying up vacant land, mostly pastoral properties.
6. Australian agricultural land is now being sold to non-residents at an unprecedented rate.
7. This is accelerating as the gross debt keeps on expanding.
8. Australia will never run out of currency. But agricultural land is finite.
http://www.theland.com.au/story/3386004/chinese-investors-on-buying-spree/
Steven Hail misspeaks toward the end of his lecture, saying that Bill Mitchell and Phil Lawn are Deficit Doves, whereas they are Deficit Owls.
@Alan Austin
“But what about running out of agricultural land?”
That’s getting to the point. In MMT Economics fiscal policy should be spending the ‘right’ amount of money relative to the resource constraints. Nothing to do with ‘balancing’ some ‘budget’ figure. That political aberration.
The predictions for farmable land are dire with salinity and climate change being huge problems, (and disastrous trade deals looming for farmers) if politics adds an artificial constraint by saying the treasury cant finance its debt then that is just undermining the real capacity to deal with these problems.
Many of the other points mentioned about debt eg: 2, 3, 4 and 7 are typical of the sort of myths that confuse the issue.
So what if ‘gross debt’ to go up. Be worried about private sector debt (currency users like farmers).
See one of bills posts like ‘deficit spending 101’: https://billmitchell.org/blog/?p=332 or for the step by stemp accounting in detail: http://neweconomicperspectives.org/2016/01/money-banking-part-1.html
http://neweconomicperspectives.org/2016/02/money-banking-part-6.html
*Taxation can always be used as a dis-incentive for non residents to buy buying Australian agricultural land.
*Laws can be passed so majority shareholders of any agricultural producer cannot be non-resident.
*Government can always at any point in time purchase resources / deposit money into farmers bank accounts to control salinity, avoid farmer insolvency, provide assistance to fight environmental catastrophes, whatever the industry or the issue.
That will get you on track.
Best wishes.
Thanks, Sam W.
Appreciate the considered response, but the concerns remain.
Consider this.
Australia currently has two thirds of its securities on issue held by foreign corporations, many of them government owned. So Australia is now handing 10.6 billion Aussie dollars to foreign governments in interest. Next year it will rise to 12 billion.
With the Aussie dollar so low, it is now more advantageous to buy up Australian freehold land than repatriate the funds.
Hence whenever a pastoral property comes on the market the Australian bidders – who usually include neighbours keen to expand – are outbid by foreigners with billions in cash handed to them by the Australian Government.
This would not be happening (1) if Australia, like Brunei and Saudi Arabia, had little or no gross debt. Or (2) if securities were sold almost entirely to Australian residents, as in Japan and elsewhere. Or (3) if the Aussie dollar were at or above the US dollar, as it was for most of 2011, 12 and 13.
Can you see, Sam, that without those three conditions in place, MMT actually hastens the sell-off of Australia’s agricultural land to foreign governments?
@Alan
Sorry only just saw your reply.
“With the Aussie dollar so low, it is now more advantageous to buy up Australian freehold land than repatriate the funds”
Firstly the Australian dollar has been low during the 1990 until the mid 2000’s. Foreign companies have always bought treasury bonds (high end corporate welfare).
Those 2 conditions are neither typical/atypical to the Chinese need for bidding on agricultural land. Or we’d have seen these large sales in the 90’s.
What has changed is under the Keating, Howard government the Australian foreign investment rules were relaxed and Chinese see buying land is 1.now possible. 2. Has been encouraged by previous governments/The big sales have been approved by Morrison/Hockey (as this is their ideology). 3. Seen by china as safer than buying the produce from the market. (the demand is there).
Insofar as you seem to think this is MMT its nothing of the sort and more of the free market fundamentalism that successive governments have pursued.
As far as MMT contributes to this in a very broad sense with the floating exchange rate and ‘gross debt’ but saying ‘if only these broad reaching variables were set differently’ entails changing just about everything else (many good things we take for granted about Australia’s cumulative prosperity).
http://aofm.gov.au/statistics/non-resident-holdings/#Non-resident_holdings_of_Commonwealth_Government_Securities_Treasury_Bonds_Treasury_Indexed_Bonds_Treasury_Notes
Maybe have a read of this to see the inverse of the arguments about ‘debt/china holding USD/AUD’:
http://moslereconomics.com/wp-content/powerpoints/7DIF.pdf
The issue is simple: 1. Don’t allow the sale of these medium/large farms to the external sector in the first place. (Foreign Investment Review Board can stop it). 2. Don’t bother with badly negotiated free trade agreements that destroy profitability of Australian farmers. 3. Have a government that has the appropriate fiscal policy to support farmers and the fragile environment they operate with.
@Alan, Sam W has done a great job examining many points particularly we can solve farm land sales by banning them! You or I can’t go to Asia and buy their land. They’re much smarter than us as they haven’t flown for the turbo neo-liberalism we have.
In regards to interest it’s still AUD so eventually needs to be spent in Australia. Make the problem illegal instead of worrying about the other issues. Like bill has listed about before instead of a financial transaction tax (FTT) ban non-productive speculative financial behaviour with no purpose for the common good!
Here the quote from his article:
“Solution: All governments should sign an agreement which would make all financial transactions that cannot be shown to facilitate trade in real good and services illegal. Simple as that. Speculative attacks on a nation’s currency would be judged in the same way as an armed invasion of the country – illegal.
This would smooth out the volatility in currencies and allow fiscal policy to pursue full employment and price stability without the destabilising external sector transactions.”
https://billmitchell.org/blog/?p=5932
Also in regards to bonds Japan is still selling 30 year bonds after negative interest rates. Australian bonds pay interest so actually increase the money flowing into the private sector to be spent. It’s a good thing!
You really really should read warren Moslers 7 deadly innocent frauds link posted above. It’s essentially the starting point if you want to understand MMT.
I know you’re an avid writer on indecpemdemt media so it would delight me if you start to understand MMT and can spread the word. John B Kelly writes quite a lot on aimn website about it you should read his work.