I am late today because I am writing this in London after travelling the last…
Coming down the face
Today the ABS released the Labour Force data for January 2010 and there was quite a strong growth in employment reveals, albeit it was dominated by part-time growth. The employment boost confounded the “markets”, some of the so-called experts had “factored in” contraction (so I guess their clients are dudded by their incompetence again!). With participation constant, the net jobs growth translates into solid reductions in unemployment. Unfortunately, total hours worked plummetted so I suspect it will be a grinding part-time led recovery. But the good news is that unless something bad happens elsewhere in the World we are now well over the aggregate unemployment rate peak and surfing down the face!
The summary ABS Labour Force results for January are:
- Employment increased 52,700 (0.5 per cent) with full-time employment accounting for 30 per cent of the increase.
- Unemployment decreased 22,300 (-3.5 per cent) to 612,000.
- The official unemployment rate decreased 0.2 percentage points to 5.3 per cent.
- The participation rate remained steady at 65.3 per cent but is still well down from its most recent peak (April 2008) of 65.6 per cent. So the approximate number of workers that have dropped out due to falling hours of work in the downturn (that is, the rise in hidden unemployed) is 71 thousand persons.
- Aggregate monthly hours worked decreased 14.8 million hours (-1.0 per cent) which is still 2.9 per cent below the July 2008 peak.
The ABC News reported that the “Australian labour market has stunned economists for a third straight month, with more than 50,000 new jobs created in January”.
A senior economist from a major investment bank said (she had told reporters that her forecast was 5,000 lost jobs for January) (Source):
It’s a big surprise. It’s beaten our expectations and the market’s by substantial margins … Obviously it keeps a March rate hike on the table, despite the RBA’s silence last week.
This is a key factor for the RBA, amid signs that there’s much less spare capacity than they thought. Clearly in the labour market, there’s far less spare capacity than they thought. They’ve got to be thinking that rates need to be moving higher. We haven’t changed our view. We have a 5 per cent target by year-end.
Once again the business economists have no real idea of what is going on at present. Not only missing the boat today, they mostly all got this month’s RBA decision wrong. But all of them are now talking up a rate rise in March again – I guess thinking 1 out 2 forecasts will have to work.
But the point that worries me about the commentary above – and I used this particular statement above as representative rather than attacking the particular person – is that all the so-called experts are also claiming we are starting to experience a very tight labour market – “there’s much less spare capacity than they thought” type of hype.
Didn’t she notice that total labour underutilisation remains (at last estimate) at 13.5 per cent?
Didn’t she notice that aggregate hours worked fell by 14.8 million hours or 1.0 per cent and are still 2.9 per cent below the July 2008 peak. And at that peak total labour underutilisation was 10.0 per cent – that is, 10 per cent of available and willing labour resources were being wasted by our economy?
Didn’t she notice that more than 1/4 of 15-24 year olds are idle in one way or another?
A more reasonable interpretation is that the RBA knew full well that the recovery is still relatively weak and there is a lot of spare capacity in the system left to bring back into productive use before inflation is a threat.
Another so-called senior strategist from a securities firm said (Source):
Inflationary pressure is firmly on the upside and the Reserve Bank will resume hiking soon. I’m still staying with March.
Apart from all the questions above that this character should also answer, where exactly are the inflationary pressures coming from? Wages growth is low; the dollar is strong; labour underutilisation is barely moving downwards and working hours fell!
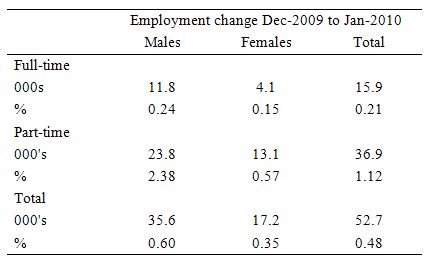
The following table summarises the employment changes since December for males, females and overall. The dominance of part-time employment growth is clear.
The growth in full-time work was extremely muted and makes the following comment by another so-called senior bank economist look ridiculous (Source):
These are great numbers for the economy. This is the sort of jobs growth you get at the peak of booms, not when you’re just at the early stages of recovery.
This will feed through to so many things, from confidence to consumption to the budget bottom line. But it also means unemployment is getting down to lows that can generate wage pressures, and that must be of concern to the Reserve Bank. These figures will put a lot of pressure on them to hike in March.
Since when has the top of any boom been dominated by part-time employment growth?
It confirms for me how our societal perceptions of what a good economy looks like have deteriorated significantly over this neo-liberal period of high labour underutilisation.
However, the employment growth is not to be downplayed. Unless we get a further negative shock coming from the world economy or the government gets pressured into a really harsh May 2010 budget we are well beyond the unemployment rate peak and policy should move to ensure there are more working hours available and more jobs being created.
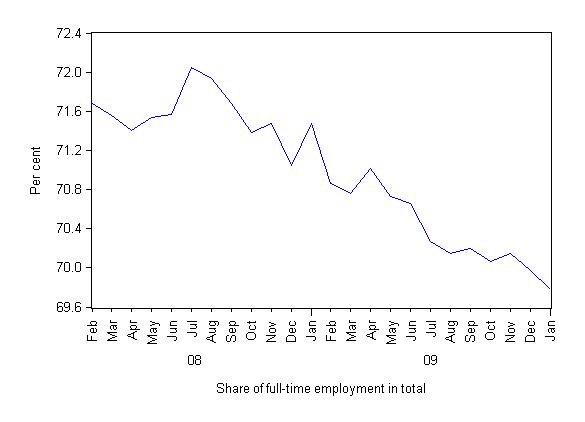
But with the movement in hours being negative I suspect that as unemployment falls we will see further rises (or an extremely slow decay) in underemployment. This is suggested by the following graph, which shows the share of full-time employment in total employment (%) since the downturn began in February 2008.
The salient point is that full-time employment always falls as the economy goes into recession and grows modestly as recovery resumes. At present despite the recovery in employment growth which has been consistent for 3 months, the share of full-time employment has continued to decline.
Unemployment
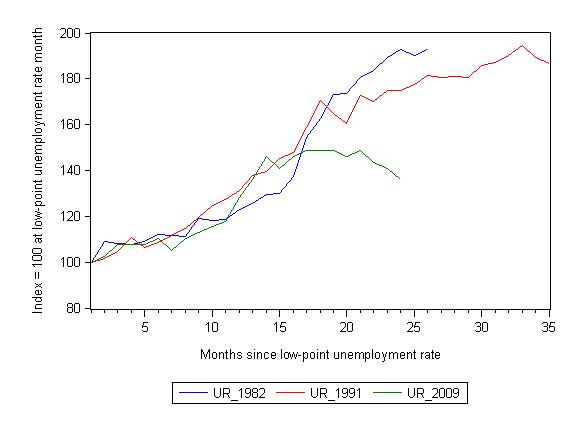
The following graph updates my 3-recessions graph. It depicts how quickly the unemployment rose in Australia during each of the three major recessions in recent history: 1982, 1991 and now 2009. The unemployment rate was indexed at 100 at its lowest rate before the recession in each case (June 1981; November 1989; February 2008, respectively) and then indexed to that base for each of the months until it peaked. It provides a graphical depiction of the speed at which the recession unfolded (which tells you something about each episode) and the length of time that the labour market deteriorated (expressed in terms of the unemployment rate).
From the start of the downturn to the 24-month point (to January 2010 – the length of the current deterioration since February 2008), the official unemployment rate has risen from a base index value of 100 to a value 136 – a 36 percent rise. At the same stage in 1991 the rise was 69.9 per cent and in 1982 83.7 per cent, and both indexes were still rising. So things are clearly very different this time.
While the unemployment rate was tracking the severity of the 1991 recession up until month 16, it is now clear that it is rising more moderately compared to the rate of decline back then. Note that these are index numbers and only tell us about the speed of decay rather than levels of unemployment. Clearly the 5.3 per cent at this stage of the downturn is lower that the unemployment rate was in the previous recessions at a comparable point in the cycle.
The speed at which the unemployment rate is falling is indicative of a favourable outlook given that participation has been stable in recent months. While there was a slight rise in hidden unemployment as the economy slowed, the increase has been nothing like the severity experienced in 1982 and 1991 (as participation rates plummetted).
So the cyclical upswing in participation this time is likely to be smaller which will allow the employment growth to really start working into the unemployment pool. With supportive policy (which regrettably is unlikely to be implemented) we would get back to true full employment under these conditions.
Once again this result is a categorical victory for the use of fiscal policy. Our government implemented the stimulus early in the cycle and targetted it to consumers followed by infrastructure. Some of the components were not ideal nor very effective as it turns out but the overal positive impact on confidence and demand is undeniable.
All those mainstream economists who have for years been telling their students and anyone else that would listen (including governments) that fiscal policy was dead and monetary policy was the only show in town should resign their positions immmediately and never be heard from again. As noted above the shift in the debate in recent months towards the “inflation outbreak” rubbish is really disappointing. These characters are coming out of slime again as cocky as ever.
International comparison
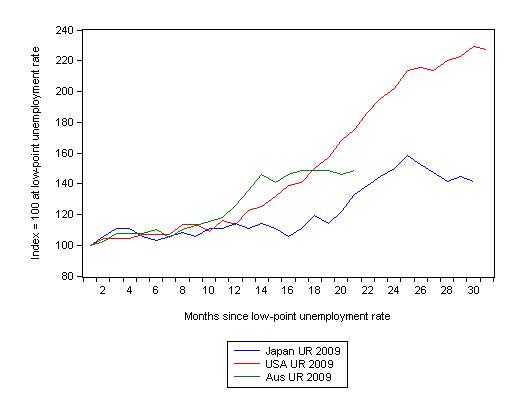
To give you some idea of how the unemployment rate has evolved over the course of this recession in Australia, I created some indexes for Japan and the USA. The rationale is the same as described for the graph above. The low-point unemployment rate in the current cycle for the USA was reached in May 2007 and for Japan in July 2007 for Japan. (Data sources Japan and US Bureau of Labor Statistics).
At a comparable point in the downturn (24-month mark), the unemployment rate is Australia was 35 per cent higher than at the low-point (February 2008), whereas for Japan it was 50 per cent higher and for the US 102 per cent higher (that is, more than doubled).
At present, the Australian unemployment rate was 1.3 percentage points higher than the low-point, while for Japan it 1.5 percentage points higher and for the US a staggering 5.3 percentage points higher.
But the interesting point for me is that despite undergoing a very severe recession with a major collapse in export markets and a drying up of local investment, Japan has not allowed that to proportionally translate into its unemployment rate. A 1.5 points rise is bad but not much worse than the Australian deterioration. This reflects a much more solidaristic way of dealing with society that the west could learn from.
Hours worked
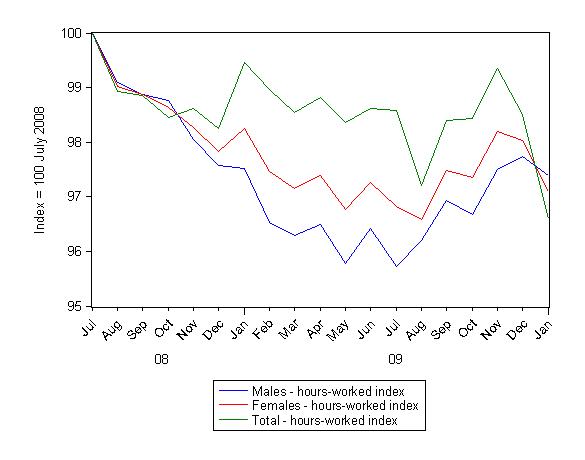
The following graph shows the aggregate monthly hours worked index (July 2008 = 100, which was the peak in the total) for males, females and all persons.
One of the hallmarks of this recession has been the sharp decline in hours worked as firms reacted to the falling sales by adjusting their offering of hours rather than laying off workers.
While this decline in hours worked started to reverse in September (as employment growth resumed overall) it has now been falling systematically since November 2009 and are now at their lowest level since the decline began back in July 2008.
The other interesting thing to note is that while females suffered the least in terms of lost working hours in the recession, that trend reversed in the last month. The fall in the male working hours index overall is now smaller.
However, with males commanding a dominant share share of the growth in part-time work (see Table above) my view that the recovery will not reduce underemployment very quickly is reinforced.
How we are wasting our teenagers
For the last quarter of 2009 (latest data) the ABS reported that 26.3 per cent of 15-24 years olds who were looking for work were idle in one way or another (unemployed or underemployed).
In the first month of 2010, despite general improvement in the labour market the position of 15-19 year olds has deteriorated further.
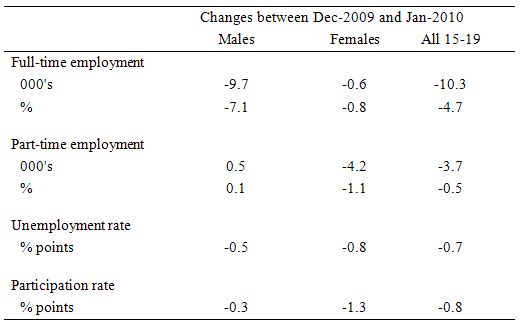
The following table shows the changes (in 000s, % or % points) for the major labour force aggregates for that cohort since December 2009.
There has been a dramatic shrinkage of full employment opportunities particularly for teenage males. Further, part-time work has shrunk for teenagers overall all due to the decline in jobs for females.
Commentators will definitely focus on the headline figure – the slight decline in the teenage unemployment rate. But closer examination tells us that the employment shrinkage is being outweighed by the drop in participation. In other words, more teenagers who wanted to work in December are now giving up looking (the data is seasonally adjusted).
Taken together, the November quarter total labour underutilisation data (next published in February) and the January labour force data, paints a grim picture for our younger workers.
All the beat-up about future burdens and the like in the intergenerational report last week pales into a farce when you think that right now we are wasting the future – our teenagers. A policy priority should be to provide immediate jobs for teenagers who do not want to stay at school and instead are seeking work.
Conclusion
While overall employment growth has been consistent now for some months the dominance of part-time growth is disturbing particularly given the plunge in overall working hours that is now apparent.
I don’t consider the data is consistent with an economy that is close to a boom as the banking economist was trying to tell the media today. It looks very much like a labour market with a lot of slack still that will take a few years to really wipe out if growth is consistent and government policy is well directed to disadvanted groups and regions.
But it remains true that we are in better shape than we thought we would be in which should cause sleepless nights for the neo-liberals – given it is down to the net government spending. I suspect there will be significant historical revision going on as to what actually helped Australia emerge relatively unscathed from the crisis – all manner of things other than the fiscal stimulus will be wheeled out – and most of them will be spurious.
The dominant reason for us being in better shape now is the fiscal stimulus.
The significant rise in the budget deficit underwrited aggregate demand and prevented the labour market from following the path it took in 1991. You can see from the first graph presented that the turning point (when the rise in the official unemployment rate started to flatten out) coincided with the early impacts of the fiscal packages.
You cannot escape that conclusion.
But we still have 612 thousand people unemployed and at last count (November quarter) 895.3 thousand underemployed workers – giving a total labour underutilsiation rate of around 13.5 per cent overall.
The thought that the Government will introduce fiscal austerity measures in the May budget because the so-called experts are telling everyone “it looks like a boom” or “there isn’t much slack left” – sends chills down my spine. Then you would see this recovery slow down and even stall and the pool of long-term unemployed rise even further.
I am still of the view that a further fiscal expansion is required – which should be directly targetted at public sector job creation – which would really eat into this labour underutilisation.
I am alone out there among media commentators saying this.
That is enough for today!
Off topic good news. Randy Wray’s post The Federal Balance Sheet Is Nothing Like Your Household Balance Sheet, So You Shouldn’t Freak Out About Debt on New Deal 2.0 today is mirrored on Business Insider here and at The Huffington Post here. Yves Smith picked it up at Naked Capitalism here. Word is spreading.
There could not have been a better topic than debunking the false analogy of government finance being like household finance. However, Randy doesn’t get into the nitty gritty of MMT, just the distinction between currency issuer and currency user. A good start though. Most of the comments are predictable. It’s going to take some drilling to get through the concrete.
I posted this comment at the various sites. Maybe some folks who want to follow up will show up here:
Wray is saying that a monetarily sovereign government as currency issuer is different from households, firms, states in the US and countries in the EMU, which are currency users. He does not elaborate in this. For follow up, see Bill Mitchell, Barnaby, better to walk before we run, and Stock-flow consistent macro models. Warren Mosler debunks the household-government finance analogy and other persistent myths in 7 Deadly Innocent Frauds.
Bill
I have two queries. You and other commentators refer to the participation rate. Can you explain (or point to where you have already explained this) how the participation rate affects the unemployment rate given that the ABS definition of the unemployment rate is that is the number of unemployed persons as a percentage of the total labour force (which implies the participation rate is not a factor)?
My second query is more complex but probably also has a simple explanation. In the Labour Force data (Table 2 on page 9) under the column heading ‘Unemployed’ there are two columns: ‘Looking for f/t work’ and ‘Total’. For example, in January 2010 there were 444,600 unemployed persons looking for full-time work and the total figure was 612,000. I am assuming the difference is explained by the fact that some unemployed persons are looking for part-time, not full-time work. That’s all good.
But when you move across to the Unemployment Rate column, you find the same headings: “Looking for f/t work’ and Total, expressed as a percentage. For the same month I used above, January 2010, the figures are 5.5% and 5.3% respectively. I don’t understand how the percentage unemployment rate for ‘Looking for f/t work’ can be higher than the percentage for ‘Total’.
Further, when you compare these figures for all months during 2008 and all months during 2009 and January 2010, something weird happens. In all of those 25 months, the figures for the number of unemployed persons looking for full-time work are always lower than the total number of unemployed persons, as you would expect (because the total figure presumably includes those looking for part-time work).
The weirdness happens with the percentage Unemployment Rate column. For all months during 2008 (which can be viewed in the December 08 Labour Force data), the percentage figures for ‘Looking for f/t work’ are always LOWER than the Total figure (as you would expect). But this changes in 2009. For most months in 2009 (and all months since April 2009) the percentage figure for ‘Looking for f/t work’ is HIGHER than the Total. How can this be?
If the reason we’ve weathered the storm so well is due to aggregate demand generated by the government stimulus, and even if unemployment is dropping (I read different statistics here: http://www.roymorgan.com/news/polls/2010/4464/), if the total number of hours worked is rapidly reducing wouldn’t this also mean an aggregate reduction in wages being earned? And wouldn’t this therefore lead to a reduction in aggregate demand? Or are the numbers not significant enough?
Cheers.
I saw the Randy Wray posts as well. The comments following his posts were quite vitriolic to say the least, but its nice to see it getting some headway. This site helps a lot.
Thanks for the link, Tom Hickey. As ds noted, many of the comments were vitriolic, to put it mildly. That just shows the commentators lack strong counterarguments.
This comment was relatively politely expressed, but I found it amusing:
I’m touched by the “kindness” of China and Russia, and impressed by the pomposity of “[t]he middle-brow economic flapdoodlery presented in this article signally fails to take into account human action”, but in preference to “lazy” aggregates, this commentator must prefer to theorise in hard-working fallacies of composition.
Looks like a boom, isn’t much slack left. Right. For certain people, it always looks like there is a shortage of workers. Anyone who has an interest in science or engineering or math has heard endlessly that there is a big shortage of people with those sorts of skills. If you were to take that as career advice, you’d find after graduation that there is an interesting definition of shortage being used, which includes a lot of unemployment and underemployment of all those extra people we have some kind of shortage of. I guess now that applies to the entire economy.
Another great article, especially this: “The dominant reason for us being in better shape now is the fiscal stimulus.
The significant rise in the budget deficit underwrited aggregate demand and prevented the labour market from following the path it took in 1991. You can see from the first graph presented that the turning point (when the rise in the official unemployment rate started to flatten out) coincided with the early impacts of the fiscal packages.
You cannot escape that conclusion.”
Amen, to that.
As for the “vitriolic remarks” to Wray’s article; the blogs are loaded with flat-earth libertarians who are quite strident in their views. Even zero hedge, which makes every attempt to sound contemporary, is much the same.
Mike: As for the “vitriolic remarks” to Wray’s article; the blogs are loaded with flat-earth libertarians who are quite strident in their views. Even zero hedge, which makes every attempt to sound contemporary, is much the same.
This really amazes me. These folks are obviously very savvy about the markets and their interrelationship, but they just don’t get the foundations of it all, which MMT clearly describes. I’ve posted on MMT there, but apparently to no avail (yet). Zero Hedge and Karl Denninger have done some good work documenting the shenanigans and foibles, and I give them both credit for that. But they totally miss the big picture. I can excuse the nonsense comments from the conspiracy theorists, but when savvy market people don’t get it, that is pretty amazing, since it is certainly in their interest to know how the system actually works at the vertical-horizontal level.
I think that as MMTer’s like Randy, Warren Mosler, and Marshall Auerback get more exposure, this will begin to change. Lots of people have a vested interest in knowing this stuff. Marshall, by the way, has been getting a lot of exposure lately, and he seems to be well connected enough to working behind the scenes. So I’m optimistic, even though most of the comments are pretty nutty.
I cruise around some neoliberal and conservative sites to pick up on the buzz. The two bogey-men are “wage-pressure” and “inflationary expectations,” along with the perennial “fiscal responsibility” and “market discipline” memes.
One of the big issues is that cause of the current problem is wages not coming down fast enough. Some think that an across-the-board wage drop of about 8% is needed. There is a lot of railing against unions, both government and non-government, along with “unsustainable and unrealistic” wages, benefits, and pensions plans, all of which need to be slashed. One of the greatest fears is that labor will increase bargaining power as the recovery resumes.
Coincident with this is the constant hype about “inflationary expectations” rising, which need to be stifled by “monetary and fiscal discipline” before these expectations get out of hand, and inflation undermines money as a store of value and causes interest rate hikes that stall investment, productivity, and innovation. Better to tighten a little now, instead of have to go overboard later when inflation threatens to get out of hand and wage-pressure increases.
It’s called paranoia.
I was just over at Yves Smith’s site reading the comments left in response to Professor Wray’s article and I was pretty amazed at the amount of hostility that was expressed. I don’t know why, but I was reminded of that famous Gandhi quote:
“First they ignore you, then they laugh at you, then they fight you, then you win.”
Sometimes I’m not so sure about that last part though.
http://www.whitehouse.gov/our-government/legislative-branch
Tom Hickey this might help with your question from last Sunday.
I always try and come by to learn something and I never leave empty handed.
THANKS
Thanks jo6pac From Poowers of Congress at the link (it doesn’t cite the actual legislation however).
“Part of Congress’s exercise of legislative authority is the establishment of an annual budget for the government. To this end, Congress levies taxes and tariffs to provide funding for essential government services. If enough money cannot be raised to fund the government, then Congress may also authorize borrowing to make up the difference.”
Evie, I will clumsily try to answer your two questions.
Explain how the participation rate affects the unemployment rate given that the ABS definition of the unemployment rate is that is the number of unemployed persons as a percentage of the total labour force.
The participation rate is the percentage of people working or looking for work (the labour force) as a proportion of the total population aged over 15 (according to the ABS, internationally it is generally those aged 15-64).
The unemployment rate is the percentage of the labour force who are looking for full time or part time work and currently not working.
People generally enter the labour force as jobseekers (unemployed) rather than going from not looking for a job to being in a job.
When the participation rate rises, it is generally because people have begun looking for work (and become officially unemployed) rather than because people who weren’t looking for work suddenly have jobs. So the unemployment rate generally rises (or doesn’t fall as fast as it would have with static participation) in the short term when the participation rate rises.
Likewise, when people leave the labour force, it is generally because they have been unemployed and ‘given up looking for work’ rather than quitting their job/retiring, so when participation falls, unemployment generally falls (or doesn’t rise as fast).
For all months during 2008 (which can be viewed in the December 08 Labour Force data), the percentage figures for ‘Looking for f/t work’ are always LOWER than the Total figure (as you would expect). But this changes in 2009. For most months in 2009 (and all months since April 2009) the percentage figure for ‘Looking for f/t work’ is HIGHER than the Total. How can this be?
This is pretty straightforward: prior to the GFC, employment was running at pretty reasonable levels (in neoliberal terms!) and the proportion of part time jobseekers to those working part time was higher than the proportion of full time jobseekers to those working full time. As the GFC impacted on the labour market, full time workers began losing jobs at a greater rate than part time workers (or had their hours reduced and became part time workers themselves, reducing the ratio of part time seekers to part time workers) and became those ‘looking for f/t work’, increasing their proportion above those ‘looking for p/t work’.
Simplified example:
If 4 out of the 100 people who do or would work full time are unemployed and 5 out of the 100 people who do or would work part time are unemployed, then the f/t unemployment rate is 4%, the p/t unemployment rate is 5% and the total unemployment rate is 4.5%
If 2 people lose their full time jobs and become f/t jobseekers, then 6 out of 100 f/t people would be unemployed (6%), 5 out of 100 p/t people would be unemployed (5%) and the total unemployment rate would be 5.5%.
Does anyone know if the mechanics of the EMU work similar to the US in regard to deficit spending? Can Greece simply credit X EUR into private bank accounts or do they have to borrow it first? I’d assume its the same as in the US and they can just create the credit. But I guess they are required to sterilize it by borrowing to make up for the deficit. So is the only limitation on their borrowing the Maastricht Treaty? If the Treaty didn’t exist would there be no funding issue since all Greek deficit spending would exactly offset the deficit? Or would they still have an issue with rising rates since the money created via deficit spending might instead go into German Bunds? Basically, it would be conceivable that capital would be hoarded in German EUR-denominated assets. So couldn’t that same situation happen in the US where the deficit spending is eventually held in the shortest-term US assets (cash) in the central bank of a foreign creditor (trade surplus) nation? If bonds must be issued to sterilize the debt (that’s an accounting rule here in the US, right?) wouldn’t that cause interest rates to rise? And would that high interest rate not be a disincentive for private investment? So perhaps MMT works in a closed economy but can be foiled by sovereigns who are not on the same page (China?). Interested to hear where I may be off…
Patrice
Thank you for taking the time to answer my questions. I think I understand now. The example was very useful.
E.
Hey Tom
When those neanderthals start worrying about wage pressures remind them that if they offer to all take 25% pay cuts they can relieve some of that pressure. Dont talk about it do something about it!!
Its always the OTHER guy that is overpaid.
Oh and BTW Warren Mosler was on CNBC Squawk Box this AM. Not the strongest of performances. He seemed nervous and the hosts were not very engaged with his ideas. The lead guy said something like \”well thats a controversial theory\” and then pretty much cut him off. He did say that this might be a \’start\’ of a conversation.
When those neanderthals start worrying about wage pressures remind them that if they offer to all take 25% pay cuts they can relieve some of that pressure.
Hey, Greg, you forgot, they don’t get wages; they get bonuses, perks, and parachutes. Wages are just for “workers.” 🙂
Yossarian, check these previous posts on the EMU. Bill goes through the structure and functioning of the EMU and issues around its operation in detail.
A Greek tragedy …
España se está muriendo
Doomed from the start
Exiting the Euro?
I hear you Tom
Seriously though, many of the commenters you must be referring to do actually work for a salary. I work with guys who have that same mentality. They see everyone else as overpaid, gripe about minimum wage laws and refuse to even consider a pay cut of their own. Unions are terrible but when WE can “organize” and threaten OUR bosses with coordinated activity that might threaten productivity (patient care) we dont hesitate to do it.
The cognitive dissonance is staggering really. I dont know how their heads keep from exploding with all the contrary views being held simultaneously.
Greg, while I as speaking tongue in cheek above, I’m sure these folks don’t consider themselves in the working class. They are “executives,” “management,” “specialists,” “experts,” “academics,” or for the media folks “pundits” and “celebrities,” and as such individually indispensable. You know, we need them and can’t do without them or the world will end. But workers, well, being fungible, they are individually dispensable.