Last week, I considered recent research published by the BIS - Bank of International Settlements…
Australia’s unemployment rate is well above any reasonable full employment level
Central banks around the world tightened interest rates starting late 2021 in some places and there was a systematic period of hikes over the next year or more despite the inflationary pressures mostly showing signs of abatement as a result of factors that were not sensitive to the rising interest rates. In Australia, the RBA started hiking in May 2022 and continued through to November 2022, despite the inflation rate peaking in December 2022. The RBA consistently claimed the labour market was too tight and that the unemployment rate was below the unobservable Non-Accelerating-Rate-of-Unemployment (the so-called NAIRU), which meant to stabilise inflation in their eyes, they had to force unemployment higher. Their logic was not consistent with reality and tens of thousands of workers have lost their jobs over the last few years as a result of deliberate policy choices all for nothing. The inflation outbreak was not the result of excess spending and came down on its own accord as the COVID constraints abated and supply chains worked around Putin and all that. In this blog post I produce some research that further cements that conclusion. There are some technical details but essentially the narrative should be easy to follow.
Background reading
The following earlier blog posts provide some background conceptual material to help you understand the concept of a U-V ratio and the Beveridge curve.
1. Labour market deregulation will not reduce unemployment (January 11, 2012).
2. Nobel prize – hardly noble (October 13, 2010).
3. Extending unemployment benefits … an omen (March 8, 2010).
4. The unemployed cannot find jobs that are not there! (April 14, 2009).
What is full employment?
When Australia released the path-breaking – The 1945 White Paper on Full Employment – which set the path for several decades of prosperity for workers, it was following the global post-WW2 commitment to nation building and using fiscal policy to ensure there were enough jobs available to meet the aspirations for work by the population.
The 1945 White Paper articulated the Government’s intention to use macroeconomic policy to ensure there were jobs for all, and for several decades the government used various fiscal strategies to maintain very low unemployment (< 2 per cent).
Many desirable trends accompanied this period of true full employment – reduced income inequality, improved health, strong productivity growth, reduced dependence on welfare support and more.
Nations across the world followed this pattern of government intervention.
However, clearly a system that delivered outcomes to workers but impinged on the capacity of Capital to generate massive profits and suppress wages growth, ran afoul of the elites.
While Capital opposed the full employment policies of government, it wasn’t until a major campaign gathered pace in the late 1960s that there was a concerted and organised effort by the elites to unwind the full employment consensus and pressure governments to abandon active fiscal policy.
I gave a talk at a union-organised workshop in Melbourne recently which was focused on how to reassert a full employment agenda.
I noted that the use of large-scale public sector job creation programs, which were common during the full employment period, became unpopular during the 1970s, not because they were not effective in providing work for people when the private economy faltered, but because they offended the elites who wanted governments to create a buffer of unemployment and destroy the capacity of trade unions to effectively represent their members in negotiations with employers.
Capital knew that they could get a larger share of the real income produced each period if governments became their agent in suppressing wages growth and creating a precariat among the working class.
It was the start of the neoliberal period, which persists to now, and has been spectacularly successful in achieving its aims at the expense of most of us.
Our book – Reclaiming the State: A Progressive Vision of Sovereignty for a Post-Neoliberal World (Pluto Books, September 2017) – provides a detailed account of this period.
This blog post – The right-wing counter attack – 1971 (March 24, 2016) – provides some easy to access discussion of the ideological shift and how it was manufactured by the elites representing Capital.
While the link between inflation and unemployment really came into prominence in the theoretical literature in the 1950s, it was weaponised by the NAIRU cult that emerged in the late 1960s as Monetarism started to take over the Academy and economists began to reject the Keynesian way of constructing the economy.
The RBA and most central banks claim that they are legislated to achieve and sustain full employment among other goals.
The trick is that they define full employment in a way that allows them to justify pursuing ridiculously high rates of unemployment while still claiming they are running policy consistent with full employment.
This blog post – Australia’s new White Paper on Full Employment is a dud and just reinforces the failed NAIRU cult (September 25, 2023) – provides more detail on this topic.
For the RBA. full employment means a state where the unemployment rate is equal to their estimate of the unobservable Non-Accelerating-Rate-of-Unemployment (the so-called NAIRU), which is a theoretical unemployment rate where inflation is stable (neither rising nor falling).
While the link between inflation and unemployment really came into prominence in the theoretical literature in the 1950s (
The NAIRU cult emerged in the late 1960s as Monetarism started to take over the Academy and economists began to reject the Keynesian way of constructing the economy.
Regular readers will know that I have written about the NAIRU concept before and have done years of work on the topic:
1. My – PhD thesis – included a lot of technical work (theoretical and econometric) on the topic – beginning in the mid-1980s, when I was just starting out.
2. In my 2008 book with Joan Muysken – Full Employment abandoned – we analysed the technical aspects of the NAIRU in detail.
3. Many refereed academic papers – here.
4. The following blog posts (among others):
(a) RBA appeal to NAIRU authority is a fraud (February 23, 2023).
(b) The NAIRU should have been buried decades ago (December 9, 2021).
(c) The NAIRU/Output gap scam reprise (February 27, 2019).
(d) The NAIRU/Output gap scam (February 26, 2019).
(e) No coherent evidence of a rising US NAIRU (December 10, 2013).
(f) Why we have to learn about the NAIRU (and reject it) (November 19, 2013).
(g) Why did unemployment and inflation fall in the 1990s? (October 3, 2013).
(h) NAIRU mantra prevents good macroeconomic policy (November 19, 2010).
(i) The dreaded NAIRU is still about! (April 6, 2009).
RBA gone rogue
The RBA entered the NAIRU cult like most central banks and justified its interest rate hikes using this concept.
I last wrote about that in this post – Treasurer, please sack the RBA governor and the Monetary Policy Board members – they have gone rogue (July 10, 2025).
The essential facts are:
1. The RBA is still running what they believe is a restrictive monetary policy – that means, quite apart from whether their policy is effective or not, their intention is to force unemployment up further.
Some will say that the RBA has been reducing interest rates since the peak in November 2023, which is true.
The post just cited explains the concept of a neutral rate, however the RBA still considers the current policy rate exceeds it.
2. The RBA still believes the NAIRU is above the current rate of unemployment, which means they think the labour market is still too tight and putting upward pressure on inflation.
As I note in that post, the two claims by the RBA are without foundation in theory or evidence.
Today, I provide some new work I am doing to further that argument against the RBA.
Latest research
One way of approaching this question is relatively simple and uses actual data sets rather than having to rely on using econometric methods to estimate unknown variables as in the case of the NAIRU estimates.
Economists have long used the so-called Beveridge or UV curve to help them understand the labour market.
The Beveridge curve plots the unemployment rate on the horizontal axis and the vacancy rate on the vertical axis as shown in the following diagram.

The logic is that movements along the curve are cyclical events and shifts in the curve are alleged to be structural events.
So a movement “down along the red curve” to the south-east suggests a decline in the number of jobs available due to an aggregate demand failure, while a movement “up along the red curve” indicates improved aggregate demand and lower unemployment.
If unemployment rises in an economy where there are movements along the Unemployment-Vacancies (UV) curve it is referred to as “Keynesian” or “Cyclical” unemployment – that is, arising from a deficiency in aggregate demand.
However, the notion that there is a neat decomposition between shifts in and movements along the curve is highly contested and has not been reliably established in the empirical or theoretical literature.
One of my earliest papers, which came from my PhD work – The NAIRU, Structural Imbalance and the Macroequilibrium Unemployment Rate – published in 1987 in the Australian Economic Papers, 26(48), pages 101-118 – showed that structural imbalances (supply constraints) can be the result of cyclical variations and can be resolved, in part, by attenuating the amplitude of the downturns using fiscal policy.
In other words, there is no decomposition as the mainstream would like us believe.
My later work has clearly shown that almost always UV shifts have been associated with major recessions which generated structural-like changes in the labour market.
In other words, the shifts are driven by cyclical downturns (aggregate demand failures) rather than any changes in autonomous supply side behaviour (like worker attitudes changing, or welfare policy introducing distortions to incentives, etc).
However, we can still use this framework to think about some minimum unemployment rate that we might aspire to.
There is never going to be zero unemployment because people move between jobs and that takes time.
So we are thinking about what is an irreducible minimum, above which economists Pascal Michaillat and Emmanuel Saez called the “nonproductive use of labor—both recruiting and jobseeking”.
See their 2022 paper – u* = √uv – for further discussion.
I deploy their method here.
We want all workers who want to work to be working and earning income and producing things that are useful (abstract at this stage from degrowth considerations relating to desirable and undesirable work).
Time spent looking for work and/or looking for workers to employ is a cost to the nation and should be minimised.
We can measure that cost within a UV framework by summing the unemployment and vacancy rates – u + v – and the policy goal should be to minimise it.
u is an indicator of labour supply – so the “amount of jobseeking”, while v is an indicator of labour demand – so the “amount of recruiting”.
u and v vary inversely because aggregate activity reduces u and increases v and when there is no shifts in the UV curve going on, the two move symmetrically in opposite directions.
The goal of the policy maker then is to get unemployment down to match the current level of unfilled vacancies.
If that level of unemployment is considered excessive then the government itself has a responsibility to simultaneously create vacancies to absorb the unemployed, in other words create a buffer stock of jobs – which was the logic I followed in developing the Job Guarantee concept.
With that last caveat given, we can define a the minimum non-productive use of labour as u = v because if u > v then the labour market is slack and wasting more labour than it should, and vice versa.
The uv ratio thus becomes a measure of labour market tightness or slackness.
1. u > v – excessive slackness (unemployed wasting time)
2. u = v – minimum waste
3. u < v - excessive tightness (employers wasting time) For a given UV relationship (that is, one not being disturbed by sudden shifts), the next step requires some mathematics which I will spare you from. Essentially, we can define the unemployment rate that minimises the "non-productive use of labour" by a formula linking u and v. Specifically, we take the geometric mean of the unemployment rate and the vacancy rate, to get the irreducible minimum unemployment rate for a given position of the UV curve. This allows us to assess the RBA's position with respect to the labour market and the validity of their monetary policy stance.
Data
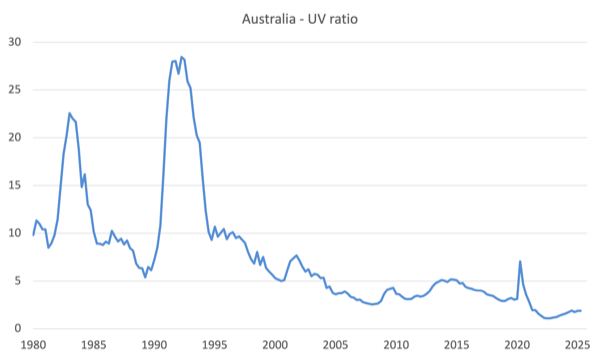
Noting that for a given UV position, u=v defines our desired minimum, the following graph of the ratio of unemployed to vacancies tells us that since 1980s, the Australian labour market has never achieved that goal.
The two major recessions are apparent, when unemployment skyrocketed.
At present, there are around 2 unemployed persons per unfilled vacancy.
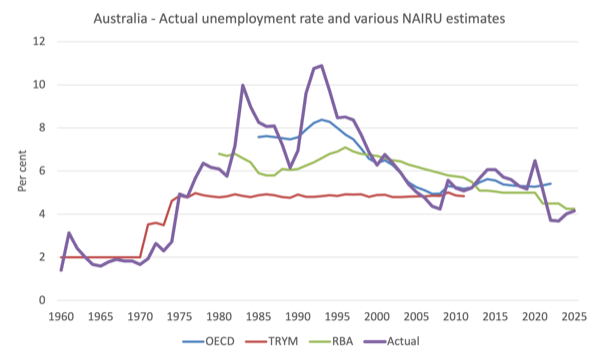
The next graph shows the actual Australian unemployment rate since 1960 (annual data) and various NAIRU estimates provided by the OECD, the old Treasury TRYM model and the RBA.
What you see is NAIRU nonsense.
The NAIRU estimates are highly variable – which makes determining whether the actual situation is above or below the NAIRU impossible – which means that policy settings that depend on whether the actual is above or below the so-called equilibrium are impossible to make.
In other words we are in the world of witchdoctors.
Now what about the unemployment rate that minimises the “non-productive use of labour” – which I will label ur* – which is the rate at which we would conclude that there is ‘full employment’ subject to qualifications about forces that could and do promote shifts in the UV relationship?
The following graph shows the time series since 1980 for my estimate of ur* and the RBA NAIRU estimates.
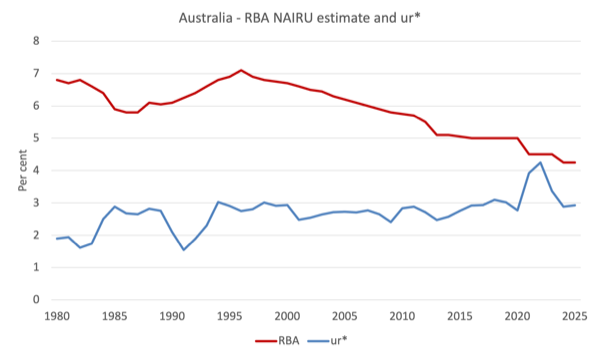
Note: be careful to understand that my ur* estimate is not what I consider to be the irreducible minimum unemployment rate.
Rather it is the minimum unemployment rate that we can achieve given the level of unfilled vacancies at any point in time.
Of course, government policy can simultaneously reduce both through public sector job creation schemes, which is why they were so effective in the pre-neoliberal era.
In fact, the government could drive ur* down to well below 2 per cent if it had the inclination.
The method is easy and known – create employment.
Note also that I haven’t integrated the nearly 6 per cent underemployment into this framework as yet.
Conclusion
The conclusion is obvious.
Operating within the mainstream NAIRU narrative has meant that unemployment rates have been deliberately held at elevated (wasteful) level for no functional economic reason.
Even with unemployment rates at lower levels than have been experienced in recent decades, there is still scope for more reduction.
Yet, the RBA is trying to push unemployment up higher.
That is enough for today!
(c) Copyright 2025 William Mitchell. All Rights Reserved.
Bill,
An excellent, comprehensive historical blog on unemployment and the NAIRU. Your work IMHO in this area hasn’t been surpassed. It was your work on unemployment years ago that attracted me to your research.
Best Wishes
Wayne