Last Tuesday (May 12, 2026), the Australian Treasurer introduced the 2026-27 Fiscal Statement (aka Federal…
The NAIRU/Output gap scam
There is a campaign on the Internet calling itself CANOO (the Campaign against nonsense output gaps) which one Robin Brooks, economist at the Institute of International Finance and former Goldman Sachs and IMF employee, is pursuing. You cannot easily access his written memos on this because the IIF forces you to pay for them. However, there is nothing novel about his claims and the points he is making are well-known. However, they are points that are worthwhile repeating at loud volume because the implications of the ‘nonsense’ are devastating to the well-being of workers, particularly those most vulnerable to precarious work and unemployment. So while the CANOO is just dredging up old issues I am very glad that it is. The concept of biased estimates of output gaps and so-called ‘full employment unemployment rates’ goes to the heart of the way the neoliberal economists, who dominate policy making units in government and places like the IMF, the OECD and the European Commission, create technical smokescreens to justify their dirty work. The more people find out about the basis of the scam the better. I have been working on this issue (estimating, writing and publishing) since the late 1970s as a graduate student. So welcome Robin Brooks, and make a lot of noise.
The following blog posts are background to today’s blog:
- The dreaded NAIRU is still about! (April 16, 2009).
- NAIRU mantra prevents good macroeconomic policy (November 19, 2010).
- Structural deficits – the great con job! (May 15, 2009).
- Structural deficits and automatic stabilisers (November 29, 2009).
There is a campaign on the Internet calling itself CANOO (the Campaign against nonsense output gaps) which one Robin Brooks, economist at the Institute of International Finance and former Goldman Sachs and IMF employee, is pursuing.
You cannot easily access his written memos on this because the IIF forces you to pay for them.
However, there is nothing novel about his claims and the points he is making are well-known.
My own PhD work was, in part, about this exact issue and my work as a 4th year student at the University of Melbourne (1978) was, in part, about these issues.
So it is good that others, who are certainly not in the MMT camp nor would be considered part of the progressive group of economists, are also picking up on this issue.
Here is the issue.
The idea of an output gap is conceptually sound – it is pretty clear that we can conceptualise some potential output level beyond which the productive system cannot squeeze any more real output without extra resource capacity being added (capital, labour, land, etc).
The idea of a current level of production is clear enough although measures of GDP are deficient for what they include (for example, pollution) and exclude (for example, home production).
So the difference between the two is easy enough to get our heads around. It is also fairly easy to understand the concept of a macroeconomic equilibrium unemployment level where the conflicting distributional nominal income claims between workers, capital and government are consistent, albeit for a transitory period, with the real output available for distribution.
My PhD (and early publications) were, in part, about theorising and operationalising this idea with a path-dependent system.
However, as they say, the devil is in the detail.
In this case, the measurement phase and the way ideology distorts the calibration of these terms and then imposes pernicious policy interventions using the distorted calibrations as a (faux) authority, is the problem.
You can pick up on the CANOO stuff from Robin Brooks’ Tweet history.
Among the points he is making:
1. “CANOO: the the Euro zone includes the strongest growth story in the G10 (Germany) and the weakest (Italy, Greece). This means that fiscal transfers from Germany to places with large, persistent output gaps HAVE to be part of the solution.”
2. “Other periphery countries where Commission NAIRU estimates are up: Greece, Italy, Portugal. Meanwhile, Germany’s NAIRU estimate is down more than half. The issue here is conceptual. These NAIRUs are just moving averages of past performance and not indicators of what is possible.
3. “the European Commission says Spain’s structural unemployment rate (blue) is higher today (15.8%) than 20 years ago (14.7%), such that – with unemployment at 14.3% (black) – Spain’s labor market is supposedly running hot!”
4. “the European Commission says Italy has essentially the same positive output gap as Germany (0.3% above potential), even though Italy’s real GDP per capita since 2007 is down near 10%, while Germany’s is up 12%. This makes NO sense!”
5. “the failure of inflation to rise convincingly in the US has sparked endless debates on “neutral” and what is full employment. What’s remarkable is that there is no such debate in the Euro zone, although core inflation is much lower.”
6. “the Euro periphery has had to rely on internal deval – price & wage declines – to claw competitiveness back, given nominal exchange rates are fixed. The problem is this hasn’t worked. Large, persistent output gaps are the result.”
That should give you a flavour of what he has been writing recently.
His observations are not novel in any way although the average commentator is oblivious to the way in which the economic technocrats in this neoliberal period has perverted the ideas of output gaps and macroequilibrium unemployment rates to bias policy interventions towards austerity.
How better to justify high and persistent mass unemployment rates which can easily be reduced through fiscal policy than to deny the solution.
If we artificially separate so-called ‘structural’ determinants from ‘cyclical’ determinants, claim the former are invariant to fiscal interventions, and then redefine the mass unemployment as ‘structural’ then QED.
If you then further claim that the ‘structural’ determinants can be reduced by wage cutting, pension cutting, privatisations, deregulation of all manner of things, income support cutting, outsourcing and all the rest of it, then QED.
You not only justify through appeal to the authority of your sophistry, putting fiscal policy back in the drawer, but you also give a perceived ‘technical’ imprimatur to a range of pernicious microeconomic policy changes that the IMF love to inflict on workers, pension recipients and the most disadvantaged.
Meanwhile, back at the ranch, the top-end-of-town are banking the spoils as national income is redistributed towards profits away from wages and government transfers to the poor.
That is what this issue is really all about.
For example, the so-called – Output Gaps Working Group – is:
… mandated to ensure technically robust and transparent potential output and output gap indicators and cyclically adjusted budget balances in the context of the Stability and Growth Pact.
It receives input from the IMF and the OECD.
So the Dark Side comes together!
The Group is a subset of the European Commission’s Economic Policy Committee, which “contributes to the Council’s work of coordinating the economic policies of the Members States and of the Community and provides advice to the Commission and the Council.”
So taken together, this part of the European Union economic structure is an important part of the overall machinery that disciplines fiscal policy at the Member State level.
It is austerity-central.
If you examine their output in the period since the GFC began you will see that they consistently inform European officials that fiscal deficits in the Eurozone are mostly ‘structural’ in nature rather than cyclical.
This prognosis, not only defies any grasp of reality, but also provides the ‘technical’ justification for the Commission bullying Member States around during their fiscal policy deliberations to ensure deficits are low or non-existent, irrespective of the carnage that that austerity bias has caused.
Sometimes, this bias becomes so absurd that you wonder what void these characters operate in.
Remember back in 2013 when the European Commission was claiming that the Spain’s output was just 4.6 per cent, even though the unemployment rate was 27 per cent.
How did they justify that?
Simple, they assumed that the NAIRU (Non-Accelerating Inflation Rate of Unemployment) has risen to 23 per cent from 8 per cent in 2010.
In other words, they were trying to say that ‘full employment’ was consistent with an unemployment rate of 23 per cent and that attempts to use fiscal policy to reduce the 27 per cent actual unemployment back down to the pre-crisis levels of 8 per cent would be futile and cause accelerating inflation.
Obviously, the Commission was trying to get all and sundry to believe if the Spanish people were unhappy with a ‘full employment unemployment rate’ of 23 per cent, then the solution was obvious – hack into government spending, regulations, ownership, income support schemes, etc.
At no time did the Commission provide any coherent evidence that within a 2-3 year time span there had been massive ‘structural’ shifts in the Spanish economy that could possibly justify their sudden revisions of the NAIRU from 10 per cent to 23 per cent.
Almost anyone with a brain could understand that their NAIRU and Output gap estimates were politicised and part of the depoliticisation process that operates in the European Union to ensure its neoliberal credentials are maintained and implemented, irrespective of the damage they cause to the lower income cohorts across Europe.
I covered that specific piece of chicanery in this blog post – The confidence tricksters in the economics profession (September 25, 2013).
How can ordinary folk understand all of this?
In fact, the concepts are relatively simple and the real hard-core technical details (for example, Kalman filtering etc) does not have to be fully embraced or understood to understand why this issue is important.
I have summarised them often.
Here is the summary again.
The national government’s fiscal balance is the accounting difference between total revenue and total outlays.
So if total revenue is greater than outlays, the balance is in surplus and vice versa.
The fiscal balance is used by all and sundry to indicate the fiscal stance of the government.
So if it is in surplus we conclude that the fiscal impact of government is contractionary (withdrawing net spending) and if it is in deficit we say the fiscal impact expansionary (adding net spending).
However, the complication is that we cannot then conclude that changes in the fiscal impact reflect discretionary policy changes.
The reason for this uncertainty is that there are automatic stabilisers operating.
To see this, the most simple model of the fiscal balance we might think of can be written as:
Fiscal balance = (tax revenue + other revenue) – (welfare payments + other spending)
Notice we have broken up revenue and spending into two broad components.
Why?
We know that tax revenue and welfare payments move inversely with respect to each other, with the latter rising when GDP growth falls and the former rises with GDP growth.
These ‘cyclical’ components of the fiscal balance are called automatic stabilisers
In other words, without any discretionary policy changes, the fiscal balance will vary over the course of the economic cycle.
When the economy is weak – tax revenue falls and welfare payments rise and so the fiscal balance moves towards deficit (or an increasing deficit) – even if the government maintains existing policy settings.
And, when the economy is stronger – tax revenue rises and welfare payments fall and the fiscal balance becomes increasingly positive.
Automatic stabilisers attenuate the amplitude in the business cycle by expanding the government’s net spending in a recession and contracting it in a boom.
So just because the fiscal balance goes into or is in deficit doesn’t allow us to conclude that the government has suddenly become of an expansionary mind.
Thus, the presence of automatic stabilisers make it hard to discern whether the fiscal policy stance (chosen by the government) is contractionary or expansionary at any particular point in time.
To overcome this uncertainty, economists devised what used to be called the Full Employment or High Employment Budget.
In more recent times, this concept is now called the Structural Balance.
The change in nomenclature is very telling because it occurred over the period that neo-liberal governments began to abandon their commitments to maintaining full employment and instead decided to use unemployment as a policy tool to discipline inflation.
The Full Employment Budget Balance was a hypothetical construct of what the fiscal balance would be if the economy was operating at potential or full employment under the current policy parameters (spending programs and tax rates, etc).
In other words, it would calculate the fiscal balance against some fixed point (full capacity), and, thereby, eliminated the cyclical component – the swings in activity around full employment.
The interpretation was then straightforward.
The ‘full employment fiscal balance’ would be deemed to be zero (‘balanced’), if total outlays and total revenue were equal when the economy was operating at total capacity.
If the ‘full employment fiscal balance’ was estimated to be in surplus at full capacity, then we would conclude that the discretionary structure of fiscal policy (the chosen policy settings) was contractionary and vice versa if the fiscal balance was in deficit at full capacity.
And so an ‘industry’ ensued, of which the European Commission’s Output Gaps Working Group is one part of.
The ‘industry’ involved econometricians, technocrats, etc working on ways to calculate the unobservable concepts required to make the concept of a ‘structural’ fiscal balance operational. That is, they sought to generate numbers!
I was part of this industry – working on econometric ways to estimate full capacity. My work always deviated from the ‘official’ methods and results (from the IMF, OECD, various central banks and treasury departments).
This is because, unlike these institutions, I was interested in the reality and using statistical techniques to best capture that reality.
The ‘official’ technocrats were serving political masters who were pushing the neoliberal ideology.
The sticking point centred on how to compute the unobserved full employment point in the economy.
There were a plethora of methods used in the period of true full employment in the 1960s, prior to the neoliberal period (and well before my own work on this topic).
All of these methods had issues, but like all empirical work – it was a dirty science – relying on assumptions and simplifications.
However, the practice really changed in the 1970s and beyond.
At the time that governments abandoned their commitment to full employment (as unemployment rose after the first OPEC oil price shocks) and the concept of the Non-Accelerating Inflation Rate of Unemployment (the NAIRU) entered the debate.
The background blog posts, cited at the outset, provide more detail on this shift.
The NAIRU became a central plank in the front-line attack on the use of discretionary fiscal policy by governments.
It was argued, erroneously, that full employment did not mean the state where there were enough jobs to satisfy the preferences of the available workforce.
Instead full employment occurred when the unemployment rate was at the level where inflation was stable and the NAIRU proponents then invented a number of spurious reasons (all empirically unsound) to justify steadily ratcheting the estimate of this (unobservable) inflation-stable unemployment rate upwards.
This occurred at a time when actual unemployment was rising sharply around the world.
The point was that the NAIRU gang convinced governments that this rise in official unemployment rates was ‘structural’ (the NAIRU has risen) and could not be addressed with the conventional fiscal policy expansion.
At this point the political Left became lame buying into all the stuff about the ‘fiscal crisis of the state’ and failed to offer a strong resistance to this burgeoning neoliberalism.
Our recent book – Reclaiming the State: A Progressive Vision of Sovereignty for a Post-Neoliberal World (Pluto Books, September 2017) documents that failure in detail.
The NAIRU has been severely discredited as an operational concept but it still exerts a very powerful influence on the policy debate.
Further, governments have become captive to the idea that if they try to get the unemployment rate below the ‘estimated’ NAIRU using expansionary policy then they would just cause inflation.
I won’t go into all the errors that occurred in this reasoning.
Our 2008 book – Full Employment Abandoned with Joan Muysken is all about this period.
Now I mentioned the NAIRU because it has been widely used to define full capacity utilisation. If the economy is running an unemployment equal to the estimated NAIRU then the mainstream conclude that the economy is at full capacity.
Of-course, they kept changing their estimates of the NAIRU which were in turn accompanied by huge standard errors. These error bands in the estimates meant their calculated NAIRUs might vary between 3 and 13 per cent in some studies which made the concept useless for policy purposes.
But they still persist in using it because it carries the ideological weight – the neo-liberal attack on government intervention.
At the time the NAIRU entered the nomenclature, economists dropped the name “Full Employment Budget Balance” and promoted the name ‘Structural Balance’ to avoid the connotations of the past that full capacity arose when there were enough jobs for all those who wanted to work at the current wage levels.
And to make matters worse, they now estimate the structural balance by basing it on the NAIRU or some derivation of it – which is, in turn, estimated using very spurious models.
This allows them to compute the tax and spending that would occur at this so-called full employment point. But it severely underestimates the tax revenue and overestimates the spending and thus concludes the structural balance is more in deficit (less in surplus) than it actually is.
They thus systematically understate the degree of discretionary contraction coming from fiscal policy.
Further, the NAIRU is then tied in with estimates of the Output Gap, which is the difference between potential and actual GDP at any point in time.
As I note in this blog – Structural deficits and automatic stabilisers (November 29, 2009) – the problem is that the estimates of output gaps are extremely sensitive to the methodology employed.
It is clear that the typical methods used to estimate the unobservable Potential GDP reflect ideological conceptions of the macroeconomy, which are problematic when confronted with the empirical reality.
For example, on Page 3 of the US Congressional Budget Office document – Measuring the Effects of the Business Cycle on the Federal Budget – we read:
… different estimates of potential GDP will produce different estimates of the size of the cyclically adjusted deficit or surplus …
The CBO is representative in the way they seek to estimate Potential GDP. They explain their methodology in this document.
Effectively, the estimated NAIRU is front and centre, so Potential GDP becomes the level of GDP where the unemployment rate equals some estimated NAIRU.
It becomes a self-serving circularity.
Potential GDP is not to be taken as being the output achieved when there is full employment.
Rather, it is the output that would be forthcoming at the unobservable NAIRU. If the estimates of the NAIRU are flawed, then so will the result output gap measures.
That is what the CANOO initiative is about.
The problem is that policy makers make assessments of their current fiscal position based on these artificial, (assumed) cyclically invariant benchmarks.
And, because the estimates of the NAIRU are typically ‘inflated’ (well above what the true full employment unemployment rates are), the conclusion is always that the current discretionary fiscal policy stance is too expansionary (because their methods understate the cyclical component).
Which then provokes the austerity bias – cutting discretionary spending or increasing taxes (mostly the former) when, the reality of the situation is usually indicating the opposite is required.
New Keynesians talk of ‘deficit biases’, when in fact their framework leads to ‘austerity biases’ and elevated levels of mass unemployment and resulting income (production) losses persisting for long periods.
Some numbers
Here are some numbers to make all this more realistic and easier to grasp.
The European Commission provides the – Annual Macroeconomics Database (AMECO) – which is “regularly cited in Commission publications and is indispensable for the analyses and reports”.
It contains their forward estimates for all variables and it contains their evolving estimates of output gaps and the NAIRU.
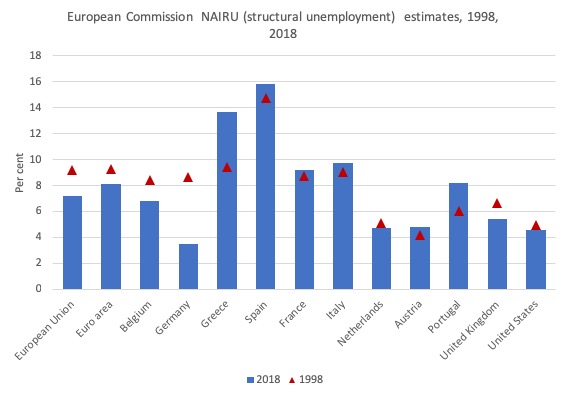
Consider the following graph (the CANOO Tweets provided a more restricted version).
The bars show the Commission’s estimated NAIRU in 2018 while the red triangles show what the estimates were in 1998.
I should add that if I had had graphed what the Commission was estimating the NAIRU was in 1998 back in 1998, the numbers would be quite different.
The estimates are not robust over time. They are in fact a statistical artifact and the filtering techniques deployed mean the estimates are continually altering.
Very unsatisfactory.
The point here is that the behaviour of the EU Member States and the US is quite variable.
The EC is trying to tell us that the full employment unemployment rate in Germany in 1998 was 8.7 per cent and now it is 3.4 per cent.
And they are claiming that Greece has gone from a full employment unemployment rate of 9.4 per cent in 1998 to around 13.7 per cent in 2018, despite all the self-proclaimed (by the Troika) structural ‘improvements’ that the bailout agreements forced on the nation.
One side of the mouth says one thing (a lie) while the other side tells a different lie!
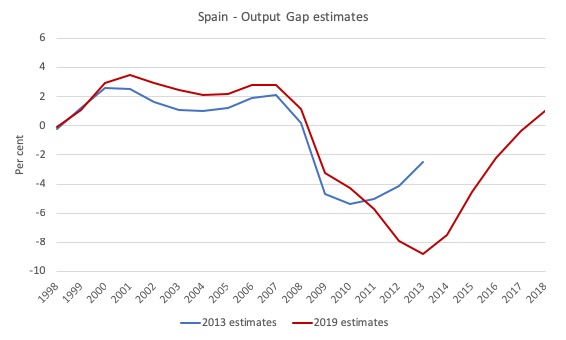
The next graph demonstrates the way time changes the estimates. It shows the European Commission’s output gap estimates for Spain as at 2013 and the most recent estimates.
Clearly, their modelling was trying to portray a situation in 2013, say, that Spain was much closer to full capacity than was the case.
Once the reality evolved, the estimates changed.
So fiscal policy would have been far to restrictive in 2013 for Spain’s actual situation. And the output gap (and NAIRU) estimates provided the cover the Commission needed to inflict unnecessary austerity with the consequence that millions more were unnecessarily rendered unemployed.
So what is going on?
Well it is easy to understand how these NAIRU estimates move up and down. They are simply artifacts of the actual unemployment rate movements.
Consider the following sequence of graphs which show the evolution of the European Commission’s NAIRU estimates and the actual unemployment rate from 1965 to 2018.
When the actual unemployment rate rises, so do the NAIRU estimates.
When the actual unemployment rate falls, so do the NAIRU estimates.
I could go into technical detail about why. But the visual will be enough. I have been studying and working on the econometrics of this phenomenon since the late 1970s (as a graduate student) when all this stuff started to appear to give technical support to the increasing neoliberalism (monetarism, new classical etc in the Academy).
What it means is this – as the actual unemployment rises due to spending deficiencies in the economy, which would normally, pre-Monetarism, demand that the government relaxed fiscal policy (allowed the deficit to rise), the estimated NAIRU estimates also rise.
But, by concept (not construction), these estimates are meant to portray only structural (that is, non-cyclical) forces that are invariant to fiscal policy.
In other words, using Spain as an example, the European Commission was indicating that Spain was at full employment (zero output gap) in 1975 when the unemployment rate was around 5 per cent.
Two decades later, the full employment unemployment (structural) rate had mysteriously risen to 18 per cent.
Then a decade later, fallen to around 11 per cent, only to rise again to 17 per cent (with the 23 per cent estimate cited above disappearing in the oblivion).
Italy’s full employment unemployment rate has risen 2.5 times since 1965. Why? No reason other than the actual unemployment rate has risen by that much due to austerity.
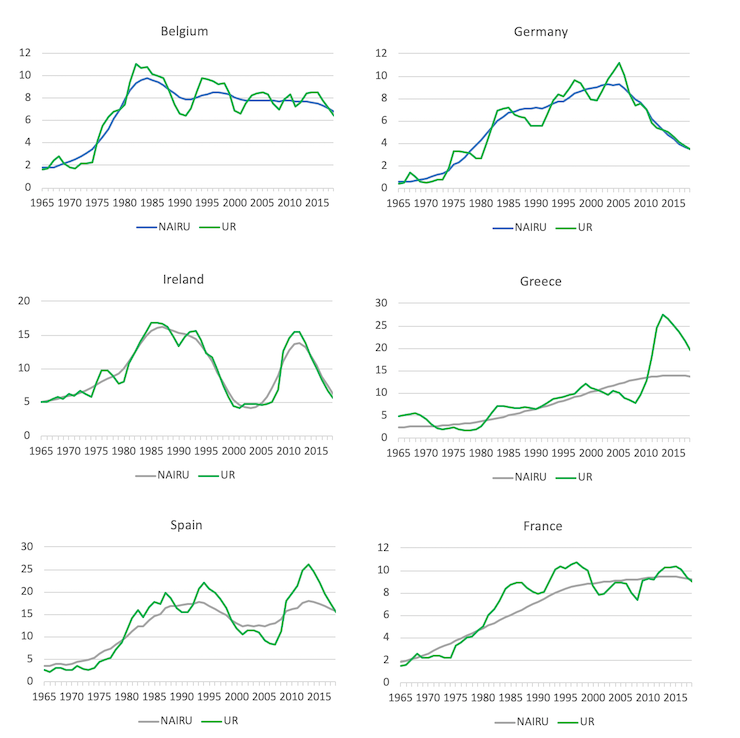
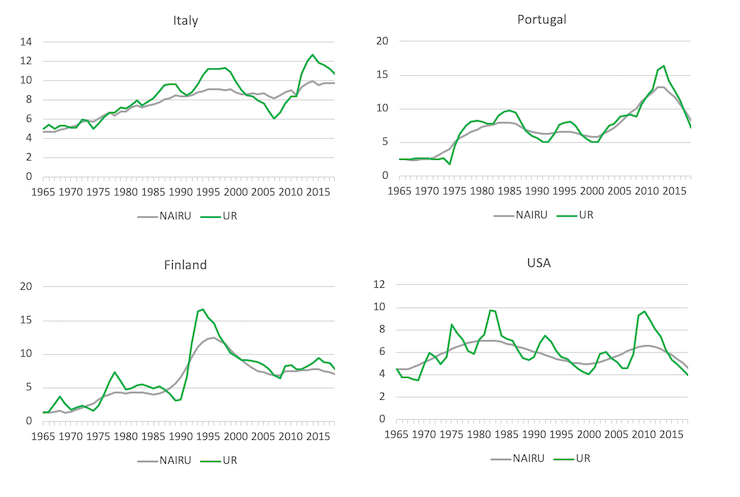
In all these cases, when the estimated NAIRU increases, no ‘structural’ parameters can be found to justify the sudden jumps, as the estimates follow the actual unemployment up as sales decline and firms layoff workers.
It is a scam of the highest order.
Conclusion
Some of my early work focused on the way structural estimates (imbalances) were actually driven by the cycle, thus undermining the whole structural-cyclical decomposition.
With the passage of time, that work stacks up okay.
So while I applaud the CANOO efforts to bring the NAIRU-Output gap scams to the public attention, what is required is a fundamental shift in dominant ideology in policy making circles.
The estimates just reflect the neoliberal dominance in policy making throughout the world.
Small reforms won’t get the job done.
That is enough for today!
Professor Mitchell,
I think that your links to the CBO reports are incorrect.
If I am wrong, sorry for the inconvenience.
Sincerely
Justin Holt
Dear Justin Holt (at 2019/02/26 at 9:28 am)
Thanks for the scrutiny. The CBO has changed a lot of their site. I have relocated the documents mentioned and updated the links.
best wishes
bill
Bill, CANOO (the Campaign against nonsense output gaps) is a dodgy acronym, isn’t it. How about CANOG instead? I realize it doesn’t sound like ‘canoe’; if fact, it doesn’t sound nice at all. But it has the virtue of being more ‘accurate’. 🙂
Dear larry (at 2019/02/26 at 10:59 pm)
Yes, CANNO is a bit odd. But it was not my invention as you know.
I was just the messenger in that part of the story.
best wishes
bill
I’ve spoken before about the conceptualization – inflation is directly and solely linked to too much employment – as a self-serving lie of the wealthy and the powerful. Yea, all the problems of the world come from too many people working, or making too much money for what they do. Yea, it fits in nice with a big pool of unemployed to keep wages down and working people vulnerable and submissive. Inflation never comes from fat people eating too much, or from the wars they fight because of the threat they see to their future diet.
I think this is one of the best pieces I have read from Bill for a while. I’m not an economist but I’m intrigued by the importance of economic theory on political policy and I’m wading through Anwar Shaikh’s massive text book on Capitalism — Competition, Conflict, Crises. I had to look up NAIRU and I was not surprised to see Milton Friedman’s name.
Shaikh takes it back to Imperfection-Based Economics (IBE) — “an infinitely expandable domain, since the starting point is so at odds with reality in the first place. Rather than questioning that improbable foundation it serves to preserve it in an ever-accreting list of deviations from the ideal”
Bill, great piece, as ever, but a missing word ‘gap’ in this sentence I think, re. Spain’s ‘output’ ?
“.. Remember back in 2013 when the European Commission was claiming that the Spain’s output was just 4.6 per cent, even though the unemployment rate was 27 per cent… “
Bill, I went and looked at the 1st old blog you linked, the one from 2009.
I used my engineering training to look at the 1st graph [the one with UE & inflation over time from 1970 on] in it to see what it could tell me.
What I see is 2 entirely different regimes. From 1970 until ’75 they both go up and down together, a direct relationship. Then from 1975 on they have an inverse relationship.
So, I deduce that “something” happened in Aust. or the western world in about ’75.
IIRC, the OPEC oil shock started in ’73 and lasted until the late 70s or even in the early 80s OPEC was still raising oil prices because it could. So, can it be the “something”? Or, must the something be different? What?
.
Now looking at the “updated” graph and combining it with the 1st graph to add inflation to the graph, I have to laugh. From ’75 on the red line is basically flat with just a little noise. However, changes in unemployment are supposed to be related or cause changes in inflation. So, a flat line is used to explain the ups and downs in inflation from ’75 on. Nuts.
. . . BTW – I notice that the red line is flat starting in the same year [’75] that I deduced “something” had happened to radically change a direct relationship into an inverse relationship.
. . . Bill, any ideas on just what that “something” was? It can’t be the OPEC oil shock of ’73, can it?
Well I agree that anyone who says NAIRU can rise from 10% of the workforce to 23% in two or three years (barring cataclismic disasters like civil war) must be barking mad….:-)
‘ It is also fairly easy to understand the concept of a macroeconomic equilibrium unemployment level where the conflicting distributional nominal income claims between workers, capital and government are consistent, albeit for a transitory period, with the real output available for distribution.’
It is fairly easy to understand the concept of a horse with a horn on its head.
Is their any evidence for any economic equilibrium?
Dear Kevin Harding (at 2019/03/01 at 5:19 pm)
You, by way of criticism, ask “Is their any evidence for any economic equilibrium?”
Plenty. Inflation is generally stable and economies do not crash every day.
As I told students in Helsinki yesterday, equilibrium doesn’t mean the current state is good. Keynes’ contribution, in part, was to show the system could come to rest with mass unemployment.
best wishes
bill
Why is the economic theory taught in universities and textbooks developing ideas such as NAIRU that can hardly have any theoretical support?
Why do university professors and Nobel laureates not denounce concepts that are just ideological, such as NAIRU?
What do you think happens to economists who do not denounce these facts?
Pedro,
I think that economists who teach the non-sense get promoted and hired by think tanks to produce papers [for a large ! fee] the exalt the non-sense.
OTOH, those who try to expose the non-sense do not get tenure or even get fired.
inflation generally stable and no daily crashes (financial market crashes?)
is no
‘It is also fairly easy to understand the concept of a macroeconomic equilibrium unemployment level where the conflicting distributional nominal income claims between workers, capital and government are consistent, albeit for a transitory period, with the real output available for distribution’
Current distribution is consistent with ecological disaster .Relative stability is not
equilibrium.