Over the last several years, I have been indicating that I think we are in…
US Bureau of Labor Statistics revisions are not some arbitrary act but an attempt at making the data as accurate as possible
Last Tuesday (September 9, 2025), the US Bureau of Labor Statistics published a news release – Preliminary benchmark revision for March payroll employment is -911,000 (-0.6%) – which told us that its employment estimates for the current year are likely to be significantly overstated. Given that the BLS has been under intense political scrutiny in recent months, with the US President recently sacking the Bureau’s head, I expect some noise from the conspiracy types to accompany this preliminary statement from the BLS. The fact is that when we undertake the adjustment process that the BLS deploys (explained below), the average monthly change in non-farm employment between March 2024 and March 2025 will turn out to be around half the current estimate – 71 thousand as opposed to 147 thousand per month. In other words, when the revisions are finalised in February 2026, the labour market will be assessed as having started slowing considerably in 2024 and continuing into 2025. I explain all this in the following discussion but emphasise that the process of revision is not some arbitrary act to make some politicians look bad. It is actually a process that upholds full transparency and is a regular activity that national statistical agencies undertake to make the data they publish as accurate as possible.
I discussed the problems that national statistical agencies face in the period since Covid began in this blog post – The so-called ‘land of the free’ is now a failed state and heading towards totalitarianism (August 4, 2025).
That post was in the context of the US President’s decision to sack the BLS boss based on his assertion that she had somehow “rigged” the employment data to “make the Republicans (and Trump himself) look bad”.
I noted that there are long-standing conspiracy types who always make allegations about the official data releases of all the national agencies based on some weird conjectures that somehow governments are controlling us with the information they release.
While the conspiracy theories are ridiculous, it is true that the national statistical agencies are finding it harder to produce accurate survey data with response rates lower and attitudinal shifts among respondents to questionnaire modes (for example, increased hostility towards face-to-face interviews).
The latest revelations with respect to the (perfectly normal) process of population benchmarking are sure to give these conspiracy types conniptions.
I thought it would be good to provide an explanation of what is going on, given the amount of misinformation that surrounds these announcements.
In its Tuesday announcement, the BLS said:
The preliminary estimate of the Current Employment Statistics (CES) national benchmark revision to total nonfarm employment for March 2025 is -911,000 (-0.6 percent) …
The annual benchmark revisions over the last 10 years have an absolute average of 0.2 percent of total nonfarm employment. In accordance with usual practice, the final benchmark revision will be issued in February 2026 with the publication of the January 2026 Employment Situation news release.
So what is this about?
Two obvious things are related:
1. A rather large revision to the data for March 2025 will become apparent in February 2026 relative to past average revisions.
2. The revision process is annual – that is a regular part of the data gathering and dissemination process.
The BLS also notes in its accompanying – Current Employment Statistics Preliminary Benchmark (National) Technical Note – that:
The preliminary March revision amounts presented in this release are intended to give a preview of the revisions to the Bureau of Labor Statistics Current Employment Statistics (CES) data released in February of each year. Currently published CES data have not been adjusted to new levels based on these preliminary revision amounts.
That is, the adjustments are made once-a-year and no data will actually be revised until that benchmarking review is undertaken.
Does it signal that the actual data from March 2024 to March 2025 to date has overstated the health of the US labour market?
Absolutely – and by quite a margin.
The BLS is foreshadowing a rather significant revision downwards in employment growth, the full extent which will be revealed in February 2026.
Does this mean the BLS has been making mistakes in its data collection and publishing?
Absolutely not.
These revisions are, in fact, a demonstration of transparency, where the agency calibrates the data already on the public record when more detailed or fuller information becomes available to it.
First, the BLS has various sources of information available to it – some more immediate and others less so – to tell us how the labour market in the US is performing.
The different lags in getting information for various economic variables is a challenge all national statistical agencies face.
For example, Australia publishes a quarterly CPI series but has been criticised because it is not necessarily attuned with the latest price trends.
As a response, it now publishes a ‘monthly indicator’ to give some immediate guidance, but that measure is less accurate because it does not include the full information that is available in the quarterly series.
Surveying and processing of information takes time and when the issue is complex, the lag in getting the data out in an acceptable form for public use is generally longer.
The US BLS uses two major sources of information upon which to assemble employment data:
1. The Establishment Survey (CES) – “produces detailed industry estimates of nonfarm employment, hours, and earnings of workers on payrolls” on a monthly basis.
Some “121,000 businesses and government agencies, representing approximately 631,000 individual worksites” are surveyed each month.
The advantage of the CES is that it provides timely (monthly) estimates on the state of the US labour market.
The main disadvantage is that is a survey with a limited sample, which is subject to two types of error: sampling and non-sampling error.
The sampling error is “directly related to the size of the sample and the percentage of universe coverage achieved by the sample”.
So a small sample is likely to be non-representative of the population and vice versa.
The 121,000 size sample – “covers about 27 percent of the total universe employment” – and in statistical terms that is considered to generate fairly reliable estimates with small variances.
Non-sampling errors relates to deviations from true value as a result of factors not due to random sampling.
So people not answering questions, giving wrong responses because they didn’t understand the questions, self-selection bias (a disjunction between the concepts that the interviewer and the respondent holds (for example, which industry are you working in? A respondent who produces condoms, for example might think they are in the medical goods sector whereas the agency would think they are in the rubber goods sector), interviewer bias, and transcription and data entry mistakes, are all non-sampling type errors.
This BLS explainer – Error Measurement – from the Handbook of Methods is interesting.
While the BLS express sampling errors via the publication of standard errors, they do not measure the non-sampling errors, although they have rigorous internal processes in place to minimise them.
2. The Quarterly Census of Employment and Wages (QCEW) – this is comprehensive covering almost all employers.
The BLS publish – Overview of QCEW Reporting Rates – for the QCEW and the “Percent of QCEW establishments that reported data” is in the high 80s or low 90s on average across the US states.
In terms of the “Percent of QCEW employment reported by establishments” the percentage for the US overall is generally above 96 per cent, which means it is a very comprehensive source of data.
The reason that the QCEW is so broad is that the “counts are derived primarily from state unemployment insurance (UI) tax records that nearly all employers are required to file with state workforce agencies.”
Because the QCEW is a census rather than a survey, it is considered to be more accurate than the monthly survey information.
The BLS also conducts a monthly household survey, the – Current Population Survey (CPS) – which produces labour force data upon which all the labour market aggregates are available.
The BLS prefer to base their employment commentary using the CES (Payroll survey) and use the CPS to publish statistics for “the unemployment rate, labor force participation rate, and employment-population ratio”.
The CPS covers “60,000 eligible households” and the BLS commissions the survey from the U.S. Census Bureau.
Clearly the bases of the CPS (households) and CES (employers) are different and this BLS explainer – Comparing employment from the BLS household and payroll surveys – explains the other differences in the data produced.
Second, let’s work out what benchmarking is.
This BLS explainer tells all – BLS Establishment Survey National Estimates Revised to Incorporate March 2024 Benchmarks.
Every year, the BLS engages in what it calls a:
… re-anchoring of the sample-based employment estimates to full population counts available principally through Unemployment Insurance (UI) tax records filed by employers with state labor market information agencies. The difference between the March population counts and the March sample-based employment estimates is referred to as the benchmark revision.
The August preliminary revisions – which have just been published – are provided to give us a guide as to the scale of the revisions that will be published in February 2026.
At that time, “21 months of previously published data and anchored to March of the previous year” are revised based on the latest QCEW population counts.
Given that the QCEW covers around 97 per cent of total non-farm employment, the BLS then uses some other records, such as data from the Railroad Retirement Board and County Business Patterns to get close to 100 per cent.
The benchmarking revision process unfolds like this:
1. The QCEW employment levels for March 2025 replace the CES March 2025 employment levels.
2. Then the estimates of employment back 11 months from the benchmark month are adjusted using what the BLS call a “wedge procedure”, which is a statistical method that essentially distributes the error found in step 1 across the months in a linear fashion.
For example, when the QCEW estimate of employment came out in February 2025 (it is an annual publication) for March 2024, the latter CES estimate was adjusted downwards by 598,000 (0.4 per cent lower).
Then for the 11 months prior to March 2024, the following changes were made: April 2023 adjusted 1/12 of the difference between the QCEW February 2025 and the CES March 2024 employment estimates; May 2023 2/12 of the difference and so on, with February 2024 being adjusted by 11/12 of the difference.
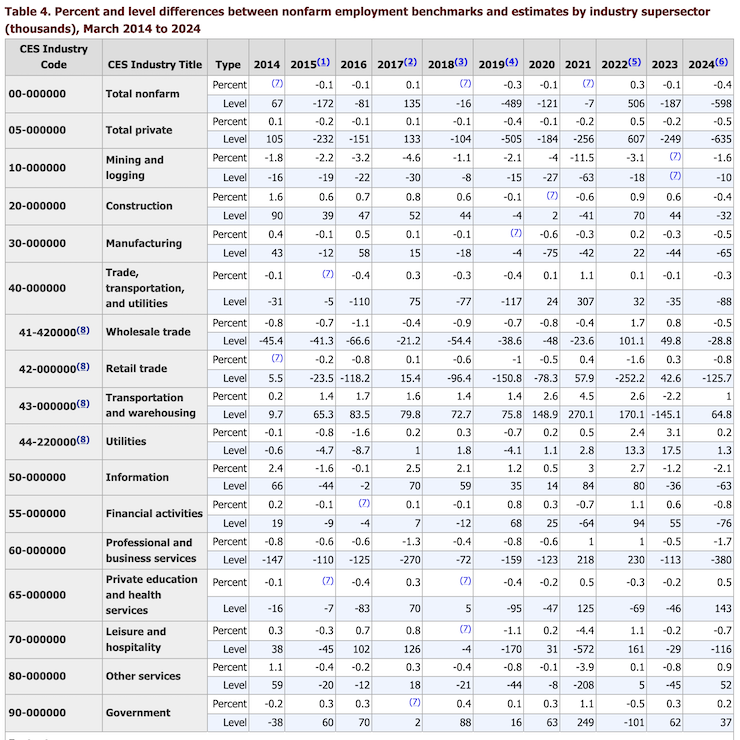
The difference between the March CES result in the previous year and the benchmark employment from the QCEW published the following February varies each year.
This table (Table 4 from the BLS page – BLS Establishment Survey National Estimates Revised to Incorporate March 2024 Benchmarks – provides a complete account of the scale of the revisions from 2014 to 2024 across the whole industry sectors in the US.
Some predictions
Based on the preliminary revisions this is what the revised data might look like in February 2026 when the new benchmarks are available, if the preliminary estimates of the difference between the published payroll employment data for March 2025 and the QCEW employment for March 2025 is 911 thousand.
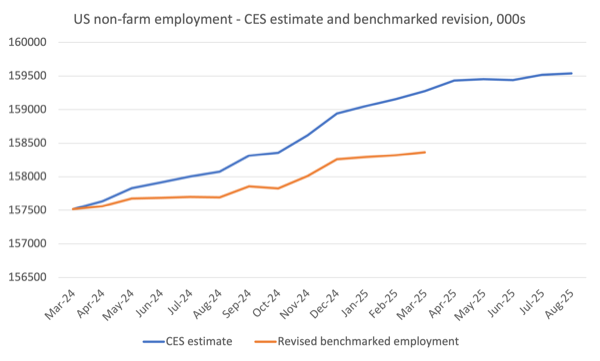
The revised average monthly employment change between March 2024 and March 2025 was reported using the CES data as 147 thousand per month, whereas applying the revisions based on the preliminary benchmark difference would yield an average change per month of just 71 thousand.
That presents a very different assessment of the state of the US labour market – a much slower rate of growth and certainly nothing consistent with the rhetoric that comes out of the White House, inasmuch as one can discern any logic coming out of that place.
Of course, we will have to wait until the February 2027 benchmarks are released to really comment on the performance of the US labour market under Trump.
The revisions noted above apply to the last year of the Biden Administration.
However, the most recent payroll and CPS data does not augur well for the Trump period in office.
Conclusion
Finally, the more the Administration and its supportive commentariat berate the BLS the harder will the BLS job become – because it will make it harder for the agency to collect data.
Just as the anti-vax chorus has made it harder for health authorities to persuade people to vaccinate their children – with the consequence that diseases we had largely eliminated are now coming back.
The point is that this revision process is just standard practice and a difference of 911,000 between the current March 2025 estimate and what it is likely to be when the full data is available via the QCEW is released in February 2026, is really not a very large number.
That is enough for today!
(c) Copyright 2025 William Mitchell. All Rights Reserved.
This Post Has 0 Comments