Last week, I considered recent research published by the BIS - Bank of International Settlements…
Japan sales tax debate continues – Reiwa are the only Party that understands the reality
On July 22, 2025, the – 2025 Japanese House of Councillors election – will be held. I have a good friend who is standing for the – Reiwa Shinsengumi – which is a genuine progressive, Left-wing party, not like the fake progressive parties these days that masquerade as social democratic parties (for example, British Labour, Australian Labor, US Democrats, to name a few of many). My friend is the endorsed candidate for the Kyoto Electoral District (頑張ってね、みなこ). One of the major policies that Reiwa proposes is the abolition of the consumption tax. In fact, this election has spawned widespread opposition to the consumption tax from other parties as well. It has been a highly contentious issue in Japan for several decades and its introduction and regular increases to the present level of 10 per cent reflects the dominance of neoliberal misinformation about the fiscal capacities of the Japanese government. Perhaps, this election we will see some more sensible outcomes.
Background reading
I provided detailed analysis of these historical shifts in these blog posts (among others):
1. Japan thinks it is Greece but cannot remember 1997 (August 12, 2012).
2. Japan’s growth slows under tax hikes but the OECD want more (September 16, 2014).
3. Japan returns to 1997 – idiocy rules! (November 18, 2014).
4. Japan – signs of growth but grey clouds remain (May 21, 2015).
5. Japan about to walk the plank – again (September 30, 2019).
6. Japan national accounts – sales tax rise, growth collapses – as night follows day (February 18, 2020).
Brief history of the sales tax in Japan
- January 1979 – Liberal Democrat government proposed a sales tax to ‘fix public finances’ but was abandoned after the October national election disaster that initially saw the LDP lose the outright majority. The policy was widely condemned.
- February 1987 – Once again the LDP proposed new sales tax legislation to the Diet but it was abandoned in the face of massive opposition.
- December 1988 – LDP (with PM Noburu Takeshita – the so-called ‘shadow shogun’ of Japanese politics on account of his ability to act as a ‘puppet master’ – manipulating outcomes in the background) finally was able to push a sales tax bill through the Diet even though the policy was deeply opposed by the people. Takeshita would be forced to resign the following June on account of his involvement in a corruption scandal (insider-trading).
- April 1989 – the 3 per cent consumption tax becomes operational.
- November 1994 – the rate rises to 4 per cent although the legislation also included a ‘regional consumption tax of 1 per cent’ on top which meant that by 1997, the rate would be 5 per cent.
- April 1997 – rate increases to 5 per cent.
- June 2010 – after being elected in September 2009 to government, the Democratic Party of Japan proposes increasing the consumption tax to 10 per cent in advance of the election of the House of Councillors (upper house). The DPJ is trounced in the election.
- June 2012 – LDP legislation proposes to increase the consumption tax to 8 per cent in 2014 and then to 10 per cent in 2015, which passes on August 10, 2012.
- April 2014 – the 8 per cent rate comes into effect.
- November 2014 – the government of Shinzo Abe postpones the rise to 10 per cent due in October 2015 until April 2017.
- June 2016 – further postponement of the 10 per cent rate to October 2019 amidst massive opposition.
- October 2019 – the 10 per cent rate comes into effect, with a few exemptions (some food and newspapers) which remain at 8 per cent.
The consumption tax is one of the major issues in the upcoming election for the – House of Councillors – in July.
There has always been significant opposition to the tax but it has ramped up and broadened across the political spectrum in Japan as the cost-of-living pressures have increased.
Many are arguing for changes ranging from abandonment, to cuts across the board, to selective cuts.
The ruling LDP has long resisted the demands for changes and invoke the usual mainstream fiscal concerns – that Japan must reduce its public debt, which means it has to raise revenue to reduce its net spending.
Mainstream economists claim that with the ageing population, government spending is rising while revenue is falling as the population ages.
This graph taken from the publication – Japanese Public Finance Fact Sheet (April 2024) – is often wheeled out by economists to justify the sales tax.
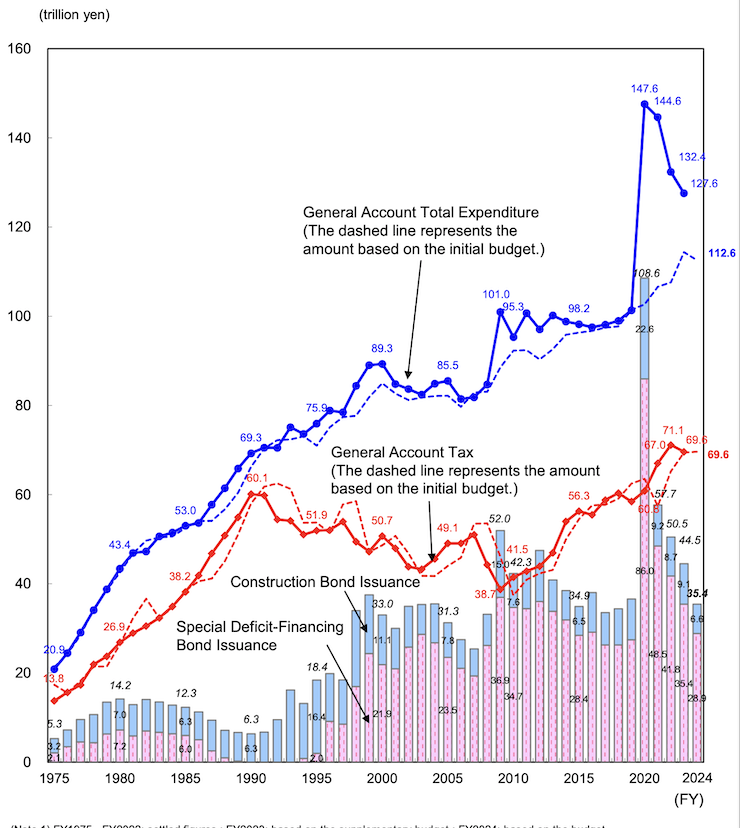
The government’s preferred solution to the cost-of-living crisis is to provide targetted fiscal support (subsidies, etc) to those ‘most in need’ and keep the consumption tax rate unchanged.
Last week, the Japan Times editorial (May 16, 2025) – Don’t overreact to the consumption tax debate – quoted the Chief Cabinet Secretary as saying:
The government does not think it is appropriate to lower that tax rate … it’s an important funding source for the social security system for all generations.
One can see the same old narrative that is wheeled out in most nations by mainstream economists, particularly as societies around the world are getting older.
The fear mongering that social security, pension and health systems will run out of money if these sorts of revenue policies are maintained and strengthened resonate strongly in the community because there is widespread ignorance of the true nature of fiscal capacity enjoyed by currency-issuing governments and the role of tax policy in general.
Most think of taxes as raising ‘money’ for governments, which then allows them to spend on necessary social and infrastructure policies.
Of course – Taxpayers do not fund anything (April 19, 2010).
And if you are struggling with that notion, then start with this introductory suite of blogs:
1. Deficit spending 101 – Part 1 (February 21, 2009).
2. Deficit spending 101 – Part 2 (February 23, 2009).
3. Deficit spending 101 – Part 3 (March 2, 2009)
However, only Reiwa Shinsengum, among the many Opposition Parties opposing the tax, get the argument against it correct.
They argue, correctly, that the Japanese government is the currency-issuer and all the framing of the tax in terms of being an “important funding source for the social security system” is spurious.
They note how damaging the tax has been for struggling Japanese householders and should be scrapped in its entirety.
Last Friday, the LDP held a ‘study session’ in Tokyo to consider the government’s position on the tax and decided to reject any notion of a reduction as part of the policy platform they are taking to the Upper House election in July.
There have been calls within the ruling party to at least exempt all food items from the tax, which sort of undermines its advantage as a broad-based tax.
Apparently, a significant group of LDP MPs wanted the tax on food scrapped.
The modelling suggests that this would boost GDP by 0.43 per cent per annum as overburdened households were able to spend more on necessities.
There is also a rice crisis happening at present (which I will write about later) which is also strengthening calls for a cut in the tax on food.
One of the excuses that the LDP bosses gave for not tinkering with the tax related to the alleged disruption to “cash registers and accounting systems” (Source).
That was dismissed as a “pretext” to do nothing by tax critics.
The impact
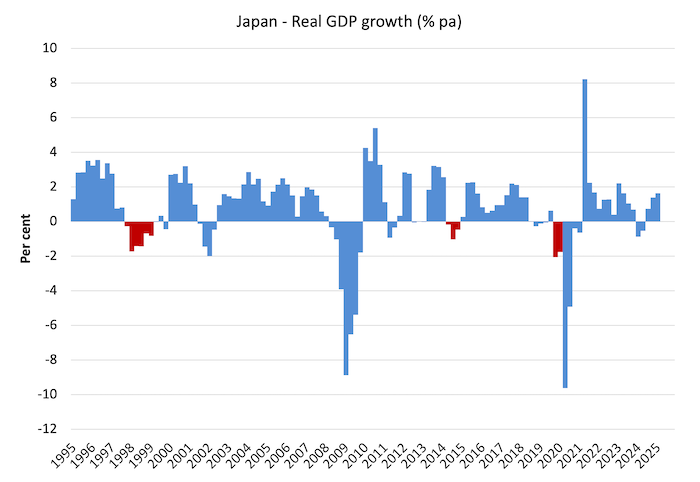
The following graph traces the history of real GDP growth from the March-quarter 1995 to the March-quarter 2025 and denotes the quarters when the successive sales tax hikes came into effect (as per the previous listing above).
The red areas denote sales tax driven recessions.
In the three episodes shown, these recessions were followed by a renewed bout of fiscal stimulus (monetary policy was ‘loose’ throughout).
And in all the episodes, there was a rapid return to sustained growth as a result of the fiscal boost.
Nothing could be clearer.
In the March-quarter 1997, the economy was finally showing signs of recovery from the bubble collapse and grew by 2.8 per cent.
After the Sales Tax hike to 5 per cent in April 1997, growth fell dramatically – minus 0.3 per cent in the December-quarter 1997, then -1.7 per cent March-quarter 1998, -1.4 per cent June-quarter 1997, -1.4 September-quarter 1998, and negative for further two quarters until fiscal stimulus resumed.
Then after the hike to 8 per cent in April 2014, real GDP growth went from 2.6 per cent in the March-quarter, to -0.2 per cent in the June-quarter, -1.0 per cent in the September-quarter, and -0.5 per cent in the December-quarter.
Following the October 2019 hike to 10 per cent, the December-quarter 2019 GDP shrunk by 2.1 per cent, followed by a further fall of 1.8 per cent in the March-quarter, all before the COVID-19 impact really began.
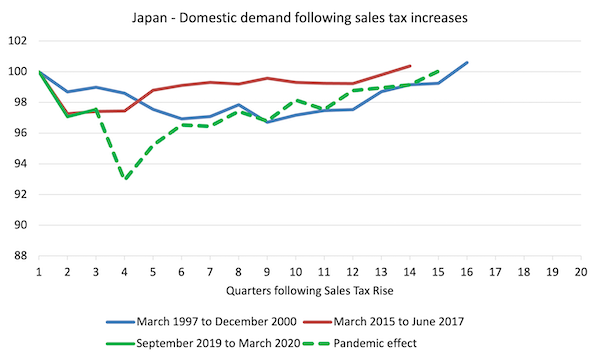
The following graph shows indexes for domestic demand with the index set to 100 in the quarter before the sales tax hike had taken effect traced out until domestic demand reached the respective pre-sales tax hike level (100 in index number terms).
It is clear how damaging the tax hikes have been.
The impact of the 2014 and 2019 were almost identical, although the pandemic came immediately on top of the 2019 downturn.
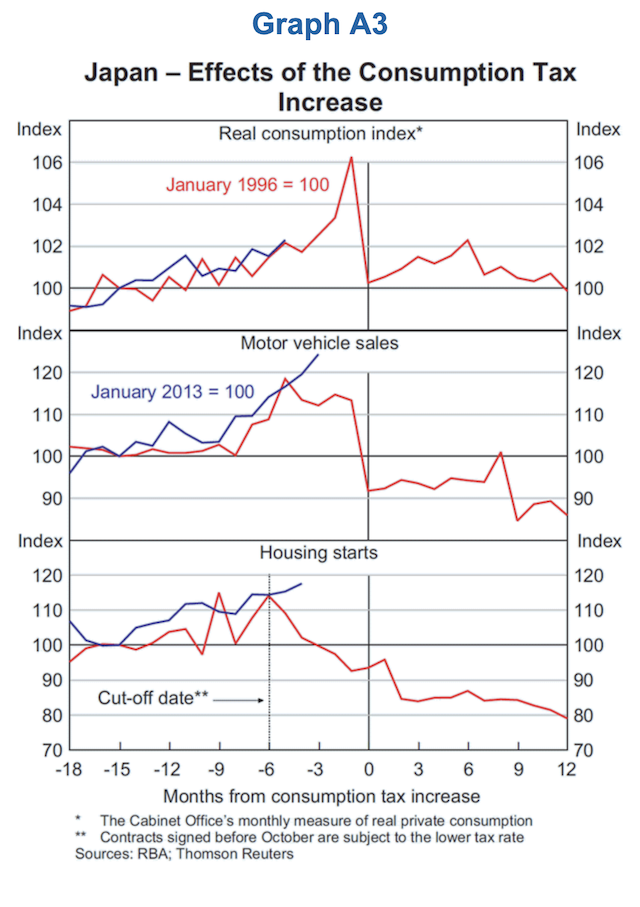
This graph from the Reserve Bank of Australia’s analysis in its – Statement of Monetary Policy – February 2014 – is interesting.
The RBA wrote that after the April 1997 tax hike:
Consumption then contracted after the tax was increased … This pattern was most evident for durable goods, for which there is more discretion in the timing of purchases. For example, motor vehicle sales increased by around 10 per cent in the six months leading up to the tax increase and fell by almost 20 per cent in the following month. Residential investment was also affected by the tax increase (contracts signed before 1 October 1996 were not subject to the higher tax rate) …
Comparisons with Australia
The next graph compares the quarterly growth in household consumption spending from the March-quarter 1994 to the June-quarter 2022 for Australia (top panel) and Japan (bottom panel).
It comes from a book I wrote with my Kyoto colleague Professor Satoshi Fujii that was published last year in Japan (in Japanese).
I left out several quarters in the early period of the Covid-19 pandemic from the graph because they were extreme outliers and distorted the graphs.
The average quarterly growth over this period was 0.85 per cent for Australia and 0.17 per cent for Japan – a considerable difference.
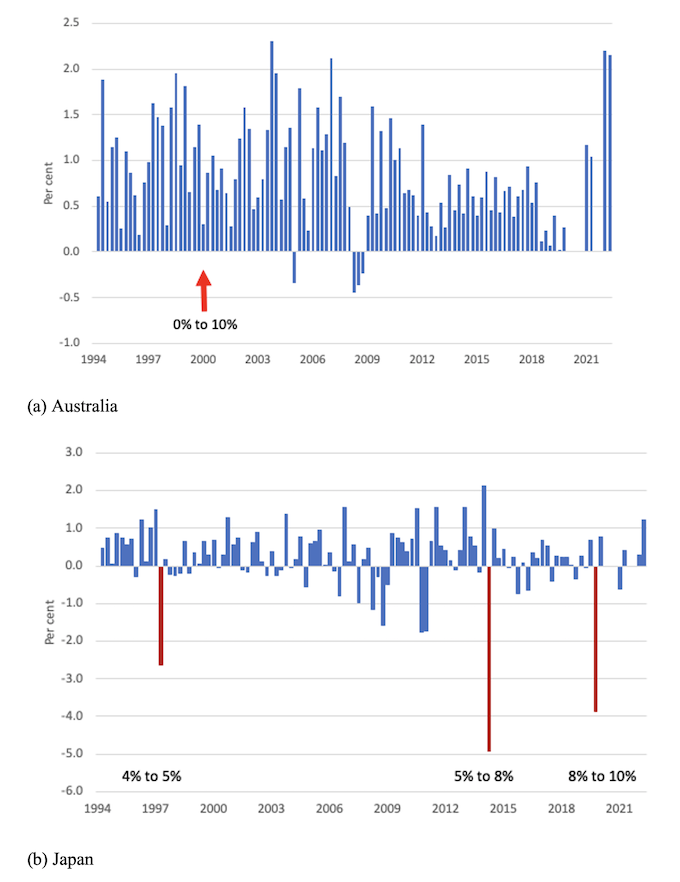
The lower panel for Japan is just a slightly different version of the updated graph above.
The sales tax rises were driven by the political pressure mounting on the government from commentators who claimed the government’s fiscal deficit was too large and the nation risked insolvency.
The Japanese government bowed to the pressure and invoked tax cuts to appease the ‘markets’.
As noted above, the results were entirely predictable.
After setting the economy back on a new growth path after the 1991 bubble burst, the decision to elevate sales tax in April 1997, immediately saw household consumption spending and GDP growth contract.
The same pattern of damage followed the hikes in 2014 and 2019 and demonstrated that growth in Japanese household consumption expenditure is not only, modest relative to, say, Australia (as above), but also highly sensitive to sales tax changes.
By way of contrast, growth in household consumption expenditure in Australia is much stronger relative to the Japanese experience.
The arrow with the annotation 0% to 10% represents the introduction of the Goods and Services Tax (GST) in July 2000, which saw a new tax on many consumption goods and services levied at a starting rate of 10 per cent.
The GST was thus a sales tax akin to the tax rises in Japan.
The introduction of the GST immediately had a negative impact on household consumption growth but nothing like the impact that sales tax increases in Japan had.
What might explain the different sensitivity of household consumption expenditure to sales tax increases in Australia and Japan?
Why do Japanese households react so adversely to relatively modest sales tax rises by comparison to the way Australian households react?
The next graph provides the clue and shows household debt as a proportion of disposable income for Australia and Japan from 1995 to 2020 and helps us understand why the tax sensitivity of household consumption expenditure varies across those two nations.
Australia ranks high among the OECD nations on this measure and household debt has risen from around 67 per cent in 1990 to 188.5 per cent in September 2022.
By way of stark contrast, household debt to disposable income in Japan is highly stable at just over 100 per cent.
Further, in both nations, wages growth has been very low over the period shown in the graph.
What becomes clear is that Australian households kept spending when the GST was introduced, whereas Japanese households dramatically reduced consumption spending, because the former are much more willing to increase their debt exposure when their disposable income is squeezed.
Australians borrow to maintain spending capacity whereas Japanese households cut back spending.
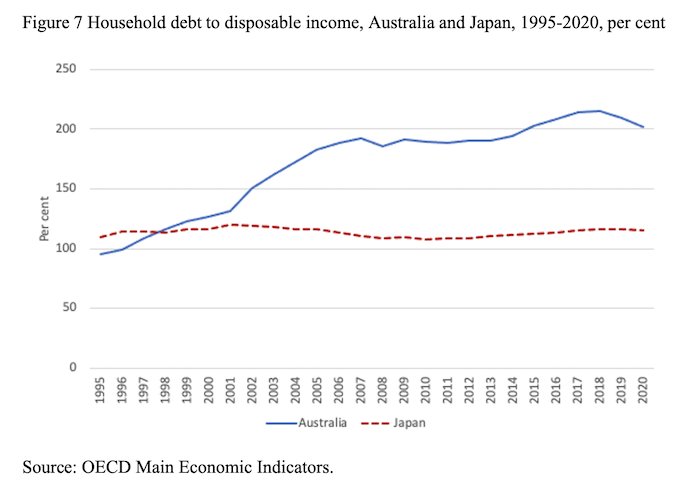
While the increasing burden of debt can have negative consequences (for example, it makes household solvency much more sensitive to interest rate changes), it remains that the greater propensity to take on household debt renders the Australian economy with a greater ability to absorb these type of sales tax increases relative to Japan.
It is surprising, therefore, that the Japanese government used sales tax increases to boost revenue when they should have known that Japanese households were not going to use increases in debt to absorb the impingements on their disposable income.
It is fairly clear, that sales tax increases in Japan will always push the economy towards recession.
This means that when designing optimal policy interventions in Japan, the choice of sales tax variations would seem to be a poor policy choice because the probability that stagnation will follow is very high.
Conclusion
The sales tax is a very effective tool in Japan if the government wanted to suppress domestic demand and generate a recession.
The calls for the abandonment of the sales tax are appropriate because the tax is too damaging given the cultural propensities militating against large household debt increases.
That is enough for today!
(c) Copyright 2025 William Mitchell. All Rights Reserved.
Degrowth requires that the fiscal power be exercised in the form of taxation, with the aim of purposely contracting the economy.
Ecological taxes (on energy use, consumption, resource extraction, and waste production) can be used to generate degrowth by internalizing environmental externalities—by making consumption of non-renewable natural resources unprofitable.
Unfettered consumption is the problem, not the solution.
A guy called JB Clark and his accomplices have eliminated from (neoclassical) Economics the concept of “land” as a particular type of capital, with a “fertility” and thus a “rent”. This was done to counter arguments that “land” generates “rent” thanks to its natural, intrinsic “fertility” and this windfall should therefore be specially taxed.
Also JB Clark and his accomplices have this reduced all “capital” to a single “jelly”, that is to dollars in practice, by using delusional handwaving called the “Cobb-Douglas production function”, in order to “prove” the central truthiness of neoclassical Economics, that absent government regulation income is uniquely determined to productivity, which cannot be proven if there are even just 2 different types of “capital”.
This makes contemporary Economists pretty much blind to the economics of mined energy, and of the unique advantages of extracting it in nearly ready-made form from mineral sources.
For example R Gordon’s argument (of which I have read only a summary) is fatally and let me say grossly and obviously flawed by his misconception that the primary cause of productivity growth is “Great Inventions”, when instead it has been the adoption of fuels, coal first and oil later, which are much cheaper and much more energy dense than ordinary agricultural “food”.
The driver of a combine harvester is more productive than 50 men with sickles not because the dozer is a “Great Invention” that is far more efficient than 50 sickles, but because the diesel powering it is far cheaper and more energy dense than the bread (and maybe cheese) used to feed the 50 men powering the sickles.
A car is far more productive than a horse drawn cart not because the petrol engine is a “Great Invention” that is far more efficient than a horse, but because its “food” (petrol) is much cheaper and lighter than the “food” (oats) powering the horse.
The great waves of productivity growth have been (nearly) entirely driven by the adoption of better (much cheaper, rather energy denser) fuels, and then, yes, optimizing the machinery using them, machinery that is however not very useful scrap without those fuels.
Seen from a pre-JB Clark point of view coal-fields and oil-fields have been the most fertile land ever discovered, capable of a “food” yield many many times larger and many many times cheaper than the most fertile land of Kansas or Ukraine, a fantastic windfall that has driven down dramatically the price of “food” for the past hundred years. It is this immense windfall that has “proven” both Malthus and Marx wrong.
The problem is that a third great fuel, cheaper and energy denser than oil, has not been found yet, and we have already optimized coal and fuel consumption as far as it is feasible, and the marginal fertility of coal-field and oil-field land is falling constantly.
This is indeed in part made clearer by looking at the energy cost of new energy, but it goes further than that.
«Representative agent models are — as I have argued at length here — rather an evasion whereby issues of distribution, coordination, heterogeneity»
But if you mention the Arrow-Debreu-Lucas models, and the Sonnenschein-Mantel-Debreu theorem, you must also mention the “three fables” from J.B. Clark:
https://www.aeaweb.org/articles?id=10.1257/089533003321165010 «Samuelson (1962) called three key “parables”:
1) The real return on capital (the rate of interest) is determined by the technical properties of the diminishing marginal productivity of capital;
2) a greater quantity of capital leads to a lower marginal product of additional capital and thus to a lower rate of interest, and the same inverse, monotonic relation with the rate of interest also holds for the capital/output ratio and sustainable levels of consumption per head;
3) the distribution of income between laborers and capitalists is explained by the relative factor scarcities/supplies and marginal products.»
The Arrow-Debreu-Lucas model assumptions are specifically designed to support the three fables/parables, and in particular number 3, and that is all about distribution. And Economics is all about “internal consistency” with those three fables/parables.
Reiwa’s stance on the consumption tax is bold, but it’s backed by historical evidence — the repeated tax hikes have consistently stalled growth. Hopefully, this election finally moves the debate away from austerity and toward real fiscal understanding.
There’s an interesting, almost upside-down mirror image of the US’s conservative fiscal politics in Japan. Regressive Tax cuts are the hammer Republicans in America reflexively go to, which of course produce a nominal fiscal impact, so the idea as such is never completely discredited. However, with the LDP, given that the fiscal impact of a sales tax increase is immediately perceptible as a burden to the population as a whole–as opposed to cutting public services which typically affects the most vulnerable at first–I wonder to what extent the Japanese actually buy into the arguments surrounding the public debt. What’s keeping this idea alive for so long?
I have a question: In today’s Japan, the unemployment rate is very low, and the country is in a near full-employment state. So wouldn’t simply cutting the consumption tax further accelerate inflation? Or is the idea based on the assumption that the tax system would be shifted to another form? I look forward to your reply.
Would the abolition of wholesale sales taxes (and some other levies) at the same time as the introduction of the GST have any bearing on the sensitivity?
Some politicians (less than 10) are really progressive in Reiwa, but unfortunately, there are many candidates as well as supporters and pundits inside who are illiberal and misogynistic, which makes me hesitate to call the party “genuine progressive”. We can’t find a genuine “fiscal owl party” in anywhere that is liberal and progressive, so depressive.