With an national election approaching in Japan (February 8, 2026), there has been a lot…
Japan thinks it is Greece but cannot remember 1997
Last week (August 10, 2012) the Japanese Parliament approved a bill to double the sales tax (from 5 per cent to 10 per cent) over the next three years. It is a case of déjà vu. We have been there before. The economy suffers a major negative private spending shock. The government’s budget deficit increases as tax revenue collapses. The outstanding government debt rises more quickly than in the recent past. The rising government deficit supports a recovery in real GDP growth. The conservatives start shouting that the government will run out of money, that interest rates will soar and inflation surge and life as we know will end. The government raises the sales tax and cuts back spending. Real GDP growth collapses, tax revenue falls and the deficit and debt ratio continue to rise. We are back in Japan in 1997 – but the only problem is that we are playing out the same story in 2012. The reason – Japan thinks it is Greece but has forgotten about 1997.
This has been the main agenda of the new Prime Minister since he took office in September 2011. There was some political gymnastics to get the bill through with the PMs own party objecting to the increases on the grounds that “it would hurt struggling economic recovery after last year’s natural disasters” (Source)
The opposition (LDP) agreed to the hike in return for a new election. Which suggests they care more about getting another chance at power than they do about the fortunes of the economy.
The Wall Street Journal article (August 11, 2011) – Japan Raises Sales Tax to Tackle Debt – reported the decision of the Japanese government but used what appeared to be a news story to go into full-bore propaganda mode with all sorts of unsustainable claims about the state of Japan’s fiscal situation.
The WSJ say that:
The hard-fought tax increase shows how it is possible for advanced democracies-struggling to curb government borrowing and adjust fiscal policies that have allowed their citizens to live beyond their means for years-to cut government borrowing.
But it also highlights the difficulties. Despite the tax increase, Japan’s spending is still expected to far exceed government revenue for years, and analysts say more tax increases and benefit cuts are needed to address budget shortfalls.
The only reasonable interpretation of a citizen living beyond their means is when they are spending more than they are earning in a flow sense. The earning could come from drawing down prior saving, selling real or financial assets or from labour and other income.
However this gap occurs, the citizen is running down their net financial assets and typically increasing their indebtedness. That is a finite situation for any individual because as the users of the currency they are financially constrained – meaning they have to fund their spending at all times from their revenue sources and then from borrowing.
There are life-cycle justifications for citizens going into debt early in life (for example, to purchase a house) and then over time going into a net saving position as they age.
The private domestic sector as a whole can also be in a deficit and accumulating debt as a result. The private sectors in many countries were in this position prior to the crisis unfolding in 2007-08 after a credit-binge promoted by the out-of-control and poorly regulated and supervised banking sector.
But then think about what it means for a currency-issuing government, such as Japan’s, to be “living beyond its means”. First, you have to ask what its means are defined as. That is an easy question to answer for a currency user because we just need to identify its revenue sources.
However, for a sovereign government, which is never revenue constrained because it is the monopoly issuer of the currency, there is no financial sense that can be applied to the term living beyond its means.
A government can push the economy so that it runs out of real resources that can be transformed into goods and services. But as long as there are real resources available for sale in yen then the Japanese government cannot live beyond its means.
Further, the capacity of the private sector to “live within its means” is significantly influenced by the fiscal balance that the government runs. In the case of Japan which runs an external surplus of around 2 per cent of GDP, the private domestic sector could save overall even if the government ran a balanced budget.
But the desired overall saving for the private domestic sector is higher than 2 per cent of GDP which means that to maintain growth the government has to run a deficit. The deficit in this sense supports – or in Modern Monetary Theory (MMT) parlance – helps to finance the overall private domestic sector saving by ensuring that income growth is higher than would otherwise be the case.
So there is no logical content in the WSJ assessment quoted above.
There was an interactive application accompanying the article carrying the ominous title “Fiscal Reckoning”. Even the colours they used in their charts are dull!
One of their charts compares Japan to Greece, Portugal, Ireland, Italy, the US, Spain and Korea. That comparison has no meaning because the Eurozone nations operate within a different monetary system where the national governments have no currency-issuing capacity and, as such, their spending is constrained by their capacity to raise tax revenue and borrow from the private bond markets.
I qualify that statement because the ECB easily render the bond markets powerless in the Eurozone if it wanted (and it has via the Securities Markets Program to some extent in particular country-specific cases). But it remains the national governments do not have that option.
Whenever you read an article or report that conflates pure fiat currency systems (US, Japan, Korea) with bastardised and constrained fiat mometary systems (Eurozone) you can conclude that they are either intent on misleading their readers or do not understand the difference and therefore disqualify themselves from commentary.
The WSJ article that:
The tax increase … will slow the rate of issuance of Japanese government bonds. But the new revenue will quickly get consumed by projected growth in retirement-program spending for the country’s rapidly growing population of seniors. Lawmakers dropped plans to curb entitlements, which were seen as more politically contentious than the tax increase.
It is highly likely that the tax increases will increase the rate of issuance of Japanese government bonds because there will be negative impacts on the growth rate, which is in a rather precarious state at present.
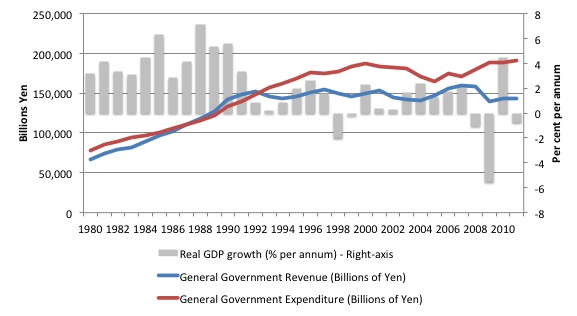
The following graph is taken from data published by the IMF in their April 2012 World Economic Outlook database. It shows total general government spending (red line) and revenue (blue line) in billions of Yen on the left-hand axis and annualised real GDP growth (grey bars) on the right-hand axis from 1980 to 2011.
The cyclicality of the deficit (the difference between the blue and red lines) is obvious. It is also obvious that when the economy returned to more solid growth from 2003, the gap started narrowing only to widen again as the financial crisis took its toll on Japan’s export contribution.
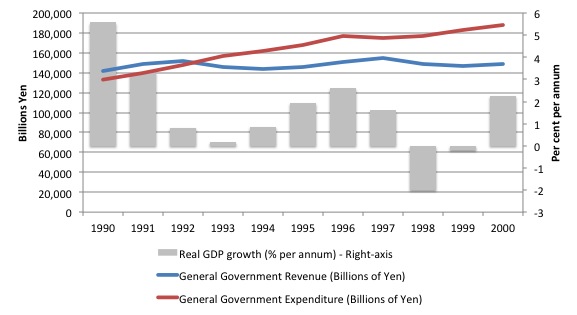
I reconstructed the graph to highlight the decade 1990 to 2000, which captures the last few years of growth before the property bubble burst and then the budget response as revenue collapsed and the Japanese government ramped up expenditure growth to maintain real GDP growth. In 1993, total tax revenue fell by 3.7 per cent and fell again in 1994 by 1.6 per cent.
Government spending growth increased by 6.4 per cent in 1993, 2.8 per cent in 1994, 4.1 per cent in 1995 and 4.8 per cent in 1996 – which was a combination of cyclical effects (automatic stabilisers) and discretionary decisions to stimulate growth.
The fiscal support that was provided allowed the Japanese economy to avoid any negative real GDP growth (on an annualised basis) despite the massive collapse in private spending after the property collapse. That was a remarkable demonstration of the effectiveness of fiscal policy in offsetting fluctuations in private spending.
I would note that even though the budget deficit grew in the mid-1990s, it remains true that the Japanese government was overly cautious with respect to the provision of fiscal policy stimulus. They initially adopted an expansionary role which delivered modest real GDP growth. But, over this period they were constantly harassed by the likes of the IMF and OECD (and the host of commentators who choose to repeat the propaganda coming out of those institutions).
The screams from the commentators were no more imaginative then than they are now. Today I saw headlines like:
1. Japanese Debt: A Slow-Motion Train Wreck
2. It is clear that Japan is in a deep hole, and that getting out of it is a daunting.
It is almost as if the world has stood still in the minds of these commentators because that is more or less what they were saying in 1996. We were told then that Japan was about to collapse, that bond markets would shun the government, that interest rates and inflation would surge and that the government would run out of money.
The problem is that the Japanese government succumbed to the pressure and in 1997 introduced a contractionary budget, which included sales tax increases and cutbacks in spending. Expenditure growth was cut by 0.7 per cent in 1997.
The results were almost immediate and a palpable reminder that fiscal policy is effective in both directions. The economy, which was showing some signs of recovery given the fiscal support, nose-dived.
Moreover, the deficit expanded. Tax revenue fell by 3.4 per cent in 1998 and a further 1.9 per cent in 1999.
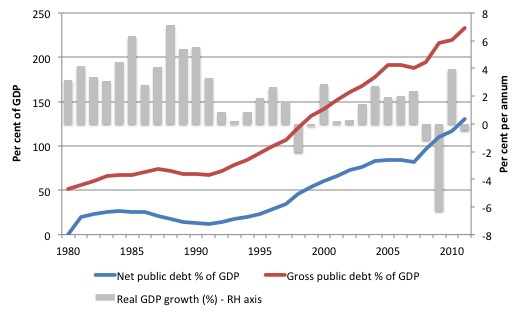
The following graphs are also constructed from the IMF WEO database.
The behaviour of the public debt ratios is clearly cycle and certainly not exponential.
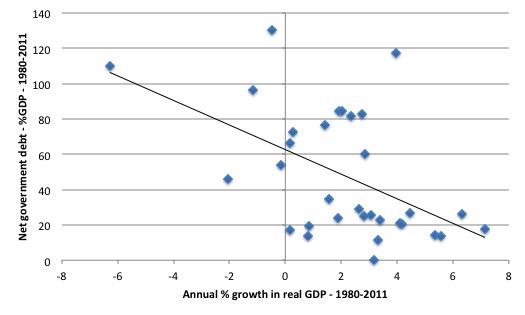
The next graph shows annual real GDP growth rate on the horizontal axis against the net national debt as a per cent of GDP on the vertical axis. The black line is the simple linear regression trend line, which suggests that when growth is strong the national net debt ratio declines and vice versa.
That is exactly what we would expect and why it is imperative to concentrate on growth rather than directly trying to reduce the financial ratios. We know from bitter experience that when the target of the policy becomes the financial ratios, real economic growth typically suffers and the financial ratios move in the opposite direction to the aim.
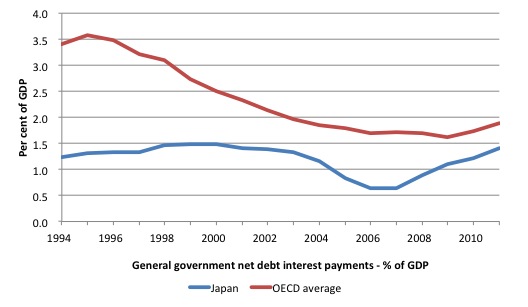
Consider the following graph which uses OECD data for the General government net debt interest payments as a percentage of nominal GDP. It shows the evolution of this data series for Japan and the OECD Total from 1994 to 2011.
It is very hard to see any explosions.
The Ministry of Finance (December 24, 2011) – published an interesting supplement to the FY2012 Budget – Japan’s Fiscal Condition – which contains detailed breakdowns of the components of the budget. The Appendix is similarly rich in detail but full of OECD- and IMF-style propaganda.
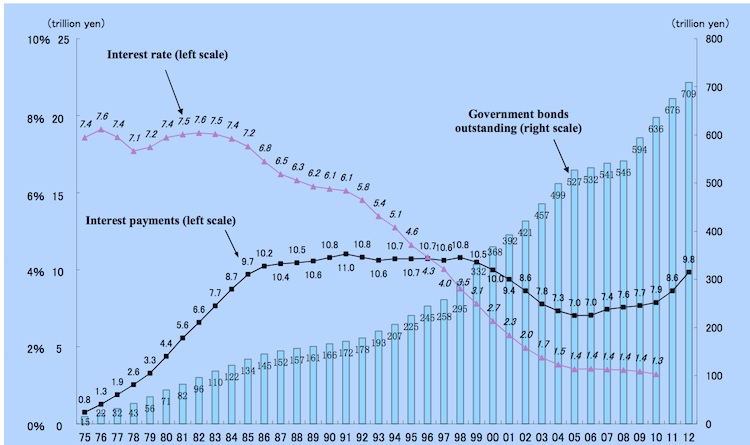
The following graph is taken from Figure (6) Trends in Interest Payments and Interest Rate in the Japan’s Fiscal Condition document. The horizontal axis are fiscal years. The Ministry of Finance point out that “Government Bonds Outstanding”includes reconstruction bonds issued in FY2011 and FY2012 (FY2011; 11.6 trillion yen , FY2012; 12.7 trillion yen ).” These are “secured by the revenues including the special tax for reconstruction.”
It shows that as the amount of outstanding bonds has grown, the interest servicing payments have not grown significantly (in Trillion of Yen) because there has been such an appetite for the bonds that yields have fallen to very low levels.
The WSJ article then rehearses the standard arguments without realising how lame they are. For example, after a foray in to the rating agencies they write:
Japan’s outstanding debt now equals 214% of its gross domestic product, according to the Organization for Economic Cooperation and Development.
Japan has so far been spared the bond-market punishment facing the beleaguered euro zone. But fears of contagion from Europe, and warnings from credit raters of further downgrades, pushed Japanese politicians to set aside their usual fractiousness. Decision-making paralysis has prevented them from addressing a number of challenges, from boosting a long-slumping economy to crafting a new energy policy following the sharp loss of nuclear power after the Fukushima Daiichi accident.
Even within the logic that is used by the scaremongers (that is, that sovereign debt matters) there is some very dishonest reporting. The typical figure that is reported is Gross General Government Debt, which in 2011 was 229.9 per cent of GDP, the highest of the advanced nations. (for example, UK has 82.5 per ecnt, US 102.0 per cent).
See the IMF Fiscal Monitor Database, April 2012 for details of other nations (Table 6)
Once you take into account the consolidated position of the general government and the central bank and take away the financial assets that the government holds (excluding shares and other equity and financial derivatives) the net consolidated government and central bank debt in Japan in 2011 was 98.3 per cent of GDP (UK was 60 per cent; US was 62.8 per cent).
So that is a very different picture.
But moreover, you will see the Eurozone folly is introduced as substantive argument and the ratings agencies are held out as something Japan should be worried about.
Japanese government debt carries zero credit risk and nothing the ratings agencies do will alter that. There are always more bond investors lining up each bond auction to purchase Japanese government debt than the government issues. The same investors have been buying Japanese government debt while deficits have been rising and gross public debt ratios heading up beyond 200 per cent for the last 20 years.
On the last point, Please read my blogs – S&P decision is irrelevant and Moodys and Japan – rating agency declares itself irrelevant – again – for more discussion on this point.
The WSJ claims then rehearsed the ageing society argument:
Over the following five years, the government forecasts spending will grow at a rate three times the annual increase in tax revenue. The big expense: Japan’s rapidly aging population. In 1995, 14% of Japan’s population was at least 65 years old, while social security and related expenditures took up 17% of the budget. In 2010, seniors were 23% of the population-while senior-related spending ate up 29.5% of the budget. Absent radical change in entitlement programs, Japan’s demography is on track to swamp its finances.
Which means that the government will have to spend less on primary schools and pre-school facilities and more on personal care services for the aged.
The only issue is whether there will be sufficient real resources available for sale to facilitate the living standard aspirations of the ageing cohort.
There is a chance that living standards will have to fall – but that will not be because the Japanese government will run out of the capacity to purchase any goods and services that are available for sale in the currency it issues.
Productivity growth clearly has to grow to maintain real standards of living when the dependancy ratio is rising. That is the issue that Japan has to broker. Trying to broker it by plunging the economy back into recession or another extended period of low growth will undermine the capacity of that nation to generate productivity growth.
The WSJ say that the demands of the older Japanese:
.. is creating irritation among many in their 20s and 30s who have had to make do with low-paying temporary jobs, as companies have responded to two decades of stagnation by reducing the number of young people they hire and cutting pay and benefits.
Which gets to the nub of the ageing society argument in relation to fiscal policy. The younger Japanese might gain political sway as they get older and decide their parents do not deserve the standard of public goods that might be available.
The political process might force the government to cut the standard of living for the older population. But that won’t be a financial constraint binding – it will be the outcome of the political debate and lobbying by different demographic cohorts.
The WSJ article closes with this wonderful demonstration of ideology cum ignorance. They quote a 24-year-old as saying:
There will be no money left in the pension system when our turn comes in 40 years … I am worried things are only going to get worse unless we do something.
There will always be “enough money” available for government spending if the government chooses to make use of its currency-issuing capacity.
The problem is that if the government is pressured to “do something” by the neo-liberals then the 24-year-old will face a future of poor employment prospects and the rest of it.
Conclusion
Japan is not Greece. It should work that out and avoid repeating its 1997 disaster.
Alternative Olympic Games Medal Tally
My final Alternative Olympic Games Medal Tally is now available.
That is enough for today!
(c) Copyright 2012 Bill Mitchell. All Rights Reserved.
“There are always more bond investors lining up each bond auction to purchase Japanese government debt than the government issues.” … just to clarify this point further (against the oft-heard argument that the buyers are “captive” Japanese investors), here is the latest on Bloomberg:
By Jeff Black
Aug. 13 (Bloomberg) — Germany’s Bundesbank said it plans to begin trading in Japanese government securities from its Tokyo office next month as part of the management of its foreign currency reserves. “The trading office will execute investment operations in Japanese government securities within the management of the foreign reserves of the Bundesbank,” the Frankfurt-based central bank said in an e-mailed statement today. “In addition the office will monitor and report on market developments.”
At 0.78% in 10yrs, no less!!
Shades of “Who will buy UST’s ….?”
Sovereign currencies (such as the AUD) are uncommonly strong as money first goes from peripheral Europe to the Core, then off to areas where the capital will be most assuredly returned. It would seem there is more behind this, and that we are in for an interesting period ahead. It is also a tacit acceptance that inflation is of no concern.
I think there is some cherry picking here, or at least only partial explanation.
Looking at the first graph:
If the GDP 1997 dip was caused by falling govt. spending then why no dip after much steeper and longer 2003-2004 fall in the govt. spending? The collapse only came in 2008 arguably due to reasons unrelated with govt. spending (the GFC). If MMT cannot explain 2003-2004 then it probably also is incorrect about the 1997.
@RonT
I think Bill makes it fairly clear that the fall in economic growth and government revenues after 1997 was primarily due to the tax increase, with the 0.7 percent/GDP cut playing the minor role. The point is that the attempt to consolidate the budget acted counter-cyclically to Japan’s recovery
Ben,
I think i get your point about 1997. But why didn’t the much sharper deficit reduction of 2003-2005 produce a recession? Growth was stable until 2008. There might have been an export surge or something, otherwise it is unexplained. I hope Bill can respond.
Regards.
RonT:
The casuality runs both ways – strong growth reduces expenditures and increases revenue. Looks like that happened in the 2003 – 2005 period.
Public debt is only one asset class among many. It’s “outside wealth” to the private sector as contrasted to “inside wealth” that is created within private sector. Then there is also “saving desires” that can change rather rapidly, change in which seems to correspond to mainstream term of “confidence”.
Dear RonT (at 2012/08/13 at 23:48)
Modern Monetary Theory (MMT) does not suggest cuts in government spending (net or otherwise) will damage growth necessarily. It all depends on what other sources of spending growth are present. There are times when governments should make discretionary cuts in their net spending (for example, when net exports are booming or private investment is strong).
In the case of Japan, there was no “cherry-picking” going on in my explanation. Private spending and net exports had recovered substantially after years of fiscal support after the 1997 debacle.
So by 2004, public cuts were less damaging. However in 1997 with private spending still very fragile and the uncertainty of impact of the Asian crisis on exports, the last thing the Government should have been doing was imposing fiscal austerity. That was my point. The same point holds now.
best wishes
bill
Bill,
What are your/MMT views on the cause of Keynesian crises. Specifically how do general gluts/ aggregate demand lagging behind aggregate supply arise?
MMT does not indicate when GDP will fall as a consequence of reductions in government spending. If the private sector is conned by mainstream economists and politicians into believing that budget surpluses are desirable, it may increase its spending (increased confidence) to the extent necessary to more than offset the reduction in government spending – thus enabling GDP to keep rising. But to do this, the private sector must increase its debt levels which, if the government keeps trying to run surpluses, leads to the unsustainable accumulation of private sector debt. Once this point is reached, private sector spending collapses, as does GDP. This is what happened in 2007. Had the private sector in Japan, as well as in other nations, not increased its debt-fuelled spending (largely consumption spending), the decline in GDP would have occurred earlier and the inevitable GDP recession would not have been as severe, albeit it could have been avoided altogether if central governments had been prepared to operate budget deficits, as required.
By the way, my last comment was motivated by RonT’s comments. I also neglected to say that MMT is very good at predicting likely macroeconomic difficulties, especially when facilitated by the bad macroeconomic policies of currency-issuing central governments, but can’t predict exactly when the difficulties are likely to emerge. That doesn’t make MMT any less relevant. Mainstream economists kept recommending fiscal policy stances in the 15-20 year period prior to the GFC that set economies up to fail, but were ‘lucky’ enough for the undesirable nature of these policies to be masked by a debt-fuelled consumption binge that kept GDP bouyant and allowed central governments to achieve their budget targets. The fact that inevitable GDP recessions are often a lagged response to inappropriate fiscal policy is no doubt used by mainstream economists as a way to avoid criticism. After all, for most of the decade up to 2007 that the Aust Fed Govt ran budget surpluses, Aust’s GDP growth was strong, giving the false impression that macroeconomic policy was appropriate. It is still being used to support the view that Peter Costello (Aust’s Fed Treasurer at the time) was the best Treasurer Aust’s ever had. What the GDP growth masked was how the Fed Govt was setting the Aust economy up to fall into recession, and that the Aust economy was not rescued by strong exports to China and India, but by the new Fed Govt’s fiscal stimulus (as badly directed as that stimulus was).