These notes will serve as part of a briefing document that I will send off…
Japan – signs of growth but grey clouds remain
The Wall Street Journal reported late yesterday (May 20, 2015) that – Japan’s First-Quarter GDP Growth Is Fastest in a Year. This follows the release of the latest national accounts data from the Japanese Ministry of Finance. The WSJ was like many media commentators – quick to put the best spin on the data that they could. They converted the 0.6 per cent quarterly growth figure for March 2015 into a 2.4 per cent annualised figure and pronounced a consumer led recovery. The facts tell us a different story. The biggest contributor to growth in the March-quarter was unsold inventories. Whether this is a sign of lagging sales and overly confident producers, who won’t remain in that state for long, or expectations of strengthening consumer demand, remains to be seen. On the face of it, with real wages continuing to fall and consumer expectations weak, things may not be as rosy as the “2.4 per cent annualised growth” result would suggest.
The WSJ say that:
Real gross domestic product, the broadest measure of economic activity, grew by an annualized 2.4% between January and March … much stronger than a revised 1.1% in the October-December period. It also beat a 1.5% growth forecast by economists surveyed by The Wall Street Journal.
The figures offer support for policy makers’ view that the economy is on its way to recovery, as growth in corporate profits is leading to pay raises for workers and greater consumer spending.
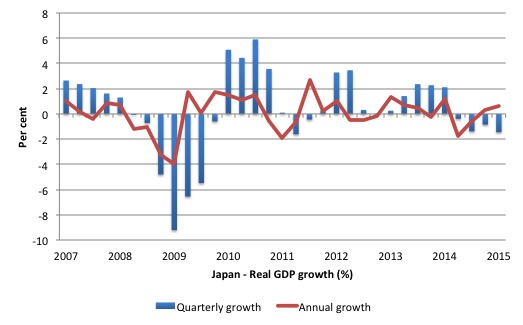
The following graph shows the growth of real GDP from the March-quarter 2007 to the March-quarter 2015. The annual growth (year-on-year) is in blue bars while the red line is the quarterly growth rate.
On an annual basis, Japan remains in recession, with the latest annual growth rate of -1.4 per cent, driven by the very poor June-quarter 2014 result, which was the direct outcome of neo-liberal incompetence (the sales tax hike).
It is the quarterly result that the press are promoting. The Japanese economy grew by 0.6 per cent in the March-quarter 2015.
Those who want to present an even more optimistic picture talk about the annualised March-quarter result of 2.4 per cent, which is simply constructed by assuming that the March-quarter figure will replicate over the next three quarters as well (that is, multiplying the quarterly growth by 4).
If the current trend was replicated, then of course, it would be a strong result. But the devil is always in the detail.
I last wrote about this in November 2014, some 6 months after the Abe government raised the sales tax from 5 per cent to 8 per cent in April this year. The next two quarters have seen negative growth on the back of declining domestic demand. Please read my blog – Japan returns to 1997 – idiocy rules! – for more discussion on this point.
Several interesting points about the latest national accounts release can be made in relation to the media hype about strong rebounds in consumption and private (business) investment.
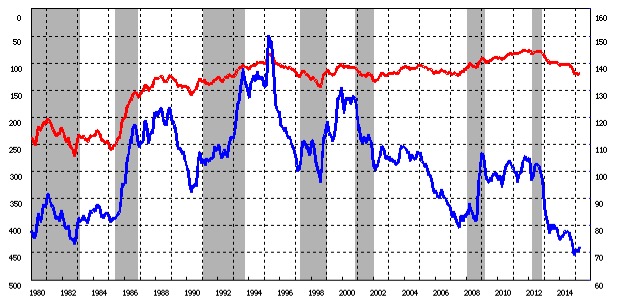
First, Japan’s exchange rate has depreciated significantly in the last year. Since October 2011 (its most recent peak), the Yen has depreciated by some 55 per cent against the US dollar.
The following graph (from the BOJ) shows the monthly US dollar to Yen parity and also the real effective exchange rate, which is a measure of international competitiveness.
Real effective exchange rates provide a measure on international competitiveness and are based on information pertaining movements in relative prices and costs, expressed in a common currency.
For an explanation of the REER and its interpretation, please read this blog – Time to ditch the export-led growth mania.
If the REER rises, then we conclude that the nation is less internationally competitive and vice-versa. The real exchange rate is the blue line graphed on the right-hand- axis.
Note the left-hand axis (the nominal exchange rate) is reversed, so a decline in the red line indicates that more US dollars exchange for one yen.
It makes you wonder what the scaremongering about depreciating currencies is all about – for example, the claims that a catastrophe would follow if Greece floated its exchange rate upon exit.
Here is an advanced nation engineering a massive depreciation of its exchange rate to gain competitive edge in international trade.
The Japanese did the same thing in the late 1990s. A well established understanding is that Japan’s trade sector is fairly responsive to exchange rate movements and that the current account surplus rises when the Yen depreciates, which through the income effects of increased net exports adds to growth.
The depreciation reflects the decisions by the Bank of Japan to expand its bond-buying purchases.
What have been the impacts on real GDP through trade? Japanese net exports have grown strongly over the last year but growth was negative in the March-quarter 2015. Export growth remains relatively strong (2.4 per cent on the quarter and 7.3 per cent on the year). But in the March-quarter 2015, imports grew by 2.9 per cent (and zero per cent over the last year).
So mixed outcomes. Clearly, in the March-quarter 2015, the external sector drained economic growth in Japan.
Second, despite the Wall Street Journal claiming that there was “greater consumer spending”, the fact remains that private consumption has still not really recovered from the sales tax increase in April last year.
When the Abe Government raised the sales tax from 5 per cent to 8 per cent in April 2014, Japan went back to 1997 when the ideologues came out in force and pressured the national government to cut into the fiscal deficit.
The government raised the sales tax then with disastrous consequences. The lessons seem to have been forgotten.
I discussed the 1997 debacle in detail in this blog – Japan thinks it is Greece but cannot remember 1997
The direct impact on private consumption of the 1997 sales tax hike have been replicated in 2014 into 2015. Tye
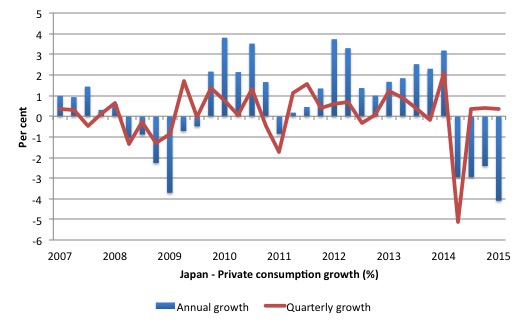
The following graph shows growth in private consumption spending since the March-quarter 2015. The blue bars are the annual (year-on-year) outcome, while the red line is the quarterly result.
This is one of those magnificent graphs that you show students to demonstrate intervention effects of government policy. Private consumption growth was growing fairly strongly on up to the beginning of 2014, after the impacts of the GFC and the Tsunami had been overcome.
The sales tax hike had the predictable negative effect and the quarterly growth of private consumption ever since has been very subdued indeed.
It is hard to construe the data as telling us that private consumption in Japan is rebounding strongly.
In this blog written in September 2014 – Japan’s growth slows under tax hikes but the OECD want more – I reported on the second estimate of the national accounts for the first quarter 2014 provided by the Japanese government Cabinet Office.
I said:
The drop in private consumption spending is a direct result of the sales tax hike. It will get worse.
It certainly did get worse but I claim no special powers of comprehension or foresight. It is so basic. It was obvious that the economy would deteriorate further.
First, consumers stopped spending (last quarter) and since have adopted a very cautious approach. In part, this is because real wages have been falling consistently for some quarters now (see below).
The impact of static consumption expenditure is that business investment then lags.
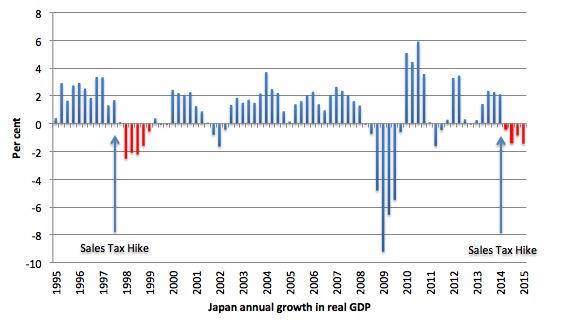
Here is the history of real GDP growth (annualised) since the March-quarter 1994 to the March-quarter 2015. The red areas denote sales tax driven recessions.
The property crash in the early 1990s caused a severe contraction in household consumption and private investment spending which culminated in a brief real contraction in 1994. Once the stimulus from the expanding budget deficit began to work real GDP growth regained momentum.
By 1996, the same calls for austerity (fears about public debt ratio etc) that dominate the policy debate today were rampant in Japan and the government eventually bowed to political pressure and raised taxes in an attempt to reign in the fiscal deficit.
The public contraction on top of very fragile private sector spending – akin to the situation that most nations face today – caused a massive contraction in 1997 and 1998 – which increased the fiscal deficit (via the automatic stabilisers) and added to the public debt ratio (given both debt was rising and GDP was falling).
After that collapse, the ratings agency, Moody’s then started to play games by downgrading the sovereign debt.
Fortunately, the Japanese government did not take any notice, and, realising the mistake of 1996-1997, expanded their net spending again. The renewed fiscal stimulus saw real GDP grow very strongly in the ensuing years despite the rating agencies decision.
The Japanese government never had any trouble finding buyers for the debt it was issuing, they held complete control over interest rates, inflation fell, unemployment remained relatively stable and real GDP growth was strong through the period of the downgrade.
The decision by Moody’s was rendered irrelevant by the Japanese government who just exercised the power they had as a sovereign issuer of the currency.
You might wonder what happened in 2002? The recession that occurred then in Japan was largely driven by an export collapse (remember the US went into recession during this period) and a tightening of net public spending. This then provoked a fall in private investment spending and a rising saving rate. It had nothing to do with the ratings decision.
Once exports recovered and public spending support resumed the economy then grew relatively strongly despite the lower sovereign debt ratings.
And then the 2007 crisis arrived.
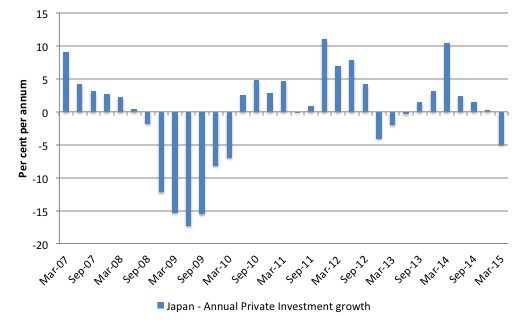
It is not only private consumption that is subdued at present. The following graph shows the annual growth in private investment from the March-quarter 2007 to the March-quarter 2015.
Not a glowing outlook.
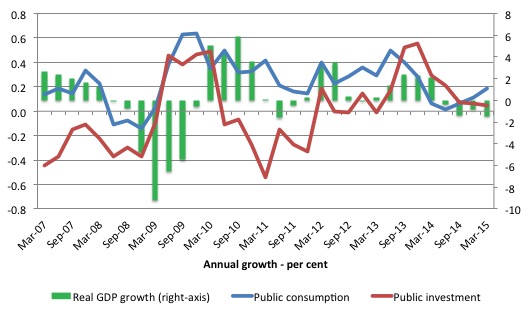
The next graph shows, there was a strong counter-cyclical fiscal response in both public consumption and investment over this period of private spending decline.
The government started withdrawing its fiscal stimulus too early – even though growth in government consumption continued through 2010 as public investment started to contract. While the non-government components of spending were starting to recover they were not strong enough to resist the slowing fiscal impact and so real GDP growth started to moderate.
The fiscal response in the most recent crisis has been strong and even though net exports once again started to drain growth the overall slump instigated by this devastating natural disaster was relatively modest and short-lived. Once again the recovery has been led by a strong counter-cyclical fiscal response which has also boosted private consumption growth.
But with the IMF and OECD all hectoring Japan to reduce its deficit the growth in public consumption and investment spending has declined dramatically and that is reinforcing the effects of the sales tax and related austerity measures on private spending.
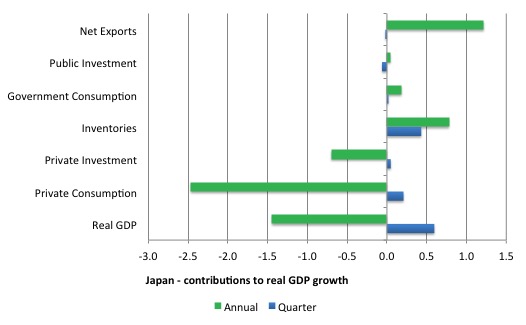
The next graph shows the contributions (in percentage points) to real GDP growth of the major expenditure categories in Japan over the last quarter and over the last 12 months (to the March-quarter 2015).
The annual results capture the impact of the introduction of the sales tax (April 2014) and its aftermath.
The major categories of expenditure that you would expect to be affected, either directly (private consumption) or indirectly (private investment) were negatively impacted.
It is also clear that over the last year, the external sector has contributed strongly to growth while the public sector has been a modest contributor.
But neither have been able to offset the damage done to the private spending by the sales tax increase.
In the March-quarter 2015, while growth has returned the major contributor has been the growth in inventories.
The question then is whether this is the start of the classic inventory cycle, which would mean that second-quarter growth will probably decline again.
The inventory cycle starts as firms realise that their sales expectations were overly optimistic and private consumption fails to grow as anticipated. The result is that unsold inventories build up.
This signals over-production (relative to sales) and firms start cutting back production and delaying new investment in productive capacity.
The alternative view is that firms are building inventories in anticipation of strengthening private consumption. We don’t know which factor is driving the inventory buildup and we will soon find out.
But on the face of it, the outlook is not as rosy as the financial media is making out.
Two additional things can be said. The Japanese Cabinet Office publishes a monthly survey of Consumer Confidence. The latest results, released on May 15, 2015 (for a survey conducted in April 2015) tells us (Source):
1. “Consumer Confidence Index (seasonally adjusted series) in April 2015 was 41.5, down 0.2 points from the previous month”.
2. All components that influence the Consumer Perception Indices were negative – “overall livelihood”, “Income growth”, “Employment”, and “Willingness to buy durable goods”.
Second, real wages have been falling in Japan for some time, which suppresses consumption spending.
The Japanese Ministy of Health, Labour and Welfare publishes a Monthly Labour Survey. The latest data on – Total Cash Earnings provides some information on wage movements.
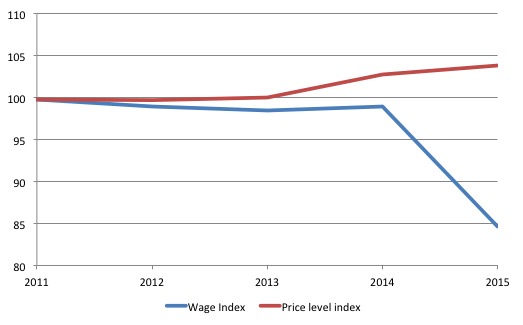
The following graph shows the movement in the All Industries Wage Index since 2011 (the first three months of 2015 are averaged to give the 2011 result) and the CPI index since 2011 (red line).
It is clear that real wages have been falling.
Taken together, we learn from the sales tax debacles and the most recent data that:
1. Fiscal policy works in both directions – trying to cut deficits will reduce economic growth (and vice versa) – when the economy is below full employment.
2. Monetary policy does little to stimulate real spending in a monetary economy and can not offset contractionary movements in fiscal policy. The Bank of Japan has been engaging in more quantitative easing and interest rates remain around zero – but there has so far been very little real GDP impact.
Conclusion
When the Japanese government announced its staggered sales tax hikes, any sensible person would have concluded that just as in 1997, the economy would head south.
It did.
All those claims by the OECD and the IMF, among others that the Japanese government had to increase sales taxes to raise more government revenue werew just the ravings on vandals.
There is no such thing as “growth-friendly” fiscal austerity.
By its their very nature, discretionary cuts to fiscal positions kill growth. Sometimes that is necessary to ward of inflation or to provide more space to private spending. But, certainly that wasn’t the case last year when the Japanese government raised the sales tax.
The fiscal contraction took the nation back to 1997, where these same debates were rehearsed then and led to the sales tax hikes – and, unsurprisingly a dive back into recession.
On an annualised basis, Japan is still in recession. But in the March-quarter 2015, growth has returned, albeit modestly.
The only worry is that with real wages being cut and consumer sentiment weak, the rising inventories, which were the largest growth factor in the March-quarter 2015, are a signal of worse things to come rather than better.
Time will tell.
That is enough for today!
(c) Copyright 2015 William Mitchell. All Rights Reserved.
Mark Blyth, Eric Lonergan and Simon Wren-Lewis have written a piece in the Guardian today about QE for the public.
You guys should get in there and tell them how to do it without causing inflation.
I hope to see you in the comments section of that piece.
Bill Said…..2. Monetary policy does little to stimulate real spending in a monetary economy and can not offset contractionary movements in fiscal policy.
Help needed. Can anyone point out old posts that have graphs for Australia showing this relationship? Or if not other sites with similar graphs. I am visual so graphs are awesome for understanding.
Cheers Punchy
Hi Bill, have you noticed that the media (both Japanese and foreign) have recently taken up the narrative and spin that Japan went into a “surprise” recession last year? Apparently nobody expected it to happen. Also, the narrative is that this “surprising” economic weakness should not be used as a reason for Shinzo Abe to delay the next stage of the consumption tax hike to 10%, as Japan must repair its “tattered” public finances and reign in its “massive” public debt (various other nonsensical cliches and buzzwords are also trotted out). In particular, there is an oft-quoted Japan based foreign “expert” on the Japanese economy who, after previously claiming that the tax hike would have NO effect on GDP (it seems the ’97 recession was all due to the Asian Financial Crisis and a weak banking sector, and the timing of the tax hike was just a coincidence, at least that was his line at the time), now is stating that the next stage should still go ahead anyways. That is also the position of the Japanese Ministry of Finance. Apparently, concern about the health of the economy is a sign of weakness and shows an unwillingness to make “tough decisions”, take “strong, much needed action” and undertake “painful fiscal reform”.
There are also preposterous claims being made by the Ministry of Finance regarding the level of debt servicing costs, where they are including the rolling over of debt in the calculation of “debt servicing”. And of course, it is the stated objective of both the Ministry of Finance and the Abe administration to run a primary surplus by 2020. The lunatics really are running the asylum here in Japan.
Try the St. Louis Fed http://research.stlouisfed.org/fred2/categories/32269
The authors of that piece don’t seem to understand what QE is and besides the Government of the day can do what they are chattering on about (send money to every citizen, in any amount) any time they wish, no need to involve the BoE.
Why anyone in the UK be worried about inflation at this time escapes me?
The recent data suggests that deflation is the trend du jour, does it not.
I understand that Bill admires Arthur Okun .I am not sure if that extends to his
misery index.Achieved by adding the inflation rate to the unemployment rate.
On this index Japan is currently at the bottom of the world league.The country
with the least misery.
It seems to show that low misery can coexist with weak economic growth
in particular entrenched stagnating wages which I have read on this blog Japan
have been even more affected by than other OECD countries over the last 20 years.
I suppose they started from a relatively high position.
If only the rest of the OECD elite could reign in the snapping dogs of austerity they have
unleashed they might too be able to placate the citizenry whilst still winning the
battle for surplus value.
“The authors of that piece don’t seem to understand what QE is . . . ”
‘ While the Bank of Japan adopted the precise name of Prof Werner’s policy, it was somewhat less accurate when interpreting his actual proposal.
Incredibly, the Japanese version of QE that was eventually implemented was a policy Prof Werner had specifically ruled-out.
Prof Werner’s argument was that, because more than 95% of the money supply in a modern economy is derived not from cash or reserves, but from private bank lending, it is essential to get banks to lend.
So he urged the Japanese government to enter into private long-term agreements to borrow from commercial banks, instead of issuing government debt.
The Bank of Japan’s version of QE, in contrast, involved creating money out of nothing at the central bank.
“That’s absolutely not what my policy was about,” says Prof Werner. “In my original article, I specifically argued against either lowering interest rates or expanding central bank reserves. That was my whole point – traditional solutions weren’t going to work. Actually, it was a bit upsetting.”
Then, in an additional twist, the Bank of England also later adopted Prof Werner’s QE label – but, again, to describe a policy with which he didn’t agree.
“It was one thing when the Bank of Japan did it, because that was over in Japan and was some time ago,” he says. “But once the Bank of England also started using the phrase, I thought ‘Hang on – I’ve got to speak up and make clear that the original definition is quite different.'”
The Bank of England’s interpretation of QE also involves the creation of central bank credits, as in Japan. But in the UK these have been used to buy government bonds from commercial banks rather than from the government directly.
Prof Werner says this is “a little better” than Japanese QE, as it “at least in theory increases commercial banks’ reserves”. He maintains, though, that the “best way to boost the economy is to increase bank credit”, and that can only be guaranteed by governments borrowing from banks directly.
“That creates new credit,” says Prof Werner. “The money supply then expands, transactions increase, there’s more demand, more employment, more tax revenues and suddenly you have a virtuous circle.” ‘
“best way to boost the economy is to increase bank credit”
No. This leads to bubbles. Bank credit is not there as there are no creditworthy customers! Govt deficit spending is better. Also, banks don’t need reserves before making loans, loans create deposits and they get the required reserves after.
“No. This leads to bubbles.”
According to R.W. credit creation needs to be dis-aggregated.
“Importantly for our disaggregated quantity equation, credit creation can be disaggregated, as we can obtain and analyse information about who obtains loans and what use they are put to. Sectoral loan data provide us with information about the direction of purchasing power – something deposit aggregates cannot tell us. By institutional analysis and the use of such disaggregated credit data it can be determined, at least approximately, what share of purchasing power is primarily spent on ‘real’ transactions that are part of GDP and which part is primarily used for financial transactions. Further, transactions contributing to GDP can be divided into ‘productive’ ones that have a lower risk, as they generate income streams to service them (they can thus be referred to as sustainable or productive), and those that do not increase productivity or the stock of goods and services. Data availability is dependent on central bank publication of such data. The identification of transactions that are part of GDP and those that are not is more straight-forward, simply following the NIA rules.”
Is Japanese government debt really harmless?
The debt is equal to net financial assets of the private sector, so those are very large. But, there is not a lot of spending and the economy is slow. Are they investing their money or just letting it sit in government bonds? They are saving in government bonds, because as a country they are getting older. Eventually they want to spend that money, and that is going to cause inflation, unless they can get their robot plans working and maintain productivity with a much smaller fraction of people working.
“Eventually they want to spend that money, and that is going to cause inflation …”
If by ‘eventually’ you mean when everyone in Japan retires all at once.
“Eventually they want to spend that money, and that is going to cause inflation, unless they can get their robot plans working and maintain productivity with a much smaller fraction of people working.”
Agreed. We should ban people from saving money as they might spend it and cause inflation. Actually, no screw that.