Go back to the headlines in 2010 - – “Countries with debt over 90 percent…
No evidence of an imminent wages breakout in Australia despite the claims by the RBA to justify their hikes
Today (May 17, 2023), the Australian Bureau of Statistics released the latest – Wage Price Index, Australia – for the March-quarter 2023, which shows that the aggregate wage index rose by 0.8 per cent over the quarter (steady) and 3.7 per cent over the 12 months. The media are touting how strong the wages growth is but they should be focusing on the fact that Australia’s nominal wage growth remains well below that necessary to restore the purchasing power losses arising from price level inflation. Even though the inflation rate is falling significantly and nominal wages growth has picked up a bit, the problem still remains – real wages have now fallen for 8 consecutive quarters (2 years). Further with the gap between productivity growth and the declining real wages increasing, the massive redistribution of national income away from wages to profits continues. Further, the conduct of the RBA in this environment is contributing to the damage that workers are enduring. They continue to claim there is a threat of a wages breakout and so interest rates have to keep rising to create the necessary unemployment increase to prevent that from happening. It is just a ruse. The rising unemployment will be for nothing other than to repress real wages furthers. And meanwhile, the RBA interest rate hikes are driving up prices (for example, via the rent squeeze).
Latest Australian data
The Wage Price Index:
… measures changes in the price of labour, unaffected by compositional shifts in the labour force, hours worked or employee characteristics
Thus, it is a cleaner measure of wage movements than say average weekly earnings which can be influenced by compositional shifts.
The summary results (seasonally adjusted) for the March-quarter 2023 were:
| Measure | Quarterly (per cent) | Annual (per cent) |
| Private hourly wages | 0.8 | 3.8 |
| Public hourly wages | 0.9 | 3.0 |
| Total hourly wages | 0.8 | 3.7 |
| Basic CPI measure | 1.3 | 7.2 |
| Weighted median inflation | 1.2 | 5.8 |
| Trimmed mean inflation | 1.2 | 6.6 |
On price inflation measures, please read my blog post – Inflation benign in Australia with plenty of scope for fiscal expansion (April 22, 2015) – for more discussion on the various measures of inflation that the RBA uses – CPI, weighted median and the trimmed mean The latter two aim to strip volatility out of the raw CPI series and give a better measure of underlying inflation.
So the inflation rate is still well above the wages growth, which means that real purchasing power continues to decline.
There is nothing to justify the RBA claims that a wages breakout is threatening.
Real wage trends in Australia
The summary data in the table above confirm that the plight of wage earners continues in Australia.
Real wages fell again in the March-quarter in both the private and public sectors.
This is at the same time that employment growth has also slowed considerably.
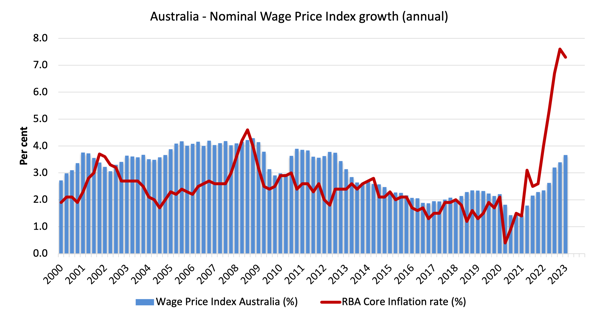
The first graph shows the overall annual growth in the Wage Price Index (public and private) since the March-quarter 2000 (the series was first published in the March-quarter 1997) and the RBA’s core annual inflation rate (red line).
Any blue bar area above the red line indicate real wages growth and below the opposite.
Workers have endured increasing real wage cuts over the last eight quarters.
Allow that to sink in – 2 years of continual undermining of workers’ real purchasing power at a time when interest rates are have risen more quickly than any time in the distant past.
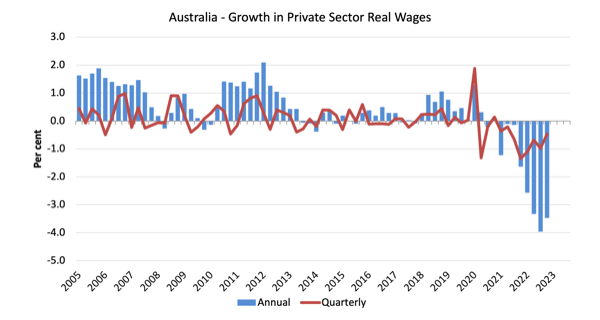
The next graph shows the growth in private sector real wages since the March-quarter 2005 to the March-quarter 2022. The core inflation rate is used to deflate the nominal wages growth.
The blue bars are the annual rate of change, while the red line is the quarterly rate of change.
The fluctuation in mid-2020 is an outlier created by the temporary government decision to offer free child care for the March-quarter which was rescinded in the March-quarter of that year.
Overall, the record since 2013 has been appalling.
Throughout most of the period since 2015, real wages growth has been negative with the exception of some partial catchup in 2018 and 2019.
The systematic real wage cuts indicate that wages are not driving the inflationary episode.
Workers are only able to secure partial offset for the cost-of-living pressures caused by the supply-side, driven inflation.
Industry Variability
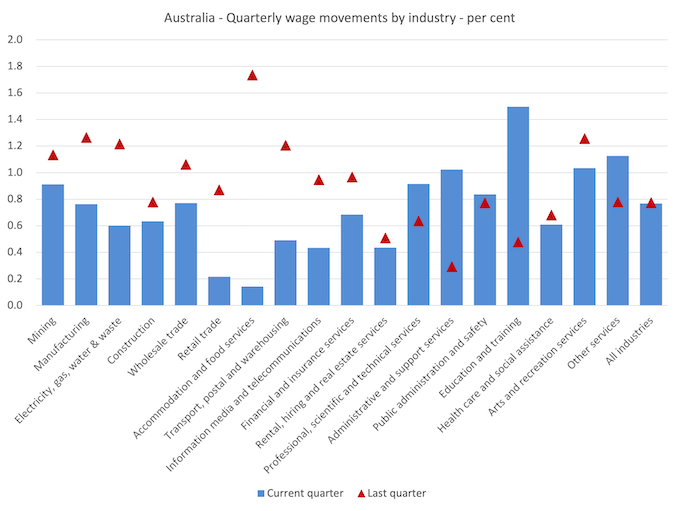
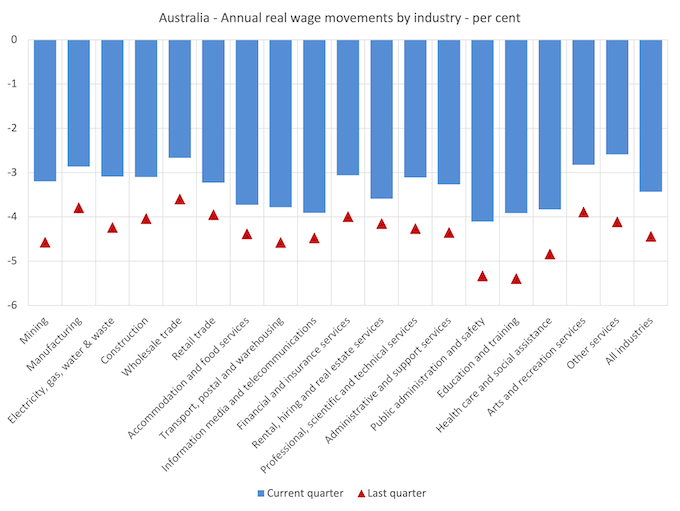
The aggregate data shown above hides quite a significant disparity in quarterly wage movements at the sectoral level, which are depicted in the next graph.
The blue bars are the current quarterly change, while the red triangles are the previous quarterly change.
All sectors recorded nominal wages growth but the extent was variable and many sectors experienced a slowdown in the rate of growth (compare red diamonds with the blue bars).
Four sectors enjoyed accelerating nominal wages growth (Professional, scientific and technical services, Administrative and support services, Education and training, Other services) largely as a result of the increasing awareness that areas such as teaching have been so starved of wages growth (as a result of the artificial wage caps the governments imposed) that public agencies are now finding it hard to recruit labour and shortages are becoming chronic.
However, it is very hard to see where the RBA sees so-called ‘sectoral wage pressures building up’.
The ABS also reported that:
- Jobs in the Education and training (1.5%) and Professional and scientific services (0.9%) industries were the main drivers of wage growth this quarter.
- The Education and training industry recorded the highest quarterly index growth at 1.5%. Wage growth in this industry was driven by increases for jobs in New South Wales and Queensland primary education.
- The Accommodation and food services industry recorded the lowest quarterly growth (0.1%).
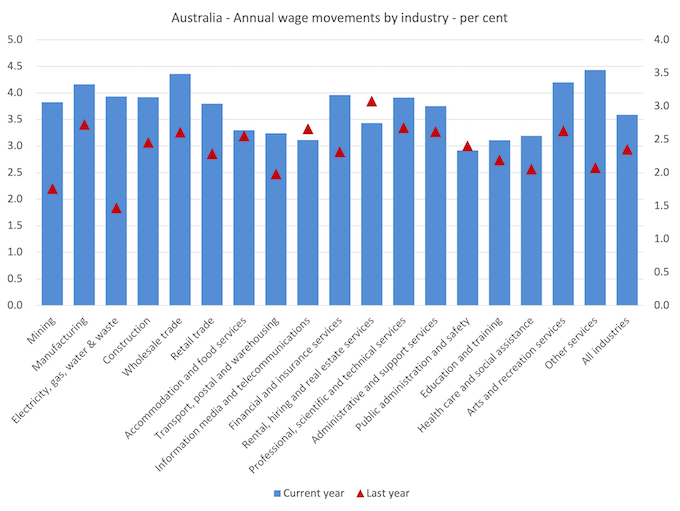
- The Wholesale Trade and Other services industries recorded the highest annual growth (4.4%). The Public administration and safety industry recorded the lowest annual growth (2.9%) across all industries.
If we consider the situation over the last year, then we can see from the following graph that there is no evidence of any major wages breakout occurring.
There has been an uplift in annual nominal wages growth in most sectors but the rates of growth are still well below the inflation rate.
While nominal wages growth was positive, albeit modest, the next graph shows the movements in real wages across industries and you can see that real wages continued to fall in all sectors although the gap between the nominal wages growth and inflation is declining.
This on-going cut in the purchasing power of workers is almost unprecedented in our wages history and marks a massive redistribution of income towards profits.
Real wages continue to take sharp reductions in all sectors.
One can hardly say that wages push is causing the inflation spike.
The great productivity rip-off continues at a pace
While the decline in real wages means that the rate of growth in nominal wages being outstripped by the inflation rate, another relationship that is important is the relationship between movements in real wages and productivity.
Historically (up until the 1980s), rising productivity growth was shared out to workers in the form of improvements in real living standards.
In effect, productivity growth provides the ‘space’ for nominal wages to growth without promoting cost-push inflationary pressures.
There is also an equity construct that is important – if real wages are keeping pace with productivity growth then the share of wages in national income remains constant.
Further, higher rates of spending driven by the real wages growth can underpin new activity and jobs, which absorbs the workers lost to the productivity growth elsewhere in the economy.
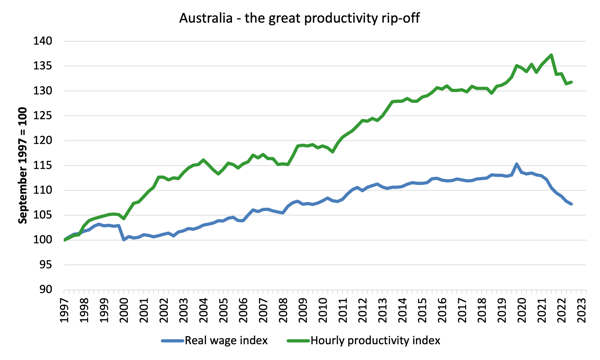
Taking a longer view, the following graph shows the total hourly rates of pay in the private sector in real terms (deflated with the CPI) (blue line) from the inception of the Wage Price Index (March-quarter 1997) and the real GDP per hour worked (from the national accounts) (green line) to the March-quarter 2021.
It doesn’t make much difference which deflator is used to adjust the nominal hourly WPI series. Nor does it matter much if we used the national accounts measure of wages.
But, over the time shown, the real hourly wage index has grown by only 7.2 per cent (and falling sharply), while the hourly productivity index has grown by 31.8 per cent.
So not only has real wages growth turned negative over the last year or so, but the gap between real wages growth and productivity growth continues to widen.
If I started the index in the early 1980s, when the gap between the two really started to open up, the gap would be much greater. Data discontinuities however prevent a concise graph of this type being provided at this stage.
For more analysis of why the gap represents a shift in national income shares and why it matters, please read the blog post – Australia – stagnant wages growth continues (August 17, 2016).
Where does the real income that the workers lose by being unable to gain real wages growth in line with productivity growth go?
Answer: Mostly to profits.
The next graph shows the gap between the real wage index and the labour productivity index in points.
It provides an estimate of the cumulative redistribution of income to profits as a result of real wage suppression.
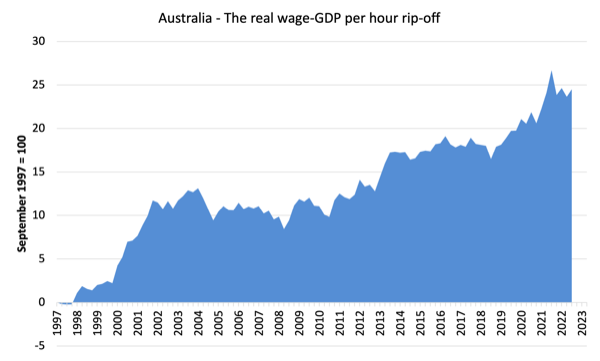
Now, if you think the analysis is skewed because I used GDP per hour worked (a very clean measure from the national accounts), which is not exactly the same measure as labour productivity, then consider the next graph.
It shows the movements in the wage share in GDP (at factor cost) and profit share since the March-quarter 1960 to the December-quarter 2022 (latest data).
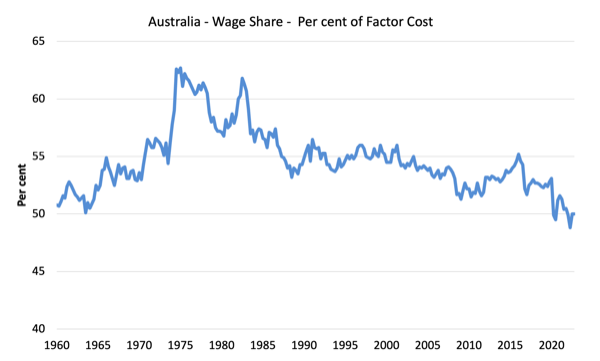
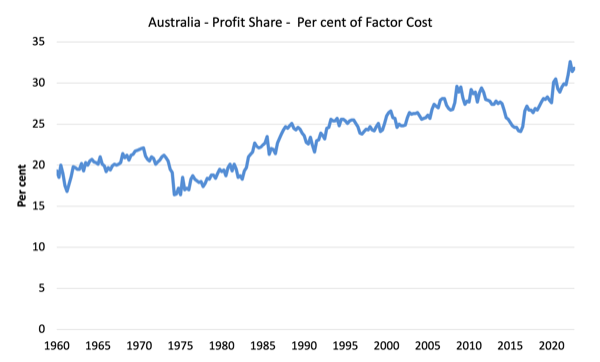
While the series move around from quarter to quarter, the trend is obvious.
The only way that the wage share can fall like this, systematically, over time, is if there has been a redistribution of national income away from labour.
I considered these questions in a more detailed way in these blog posts:
1. Puzzle: Has real wages growth outstripped productivity growth or not? – Part 1 (November 20, 2019).
2. 1. Puzzle: Has real wages growth outstripped productivity growth or not? – Part 2 (November 21, 2019).
And the only way that can occur is if the growth in real wages is lower than the growth in labour productivity.
That has clearly been the case since the late 1980s. In the March-quarter 1991, the wage share was 56.6 per cent and the profit share was 22.2 per cent.
In the December-quarter 2022, the wage share stood at 50 per cent of total income.
There has been a massive redistribution of income towards profits has occurred over the last 40 years.
The relationship between real wages and productivity growth also has bearing on the balance sheets of households.
One of the salient features of the neo-liberal era has been the on-going redistribution of national income to profits away from wages. This feature is present in many nations.
The suppression of real wages growth has been a deliberate strategy of business firms, exploiting the entrenched unemployment and rising underemployment over the last two or three decades.
The aspirations of capital have been aided and abetted by a sequence of ‘pro-business’ governments who have introduced harsh industrial relations legislation to reduce the trade unions’ ability to achieve wage gains for their members. The casualisation of the labour market has also contributed to the suppression.
The so-called ‘free trade’ agreements have also contributed to this trend.
I consider the implications of that dynamic in this blog post – The origins of the economic crisis (February 16, 2009).
In summary, the substantial redistribution of national income towards capital over the last 30 years has undermined the capacity of households to maintain consumption growth without recourse to debt.
One of the reasons that household debt levels are now at record levels is that real wages have lagged behind productivity growth and households have resorted to increased credit to maintain their consumption levels, a trend exacerbated by the financial deregulation and lax oversight of the financial sector.
Real wages growth and employment
The standard mainstream argument is that unemployment is a result of excessive real wages and moderating real wages should drive stronger employment growth.
As Keynes and many others have shown – wages have two aspects:
First, they add to unit costs, although by how much is moot, given that there is strong evidence that higher wages motivate higher productivity, which offsets the impact of the wage rises on unit costs.
Second, they add to income and consumption expenditure is directly related to the income that workers receive.
So it is not obvious that higher real wages undermine total spending in the economy. Employment growth is a direct function of spending and cutting real wages will only increase employment if you can argue (and show) that it increases spending and reduces the desire to save.
There is no evidence to suggest that would be the case.
I usually publish a cross-plot that consistently shows no relationship between annual growth in real wages and the quarterly change in total employment over a long period.
The graph has issues at present due to Covid-19 outliers, although the conclusion doesn’t change.
There is also strong evidence that both employment growth and real wages growth respond positively to total spending growth and increasing economic activity. That evidence supports the positive relationship between real wages growth and employment growth.
At present, we are seeing employment growth slowing or negative after a prolonged period of real wage cuts – exactly the opposite prediction that mainstream economists make.
They were always wrong on this score.
Conclusion
In the March-quarter 2023, Australia’s nominal wage growth remained well below that necessary to restore the purchasing power losses arising from price level inflation.
The data shows that the significant cuts to workers’ purchasing power continue, and, in my view, constitute a national emergency.
Even though the inflation rate is falling significantly and nominal wages growth has picked up a bit, the problem still remains – real wages have now fallen for 8 consecutive quarters (2 years).
Further with the gap between productivity growth and the declining real wages increasing, the massive redistribution of national income away from wages to profits continues.
Further, the conduct of the RBA in this environment is contributing to the damage that workers are enduring.
They continue to claim there is a threat of a wages breakout and so interest rates have to keep rising to create the necessary unemployment increase to prevent that from happening.
It is just a ruse.
The rising unemployment will be for nothing other than to repress real wages furthers.
And meanwhile, the RBA interest rate hikes are driving up prices (for example, via the rent squeeze).
That is enough for today!
(c) Copyright 2023 William Mitchell. All Rights Reserved.
The ALP endorsing this type of behaviour by the RBA suggests that just like before we don’t have a single party in this country that can be trusted to act in the best interests of citizens.
Some of the comments recently from the ALP’s Meryl Swanson (Member for Paterson] could just as easily have come from a right-wing conservative think tank.
https://www.aph.gov.au/Parliamentary_Business/Hansard/Hansard_Display?bid=chamber/hansardr/26693/&sid=0164
So much for the ALP protecting workers from corporate greed.
Thoughts on the RBA rebuttal to some of the above – that mining skews these factor income comparisons while the non-mining share of GDP has only had modest expansion?
Great piece. My understanding is that prior to Hawke/Keating the history of Australia has always been a boom bust cycle with the bust generally occurring due to wage breakouts in sectors of the economy.
Since Hawke/Keating we’ve had a neoliberal consensus to use high immigration to smooth over that part of the cycle. Immigrants typically have less support networks than those born here and most come from countries with low rates of union membership. Through no fault of their own they are used to keep wages and working conditions at a lower level than they otherwise would have been.
Is that about right?