Here are the answers with discussion for this Weekend’s Quiz. The information provided should help you work out why you missed a question or three! If you haven’t already done the Quiz from yesterday then have a go at it before you read the answers. I hope this helps you develop an understanding of Modern…
The Weekend Quiz – November 23-24, 2019 – answers and discussion
Here are the answers with discussion for this Weekend’s Quiz. The information provided should help you work out why you missed a question or three! If you haven’t already done the Quiz from yesterday then have a go at it before you read the answers. I hope this helps you develop an understanding of Modern Monetary Theory (MMT) and its application to macroeconomic thinking. Comments as usual welcome, especially if I have made an error.
Question 1:
Continuous fiscal deficits are more likely to present an inflation risk than one-off deficits designed to meet a short-term private spending decline.
The answer is False.
This question tests whether you understand that fiscal deficits are just the outcome of two flows which have a finite lifespan. Flows typically feed into stocks (increase or decrease them) and in the case of deficits, under current institutional arrangements, they increase public debt holdings.
So the expenditure impacts of deficit exhaust each period and underpin production and income generation and saving. Aggregate saving is also a flow but can add to stocks of financial assets when stored.
Under current institutional arrangements (where governments unnecessarily issue debt to match its net spending $-for-$) the deficits will also lead to a rise in the stock of public debt outstanding. But of-course, the increase in debt is not a consequence of any “financing” imperative for the government. A sovereign government is never revenue constrained because it is the monopoly issuer of the currency.
The inflation risk is inherent in each period that the deficit runs. The continuous nature doesn’t change that. As long as the government is filling a non-government sector spending gap then it can safely run non-inflationary deficits forever.
It may be argued that lobby group capture rises after a long-period of government deficits and this makes it hard for governments to adjust net spending when there are fluctuations in private spending that warrant a cut back in public stimulus.
That might be true but one wouldn’t advocate entrenched unemployment to avoid the capture of government by lobby groups. The political problem of capture would be better dealt with via strict campaign funding rules and disclosures.
The following blog posts may be of further interest to you:
- Deficit spending 101 – Part 1
- Deficit spending 101 – Part 2
- Deficit spending 101 – Part 3
- Fiscal sustainability 101 – Part 1
- Fiscal sustainability 101 – Part 2
- Fiscal sustainability 101 – Part 3
Question 2:
A nation running an external deficit accompanied by a government sector surplus (of equal proportion to GDP as the external deficit) will soon be in recession unless the private domestic sector is willing to continually increase its overall indebtedness.
The answer is True.
This is a question about the sectoral balances – the government fiscal balance, the external balance and the private domestic balance – that have to always add to zero because they are derived as an accounting identity from the national accounts.
To refresh your memory the balances are derived as follows. The basic income-expenditure model in macroeconomics can be viewed in (at least) two ways: (a) from the perspective of the sources of spending; and (b) from the perspective of the uses of the income produced. Bringing these two perspectives (of the same thing) together generates the sectoral balances.
From the sources perspective we write:
(1) GDP = C + I + G + (X – M)
which says that total national income (GDP) is the sum of total final consumption spending (C), total private investment (I), total government spending (G) and net exports (X – M).
Expression (1) tells us that total income in the economy per period will be exactly equal to total spending from all sources of expenditure.
We also have to acknowledge that financial balances of the sectors are impacted by net government taxes (T) which includes all tax revenue minus total transfer and interest payments (the latter are not counted independently in the expenditure Expression (1)).
Further, as noted above the trade account is only one aspect of the financial flows between the domestic economy and the external sector. we have to include net external income flows (FNI).
Adding in the net external income flows (FNI) to Expression (2) for GDP we get the familiar gross national product or gross national income measure (GNP):
(2) GNP = C + I + G + (X – M) + FNI
To render this approach into the sectoral balances form, we subtract total net taxes (T) from both sides of Expression (3) to get:
(3) GNP – T = C + I + G + (X – M) + FNI – T
Now we can collect the terms by arranging them according to the three sectoral balances:
(4) (GNP – C – T) – I = (G – T) + (X – M + FNI)
The the terms in Expression (4) are relatively easy to understand now.
The term (GNP – C – T) represents total income less the amount consumed less the amount paid to government in taxes (taking into account transfers coming the other way). In other words, it represents private domestic saving.
The left-hand side of Equation (4), (GNP – C – T) – I, thus is the overall saving of the private domestic sector, which is distinct from total household saving denoted by the term (GNP – C – T).
In other words, the left-hand side of Equation (4) is the private domestic financial balance and if it is positive then the sector is spending less than its total income and if it is negative the sector is spending more than it total income.
The term (G – T) is the government financial balance and is in deficit if government spending (G) is greater than government tax revenue minus transfers (T), and in surplus if the balance is negative.
Finally, the other right-hand side term (X – M + FNI) is the external financial balance, commonly known as the current account balance (CAD). It is in surplus if positive and deficit if negative.
In English we could say that:
The private financial balance equals the sum of the government financial balance plus the current account balance.
We can re-write Expression (6) in this way to get the sectoral balances equation:
(5) (S – I) = (G – T) + CAB
which is interpreted as meaning that government sector deficits (G – T > 0) and current account surpluses (CAB > 0) generate national income and net financial assets for the private domestic sector.
Conversely, government surpluses (G – T < 0) and current account deficits (CAB < 0) reduce national income and undermine the capacity of the private domestic sector to add financial assets.
Expression (5) can also be written as:
(6) [(S – I) – CAB] = (G – T)
where the term on the left-hand side [(S – I) – CAB] is the non-government sector financial balance and is of equal and opposite sign to the government financial balance.
This is the familiar MMT statement that a government sector deficit (surplus) is equal dollar-for-dollar to the non-government sector surplus (deficit).
The sectoral balances equation says that total private savings (S) minus private investment (I) has to equal the public deficit (spending, G minus taxes, T) plus net exports (exports (X) minus imports (M)) plus net income transfers.
All these relationships (equations) hold as a matter of accounting and not matters of opinion.
The following Table represents three cases in percent of GDP terms.
To aid interpretation remember that (S – I) < 0 means that the private domestic sector is spending more than they are earning; that (G – T) < 0 means that the government is running a surplus because T > G; and (X – M) < 0 means the external position is in deficits because exports are less than imports (abstracting from the net income transfers).
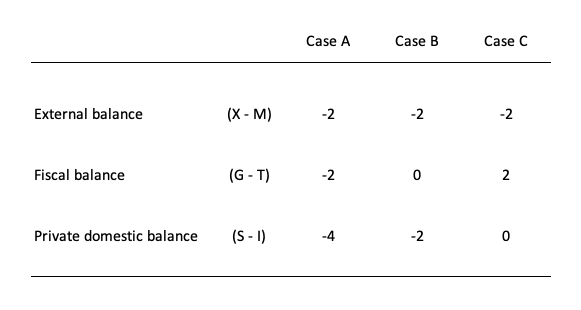
Case 1:
1. External deficit of 2 per cent of GDP.
2. Government surplus of 2 per cent of GDP.
3. Results in Private domestic deficit of 4 per cent of GDP.
4. Assessment: This could only persist if the private domestic sector was willing to increase its indebtedness and that process is finite. If the private domestic sector was unwilling, or subsequently, tried to reduce their debt exposure, then if the other balances remained as they are, then recession would soon follow.
Case 2:
1. External deficit of 2 per cent of GDP.
2. Government fiscal balance.
3. Results in Private domestic deficit of 3 per cent of GDP.
4. Assessment: This could only persist if the private domestic sector was willing to increase its indebtedness and that process is finite. If the private domestic sector was unwilling, or subsequently, tried to reduce their debt exposure, then if the other balances remained as they are, then recession would soon follow.
Case 3:
1. External deficit of 2 per cent of GDP.
2. Government deficit of 2 per cent of GDP.
3. Results in Private domestic balance
4. Assessment: So if the Private domestic sector desires to save overall and there is an external deficit, then the government deficit has to be higher (in GDP terms) than the external deficit, or else recession will follow.
So what is the economic rationale for this result?
If the nation is running an external deficit it means that the contribution to aggregate demand from the external sector is negative – that is net drain of spending – dragging output down.
The external deficit also means that foreigners are increasing financial claims denominated in the local currency. Given that exports represent a real costs and imports a real benefit, the motivation for a nation running a net exports surplus (the exporting nation in this case) must be to accumulate financial claims (assets) denominated in the currency of the nation running the external deficit.
A fiscal surplus also means the government is spending less than it is “earning” and that puts a drag on aggregate demand and constrains the ability of the economy to grow.
In these circumstances, for income to be stable, the private domestic sector has to spend more than they earn.
You can see this by going back to the aggregate demand relations above. For those who like simple algebra we can manipulate the aggregate demand model to see this more clearly.
Y = GDP = C + I + G + (X – M)
which says that the total national income (Y or GDP) is the sum of total final consumption spending (C), total private investment (I), total government spending (G) and net exports (X – M).
So if the G is spending less than it is “earning” and the external sector is adding less income (X) than it is absorbing spending (M), then the other spending components must be greater than total income.
The following blog posts may be of further interest to you:
- Barnaby, better to walk before we run
- Stock-flow consistent macro models
- Norway and sectoral balances
- The OECD is at it again!
Question 3:
To maintain financial stability, the monetary base has to be driven by changes in the money supply just as the money multiplier in mainstream macroeconomics textbooks explains.
The answer is False.
This is a trick question. The first part concerning the causality between the money base and the money supply is true but the second relating to the money multiplier is false because that theory predicts the opposite causality). So the overall proposition false.
Mainstream macroeconomics textbooks provide an incorrect discussion of the credit-creation capacity of commercial banks. The concept of the money multiplier is at the centre of this analysis and posits that the multiplier m transmits changes in the so-called monetary base (MB) (the sum of bank reserves and currency at issue) into changes in the money supply (M). The chapters on money usually present some arcane algebra which is deliberately designed to impart a sense of gravitas or authority to the students who then mindlessly ape what is in the textbook.
They rehearse several times in their undergraduate courses (introductory and intermediate macroeconomics; money and banking; monetary economics etc) the mantra that the money multiplier is usually expressed as the inverse of the required reserve ratio plus some other novelties relating to preferences for cash versus deposits by the public.
Accordingly, the students learn that if the central bank told private banks that they had to keep 10 per cent of total deposits as reserves then the required reserve ratio (RRR) would be 0.10 and m would equal 1/0.10 = 10. More complicated formulae are derived when you consider that people also will want to hold some of their deposits as cash. But these complications do not add anything to the story.
The formula for the determination of the money supply is: M = m x MB. So if a $1 is newly deposited in a bank, the money supply will rise (be multiplied) by $10 (if the RRR = 0.10). The way this multiplier is alleged to work is explained as follows (assuming the bank is required to hold 10 per cent of all deposits as reserves):
- A person deposits say $100 in a bank.
- To make money, the bank then loans the remaining $90 to a customer.
- They spend the money and the recipient of the funds deposits it with their bank.
- That bank then lends 0.9 times $90 = $81 (keeping 0.10 in reserve as required).
- And so on until the loans become so small that they dissolve to zero
This is not an accurate depiction of how the banks make loans.
The money multiplier myth also leads students to think that as the central bank can control the monetary base then it can control the money supply. Further, given that inflation is allegedly the result of the money supply growing too fast, then the blame is sheeted home to the “government”. This leads to claims that if the government runs a fiscal deficit then it has to issue bonds to avoid causing hyperinflation.
The idea that the monetary base (the sum of bank reserves and currency) leads to a change in the money supply via some multiple is not a valid representation of the way the monetary system operates.
First, the central bank does not have the capacity to control the money supply in a modern monetary system. In the world we live in, bank loans create deposits and are made without reference to the reserve positions of the banks. The bank then ensures its reserve positions are legally compliant as a separate process knowing that it can always get the reserves from the central bank. The only way that the central bank can influence credit creation in this setting is via the price of the reserves it provides on demand to the commercial banks.
Second, this suggests that the decisions by banks to lend may be influenced by the price of reserves rather than whether they have sufficient reserves. They can always get the reserves that are required at any point in time at a price, which may be prohibitive.
Third, the money multiplier story has the central bank manipulating the money supply via open market operations. So they would argue that the central bank might buy bonds to the public to increase the money base and then allow the fractional reserve system to expand the money supply. But a moment’s thought will lead you to conclude this would be futile unless (as in Question 3 a support rate on excess reserves equal to the current policy rate was being paid).
Why? The open market purchase would increase bank reserves and the commercial banks, in lieu of any market return on the overnight funds, would try to place them in the interbank market. Of-course, any transactions at this level (they are horizontal) net to zero so all that happens is that the excess reserve position of the system is shuffled between banks. But in the process the interbank return would start to fall and if the process was left to resolve, the overnight rate would fall to zero and the central bank would lose control of its monetary policy position (unless it was targetting a zero interest rate).
In lieu of a support rate equal to the target rate, the central bank would have to sell bonds to drain the excess reserves. The same futility would occur if the central bank attempted to reduce the money supply by instigating an open market sale of bonds.
In all cases, the central bank cannot influence the money supply in this way.
Fourth, given that the central bank adds reserves on demand to maintain financial stability and this process is driven by changes in the money supply as banks make loans which create deposits.
So the operational reality is that the dynamics of the monetary base (MB) are driven by the changes in the money supply which is exactly the reverse of the causality presented by the monetary multiplier.
So in fact we might write MB = M/m.
You might like to read these blog posts for further information:
- Teaching macroeconomics students the facts
- Lost in a macroeconomics textbook again
- Lending is capital- not reserve-constrained
- Oh no … Bernanke is loose and those greenbacks are everywhere
- Building bank reserves will not expand credit
- Building bank reserves is not inflationary
- 100-percent reserve banking and state banks
- Money multiplier and other myths
That is enough for today!
(c) Copyright 2019 William Mitchell. All Rights Reserved.
This Post Has 0 Comments