Australian national accounts – government spending saves nation from zero growth
The Australian Bureau of Statistics released the latest – Australian National Accounts: National Income, Expenditure and Product, September 2025 – today (December 3, 2025), which shows that the Australian economy slowed to 0.4 per cent (from 0.6 per cent) in the September-quarter 2025. At the current annual growth rate, unemployment is predicted to rise further, given current labour force and productivity growth (see below). Household consumption expenditure growth weakened while public and private investment was stronger. The 0.4 point overall government contribution was the difference between zero growth and the positive result recorded.
The main features of the National Accounts release for the September-quarter 2025 were (seasonally adjusted):
- Real GDP increased by 0.4 per cent for the quarter (0.6 per cent last quarter). The annual growth rate was 2.1 per cent (1.8 last quarter).
- GDP per capita was flat (+0.2 per cent last quarter) and 0.4 per cent for the year.
- Australia’s Terms of Trade rose 0.3 per cent for the quarter and -0.2 per cent over the 12 month period.
- Real net national disposable income, which is a broader measure of change in national economic well-being, rose by 0.4 per cent for the quarter (0.5 last quarter) and 2.1 per cent over the 12 months (steady).
- The Household saving ratio (from disposable income) rose to 6.4 per cent from 6 per cent.
- GDP per hour worked rise 0.2 per cent for the quarter (0.4 last quarter) and 0.8 per cent for the year.
Overall growth picture – growth rate much stronger than in recent past
The ABS – Media Release – said that:
Australian gross domestic product (GDP) rose 0.4 per cent in the September quarter 2025 and 2.1 per cent compared to a year ago …
… Economic growth was steady in the September quarter 2025. The rise this quarter matches the average quarterly growth since the end of the COVID‑19 Pandemic …
GDP per capita was flat for the quarter as economic growth was in line with population growth but remained 0.4 per cent higher than a year ago ,,,
Private investment contributed 0.5 percentage points to GDP growth in the September quarter … driven by machinery and equipment investment, which rose 7.6 per cent … reflects the ongoing expansions of data centres. This is likely due to firms looking to support growth in artificial intelligence and cloud computing capabilities …
Household spending rose 0.5 per cent in the September quarter following a 0.9 per cent rise in the June quarter.
Essential spending was up 1.0 per cent, driven by payments for banking and superannuation services, electricity and health.
Households shifted away from discretionary spending, down 0.2 per cent in the September quarter.
Public investment rose 3.0 per cent in the September quarter … with investment growth in renewable energy, water, telecommunications and rail transport projects …
Net trade detracted 0.1 percentage points from GDP growth, with imports up 1.5 per cent, and exports up 1.0 per cent …
The household saving to income ratio rose to 6.4 per cent in the September quarter … Gross disposable income rose 1.7 per cent, faster than the rise in nominal household spending of 1.4 per cent.
The short story:
1. Household consumption expenditure growth weakened while public and private investment was stronger..
2. The 0.4 point overall government contribution was the difference between zero growth and the positive result recorded.
3. At this growth rate, the unemployment rate is likely to rise.
The next graph shows the quarterly growth over the last five years with the extreme observations during the worst part of the COVID restrictions and government income support taken out.
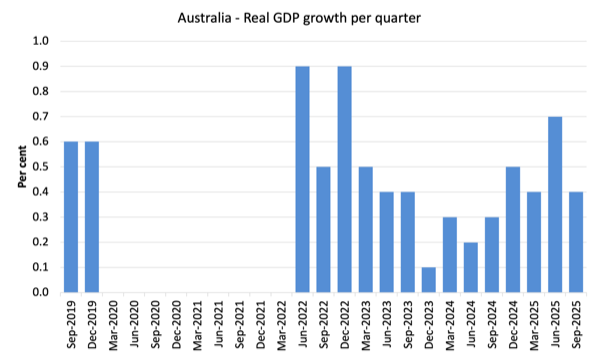
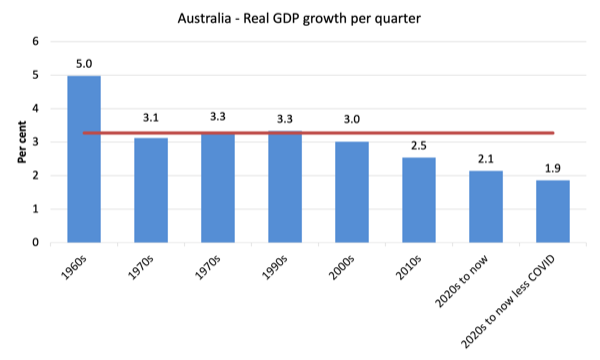
To put this into historical context, the next graph shows the decade average annual real GDP growth rate since the 1960s (the horizontal red line is the average for the entire period (3.27 per cent) from the September-quarter 1960 to the September-quarter 2025.
Although COVID severely interrupted the economy, once we take out the quarters between March 2020 and March 2022 (inclusive), then the average since 2020 has been 1.9 per cent per annum – very mediocre.
It is also obvious how far below historical trends the growth performance of the last 2 decades have been as the fiscal surplus obsession has intensified on both sides of politics.
Even with a massive household credit binge and a once-in-a-hundred-years mining boom that was pushed by stratospheric movements in our terms of trade, our real GDP growth has declined substantially below the long-term performance.
The 1960s was the last decade where government maintained true full employment.
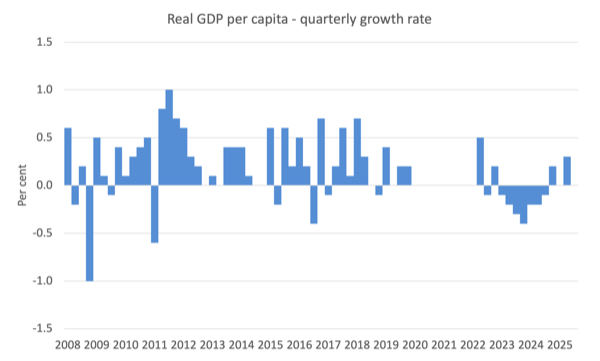
GDP per capita flat
In the September-quarter 2025, GDP per capita grew by zero per cent (the red arrow marks the spot!) – thus, real GDP growth matched the population growth.
While commentators focus on this statistics, the meaning of the average is questionable, given the highly skewed income distribution towards the top end.
What we can say is that if the average is declining, then those at the bottom are doing it very tough indeed.
The following graph of real GDP per capita (which omits the pandemic restriction quarters between December-quarter 2020 and December-quarter 2021) tells the story.
Analysis of Expenditure Components
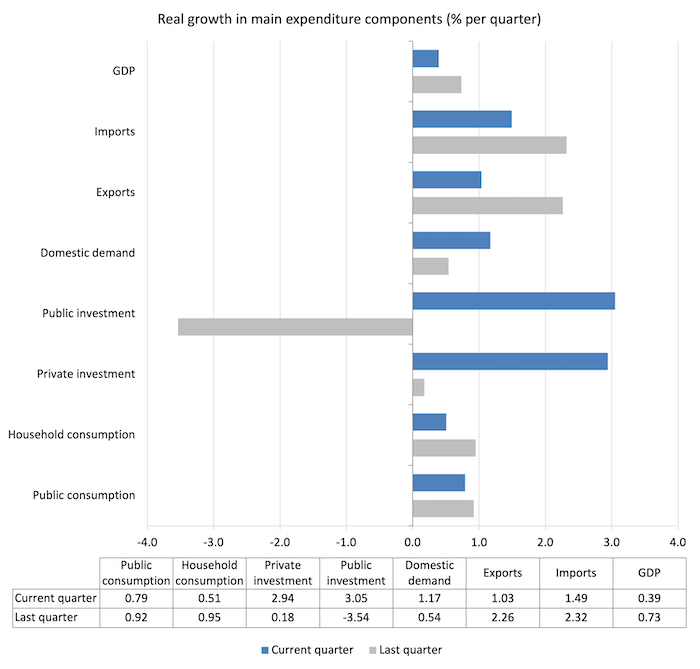
The following graph shows the quarterly percentage growth for the major expenditure components in real terms for the June-quarter 2025 (grey bars) and the September-quarter 2025 (blue bars).
- Household consumption expenditure growth declined.
- Private and public investment expenditure was stronger.
- Import growth outstripped export growth – so net exports was negative.
- Public consumption expenditure remained strong.
Contributions to growth
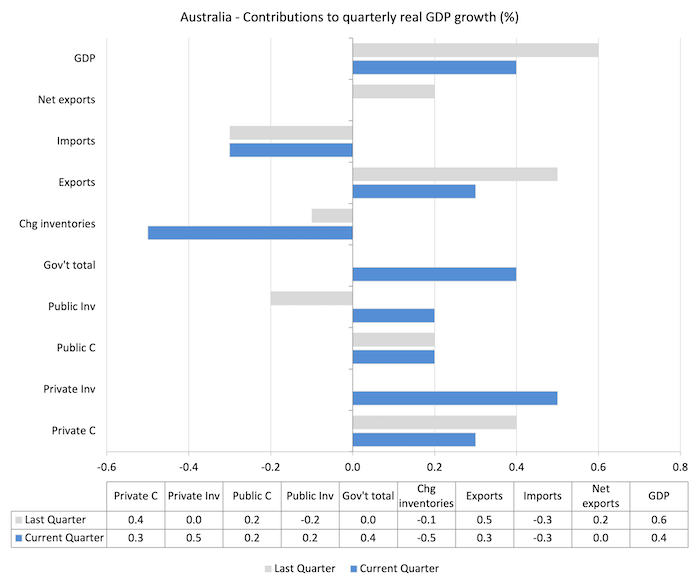
The following bar graph shows the contributions to real GDP growth (in percentage points) for the main expenditure categories. It compares the September-quarter 2025 contributions (blue bars) with the previous quarter (gray bars).
- Household consumption expenditure added 0.3 points (down from 0.4).
- Private investment expenditure added 0.5 points (up from zero).
- Net exports added zero points (down from 0.2) – the 0.3 point export contribution outweighed the -0.3 points import subtraction (remember positive import expenditure growth constitutes a loss of growth).
- Overall government contribution was 0.4 points – the recurrent contribution (0.2 points) adding to the capital contraction (0.2 points).
Material living standards rose 0.4 points in the September-quarter
The ABS tell us that:
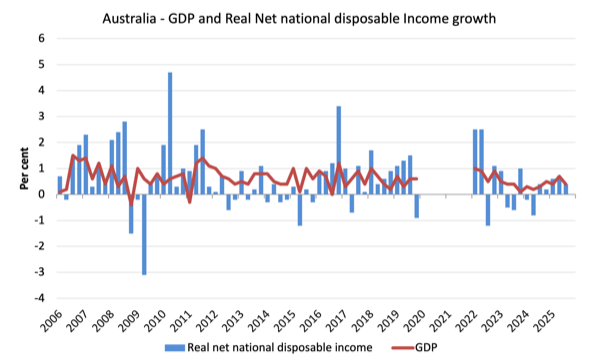
A broader measure of change in national economic well-being is Real net national disposable income. This measure adjusts the volume measure of GDP for the Terms of trade effect, Real net incomes from overseas and Consumption of fixed capital.
While real GDP growth (that is, total output produced in volume terms) rose by 0.4 per cent in the September-quarter, real net national disposable income growth rose by 0.4 per cent.
How do we explain that?
Answer: The terms of trade grew by 0.3 per cent in the September-quarter which complemented the rise in compensation of employees (COE) of 1.7 per cent.
However, some of the COE rise was dure to “increases in redundancies … paid by the Financial and Insurance Sevice and Administrative and Support Services industries”.
Slight gain in productivity growth
Real GDP rose 0.4 per cent for the quarter, while the growth in working hours was 0.3 per cent.
Which means that GDP per hour rose by 0.71 per cent for the year.
This is the second consecutive quarter of labour productivity growth after three consecutive quarters of declining productivity growth.
The sectoral productivity growth was:
- Market sector – 1.0 per cent (annual), -0.1 per cent (quarter).
- Non-market sector – minus 0.3 per cent (annual), 0.3 per cent (quarter).
- Overall – 0.7 per cent (annual), 0.1 per cent (quarter).
The following graph presents quarterly growth rates in real GDP and hours worked using the National Accounts data for the last five years to the September-quarter 2025.

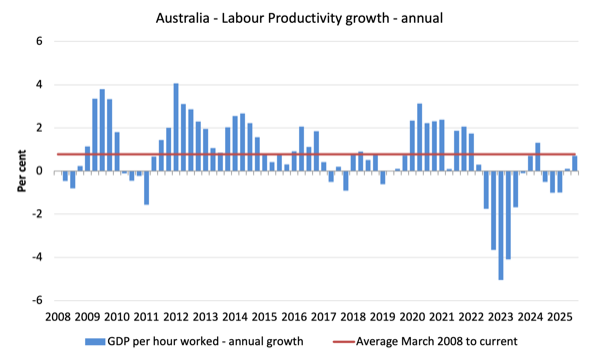
To see the above graph from a different perspective, the next graph shows the annual growth in GDP per hour worked (labour productivity) from the beginning of 2008 to the September-quarter 2025.
The horizontal red line is the average annual growth since the September-quarter 2008 (0.77 per cent), which itself is an understated measure of the long-term trend growth of around 1.5 per cent per annum.
Household saving ratio improves by 0.4 points
The RBA tried to wipe out the household saving buffers as it hiked interest rates hoping that this would reduce the likelihood of recession.
Of course, that process attacked the lower-end of the wealth and income distribution, given the rising interest rates have poured millions into those with interest-rate sensitive financial assets.
Households then became cautious – reducing overall expenditure growth and increasing their saving out of their disposable income.
While household spending growth outstripped the growth in disposable income in the June-quarter 2025, the trend to higher saving ratios returned in the September-quarter.
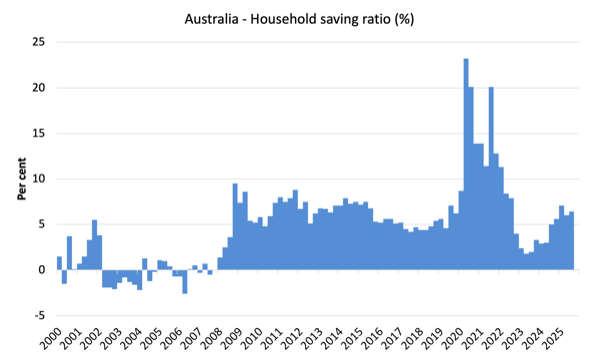
The following graph shows the household saving ratio (% of disposable income) from the December-quarter 2000 to the current period.
It shows the period leading up to the GFC, where the credit binge was in full swing and the saving ratio was negative to the rise during the GFC and then the most recent rise.
An increasing saving ratio provides the household sector overall with an increased capacity to risk manage in the face of uncertainty.
The next graph shows the saving ratio since 1960, which illustrates the way in which the neoliberal period has squeezed household saving.

Going back to the pre-GFC period, the household saving ratio was negative and consumption growth was maintained by increasing debt – which is an unsustainable strategy given that household debt is so high.
Even though the ratio has been rising slightly in recent quarters, it is still well below past levels.
The following table shows the impact of the neoliberal era on household saving. These patterns are replicated around the world and expose our economies to the threat of financial crises much more than in pre-neoliberal decades.
| Decade | Average Household Saving Ratio (% of disposable income) |
| 1960s | 13.9 |
| 1970s | 16.0 |
| 1980s | 11.8 |
| 1990s | 4.8 |
| 2000s | 1.2 |
| 2010s | 6.2 |
| 2020s on | 8.7 |
| Since RBA hikes | 4.4 |
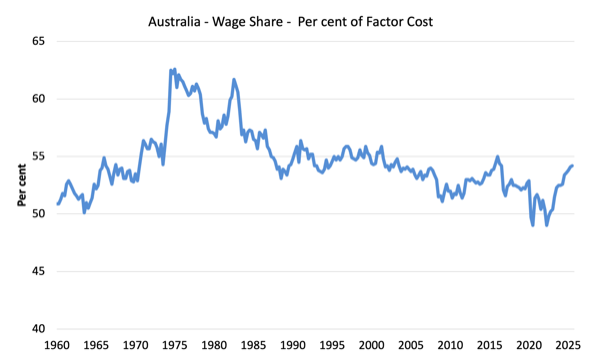
The distribution of national income – wage share rose 0.1 point
The wage share in national income rose 0.1 point to 54.2 per cent in the September-quarter 2025.
It hasn’t been that high since the September-quarter 2016.
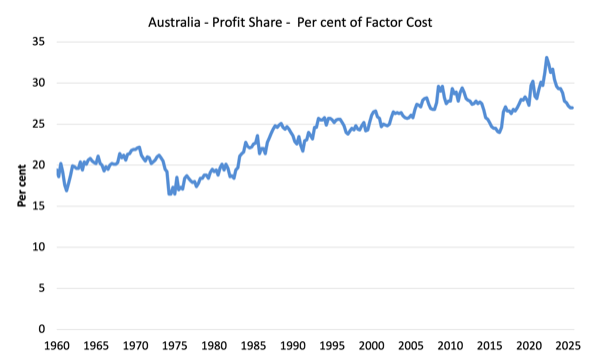
The profit share was steady on 27 per cent.
The residual is largely the government share.
The first graph shows the wage share in national income while the second shows the profit share.
The declining share of wages historically is a product of neoliberalism and will ultimately have to be reversed if Australia is to enjoy sustainable rises in standards of living without record levels of household debt being relied on for consumption growth.
Some disturbing arithmetic – unemployment is going to rise
The real GDP growth rate doesn’t relate to the labour market in any direct way.
The late Arthur Okun is famous (among other things) for estimating the relationship that links the percentage deviation in real GDP growth from potential to the percentage change in the unemployment rate – the so-called Okun’s Law.
The algebra underlying this law can be manipulated to estimate the evolution of the unemployment rate based on real output forecasts.
From Okun, we can relate the major output and labour-force aggregates to form expectations about changes in the aggregate unemployment rate based on output growth rates.
A series of accounting identities underpins Okun’s Law and helps us, in part, to understand why unemployment rates have risen.
Take the following output accounting statement:
(1) Y = LP*(1-UR)LH
where Y is real GDP, LP is labour productivity in persons (that is, real output per unit of labour), H is the average number of hours worked per period, UR is the aggregate unemployment rate, and L is the labour-force. So (1-UR) is the employment rate, by definition.
Equation (1) just tells us the obvious – that total output produced in a period is equal to total labour input [(1-UR)LH] times the amount of output each unit of labour input produces (LP).
Using some simple calculus we can convert Equation (1) into an approximate dynamic equation expressing percentage growth rates, which in turn, provides a simple benchmark to estimate, for given labour-force and labour productivity growth rates, the increase in output required to achieve a desired unemployment rate.
Skipping the algebra, we arrive at the approximate rule of thumb:
If the unemployment rate is to remain constant, the rate of real output growth must equal the rate of growth in the labour-force plus the growth rate in labour productivity.
It is an approximate relationship because cyclical movements in labour productivity (changes in hoarding) and the labour-force participation rates can modify the relationships in the short-run. But it provides reasonable estimates of what happens when real output changes.
The sum of labour force and productivity growth rates is referred to as the required real GDP growth rate – required to keep the unemployment rate constant.
Remember that labour productivity growth (real GDP per person employed) reduces the need for labour for a given real GDP growth rate while labour force growth adds workers that have to be accommodated for by the real GDP growth (for a given productivity growth rate).
So in the example, the required real GDP growth rate is 3 per cent per annum and so the actual real GDP growth is also equal to this required real GDP growth rate. In other words, the unemployment rate will remain unchanged.
Unemployment would still be rising but the rate of unemployment will be constant.
The current national accounts and labour force data tells us that;
- Annual labour force growth is around 1.9 per cent (averaged since 2000).
- Annual Labour productivity growth was 0.7 per cent in the September-quarter 2025.
- The required annual GDP growth rate is thus 2.6 per cent.
- Annual Real GDP growth was 2.1 per cent in the September-quarter 2025.
The data suggests that over the next 12 months the unemployment rate will rise by around 0.5 points at the current trajectory.
Conclusion
Remember that the National Accounts data is three months old – a rear-vision view – of what has passed and to use it to predict future trends is not straightforward.
The Australian economy grew by 0.4 per cent in the September-quarter 2025 (down from 0.6 per cent) and by 2,1 per cent (up from 1.8) over the 12 months.
Household consumption expenditure growth weakened while public and private investment was stronger.
The 0.4 point overall government contribution was the difference between zero growth and the positive result recorded.
At this growth rate, the unemployment rate is likely to rise.
Clarification on terminology
I advocated a degrowth strategy for the global economy overall given that our footprint is 1.7 times the capacity of the biosphere to regenerate.
To achieve that strategy, given that many poorer nations must continue to grow, will require rather substantial cut backs in spending and consumption in the richer nations.
When I analyse the National Accounts data or any expenditure/output data, I write as if growth is ‘good’.
But that terminology is used in the context that without economic growth and without any substantial shifts in income distribution and government transition policies, trying to pursue a recessionary strategy would damage the weakest members of our society disproportionately.
In some respects, I am abstracting from the damaging reality of our ecological footprint.
That is enough for today!
(c) Copyright 2025 William Mitchell. All Rights Reserved.
This Post Has 0 Comments