I am travelling today to Tokyo and have little time to write here. But with…
Income shifts towards profits – a repeating destructive phenomenon
This is an extension of yesterday’s blog on the Australian national accounts release (Australian economy was slowing fast in March-quarter 2017 and outlook negative and delves further into the income side of the results, which are, frankly, stunning. They also accord with general global trends which I have written about in the past, which are creating further income inequality and damaging stable damaging growth prospects. Yesterday’s data confirmed that over the last two quarters (at least) almost all of the income growth has been captured by profits, with real wages and salaries actually falling in the March-quarter 2017. No wonder the growth in consumption spending fell away in the first part of 2017. Does that matter? Well, a rise in the profit share undermines consumption spending. If consumption spending is weak, the opportunities for profitable investment in new productive capital decline. Economies that are growing strongly provide a fertile environment for private investment. Austerity-ridden economies undermine private investment. Economies where consumption is falling due to real wage suppression also do not provide a buoyant investment climate. Flat wages growth in Australia has seen the saving ratio fall back towards zero and households take on ever more debt burdens. The Household debt to disposable income ratio is now at record levels. The declining wage share and the resulting credit binge in many nations were clearly causal in creating the global financial crisis. The mainstream economists believed that the markets were efficient and that there would be no problems with placing an increasing proportion of real income into the hands of the Casino economy. They were wrong. And with the same trends now repeating – they will be wrong again.
The income account
National Accounting embracing various ways of viewing ‘economic activity’. The goal is to estimate Gross Domestic Product (GDP), which is the measure of all currently produced final goods and services evaluated at market prices.
I don’t want to discuss all the nuances of that definition and the obvious shortcomings of it in terms of providing an accurate assessment of societal well-being or progress. That is another debate.
There are three ‘views’ of economic activity that the national accounting system offers.
In other words, GDP can be measured in three ways, namely the expenditure approach, the production approach and the income approach, and which, subject to the statistical discrepancy, should be equal.
The expenditure approach is conceptually the simplest because it works on the principle that total expenditures denote the value of the product that has been bought, and given the inclusion of inventory investment in the definition of investment, it measures the value of total production.
The production (or value added) approach is based on summing the gross outputs of every class of enterprise and then netting out intermediate consumption.
Finally, the income approach works on the principle that the incomes of the productive factors (producers) must be equal to the value of their product, and thus measures GDP by summing all producers’ incomes.
It is this last ‘view’ that I am focusing on today.
From yesterday’s Australian Bureau of Statistics national accounts release – Income at Current Prices we learn the following:
1. In nominal terms (that is, at current prices), GDP increased by 7.7 per cent between March 2016 and March 2017 (seasonally adjusted). Total factor income (which is GDP minus taxes less subsidies on production and imports) rose by 7.5 per cent.
Most of that growth has come from the rebound in the Terms of Trade which grew by a massive 24.8 per cent in the 12 months to March 2017.
That also means that the nominal income growth will have been concentrated in the Mining sector. This is a highly capital-intensive sector and employment has declined significantly (by 13.2 per cent) since the peak in the May-quarter 2012.
2. Total wages and salaries paid out grew by just 1.4 per cent between March 2016 and March 2017.
If you take into account the fact that the rate of inflation over that period was 2.12 percent, then wage and salary incomes for workers declined sharply over this period.
3. The gross operating surplus for private non-financial corporations grew by 30.5 per cent and for corporations overall by 22.6 per cent.
In an earlier ABS release (June 5, 2017) – Business Indicators, Australia, Mar 2017 – we learned that company gross operating profits had increased by 39.7 per cent between March 2016 and March 2017.
That publication also estimated that wages and salaries increased by just 0.9 per cent over the same period.
The ABS note that the two profit measures are not identical. The company gross operating profits (CGOP) does not make adjustment for the “value of inventories held by Australian business” whereas the GOS measure in the national accounts does take those valuation changes into account. There are other differences as well relating to benchmarking which do not need to concern us here.
The point is that company profits in the year to March 2017 rose by somewhere between 22.6 per cent and 39.7 per cent in nominal terms and a slightly smaller number in real terms, given the inflation rate.
In other words, almost all the income growth over the last 12 months in Australia has gone to profits (once you take the relatively small growth in the Government GOS).
Workers have lost income ground in real terms significantly.
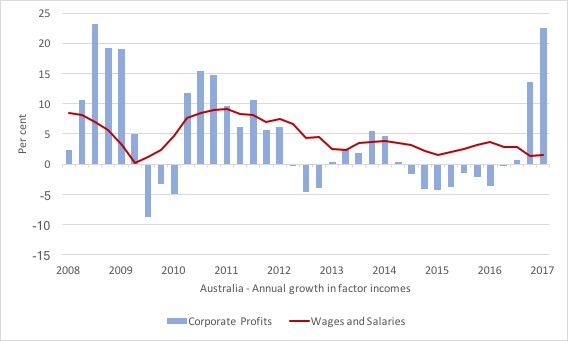
This graph shows the annual growth in Corporate GOS and Employee Compensation (Wages and Salaries) since the March-quarter 2008.
So in the early days of the crisis, as the federal government’s fiscal stimulus was at work to save the economy from recession, the major beneficiaries were the corporate sector.
The growth from mid-2010 to around mid-2012 (just before the major fiscal shift towards austerity began) was more evenly shared between wages and profits.
The imposition of austerity in the 2012 fiscal statement not only slowed GDP growth significantly but impacted badly on both profits and wages growth.
This pattern has been broken in the last two quarters with huge gains in profits (mostly in the mining sector) and real wage cuts.
Some national income mathematics – simple!
The nominal wage (W) – that is paid by employers to workers is determined in the labour market – by the contract of employment between the worker and the employer. The price level (P) is determined in the goods market and reflects the degree of price setting power that firms have in that market.
The real wage (w) tells us what volume of real goods and services the nominal wage (W) will be able to command. For a given W, the lower is P the greater the purchasing power of the nominal wage and so the higher is the real wage (w).
If nominal wages lag behind inflation then the real wage declines.
The relationship between the real wage and labour productivity relates to movements in the unit costs, real unit labour costs and the wage and profit shares in national income.
The wage share in nominal GDP is expressed as the total labour costs as a percentage of nominal GDP, that is:
(W.L)/$GDP
W is total wages and salaries, L is total employment. Economists differentiate between nominal GDP ($GDP), which is total output produced at market prices and real GDP (GDP), which is the actual physical equivalent of the nominal GDP.
Note that labour productivity (LP) equals the units of real GDP per person employed per period. Using the symbols already defined this can be written as:
LP = GDP/L
Nominal GDP ($GDP) = P.GDP
Real GDP nets out the price component of total output (GDP).
Manipulating these terms in relation to the wage share formula we get:
Wage share = (W.L) divided by P.GDP
Or in equivalent terms as:
Wage share = (W/P) x (L/GDP)
So an equivalent but more convenient measure of the wage share is:
Wage share = (W/P) divided (GDP/L) – that is, the real wage (W/P) divided by labour productivity (GDP/L).
So if the the nominal wage (W) and the price level (P) are growing at the pace the real wage is constant. And if the real wage is growing at the same rate as labour productivity, then both terms in the wage share ratio are equal and so the wage share is constant.
We can also view productivity growth as providing the “room” in the distribution system for workers to enjoy a greater command over real production and thus higher living standards without threatening inflation.
Since the mid-1980s, the neo-liberal assault on workers’ rights (trade union attacks; deregulation; privatisation; persistently high unemployment) has seen this nexus between real wages and labour productivity growth broken.
So while real wages have been stagnant or growing modestly, this growth has been dwarfed by labour productivity growth.
As a result, the distribution of national income has shifted in favour of profits.
The distributional shift
I have previously considered this topic in these blogs:
1. Reducing income inequality.
2. There is a class warfare and the workers are not winning.
3. Massive real wage cuts will not improve growth prospects.
4. The origins of the economic crisis.
There are two broad facts that are agreed by most analysts in this area.
First, up until the early 1980s, real wages and labour productivity typically moved together. As the attacks on the capacity of workers to secure wage increases intensified, a gap between the two opened and widened.
The widening gap between real wages and productivity growth manifested as the rising profit share and the wage share in national income has fallen significantly over the last 35 years in most nations.
Second, in the Anglo nations, there has been a massive skewing of the personal income distribution such that the top percentile and decile of the distribution have substantially increased their shares.
The two trends are related and it would be hard for the second to occur without the first also occurring.
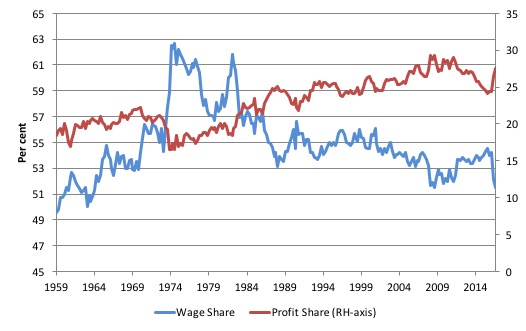
Yesterday’s national accounts data release showed that the wage share in Australia fell to 51.5 per cent of total factor income in the March-quarter 2017.
It hasn’t been that low since the March-quarter 2009, when the Australian economy was starting to absorb the GFC shock and just before the fiscal stimulus really started to work.
The profit share spiked up to 27.5 per cent of total factor income and is well above historical levels.
The following graph shows the historical movements in both shares since the September-quarter 1959 to the March-quarter 2017.
The wage share has been falling inexorably since the 1980s.
Does that matter?
If you look back through the Modern Monetary Theory (MMT) literature, dating back to the 1990s, you will see regular reference to the dangers in allowing real wages to lag behind productivity growth.
This phenomenon has been one of the characteristic neo-liberal trends, engendered by a ruthless attack on trade unions by co-opted governments, persistent mass unemployment and underemployment, and increased opportunities by firms to off-shore production to low-wage nations.
The declining wage share was one of the key drivers of the GFC – given that it forced households to increasingly rely on credit and rising debt to maintain spending.
The point is that these distributional shifts suggest that the neo-liberal ambitions by the corporate elites are once again getting ahead of themselves.
While the world economy survived (just) the GFC only as a result of the fiscal interventions by governments which socialised most of the losses, the destructive trends are once again evident.
Ultimately, no matter how much capital craves for profit, capitalism requires robust and sustainable household consumption expenditure for its continuity.
In turn, while capital continually strives to undermine wages and working conditions, the overwhelming source of that consumption spending is strong growth in worker incomes.
Capital thought it had evaded that contradiction by compelling governments to deregulate financial markets and push increasing levels of debt onto households.
The result – the GFC.
But they are back to that strategy – and the parameters appear to becoming more extreme (if the income movements in yesterday’s national accounts are anything to go by).
The result will be – another crisis.
It is clear that:
1. A rise in the profit share undermines consumption spending – spending out of wages is higher per dollar of income received.
2. If consumption spending is weak, the opportunities for profitable investment in new productive capital decline. Economies that are growing strongly provide a fertile environment for private investment. Austerity-ridden economies undermine private investment. Economies where consumption is falling due to real wage suppression also do not provide a buoyant investment climate.
3. Flat wages growth in Australia has seen the saving ratio fall back towards zero and households take on ever more debt burdens.
The Household debt to disposable income ratio is now at record levels.
The declining wage share and the resulting credit binge in many nations were clearly causal in creating the global financial crisis.
The mainstream economists believed that the markets were efficient and that there would be no problems with placing an increasing proportion of real income into the hands of the Casino economy.
They were wrong.
And with the same trends now repeating – they will be wrong again.
Real Unit Labour Costs plummeting but no employment growth in sight
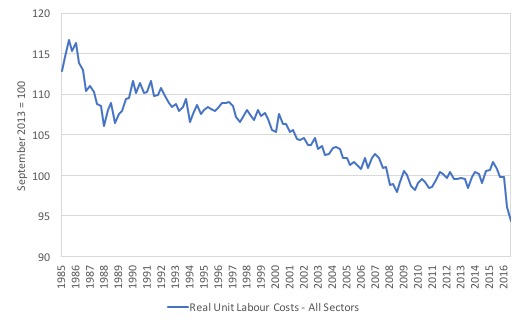
Another way of looking at the distributional shift is to see the decline in real unit labour costs. Table 42 of the quarterly national accounts data release (linked above) provides details on this.
The following graph shows the movement in RULCs since 1985 up to the current quarter (March 2017).
There has been a steady decline in RULCs since the neo-liberal period began but in recent years that hasn’t been associated with any significant change in the (weak) employment growth.
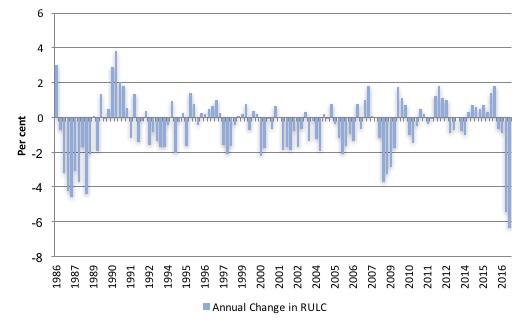
To demonstrate the way in which workers are being dudded at present, the following graph shows the annual change in RULC since the September-quarter 1986.
The big falls at the beginning of the series were due to the Hawke-Keating Labor government of the day embracing the neo-liberal myth that redistribution of national towards profits was necessary to kick-start growth after the crippling 1982 recession.
It was claimed that private capital formation was being damaged by the higher wage share. All the talk of that time in Australia was about the so-called ‘real wage overhang’ (that is, real wages being excessive in relation to productivity – or RULCs being too high).
The policy environment set about changing that – attacks on unions, manipulation of our centralised wage setting system, etc – yet the investment ratio barely moved.
The corporate sector pocketed the increased national income share as profits and this period really started the exhorbitant managerial salaries.
The most recent declines in RULC are the successive largest in our recorded history.
Something is badly wrong!
Declining wage share – global phenomenon
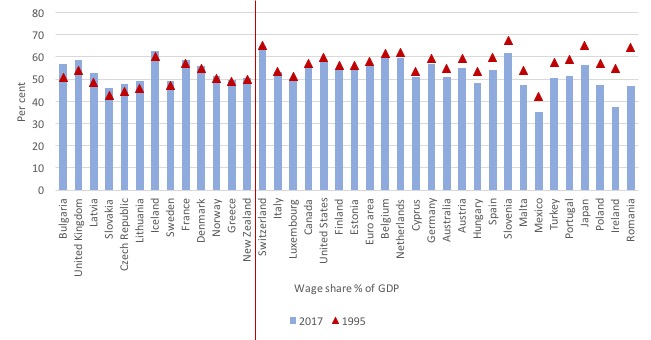
The following graph (taken from AMECO data) shows the wage share as a per cent of GDP for as many nations as have data for 1995 (red triangles) and 2017 (blue bars). The data is sorted by the size of the decline in wage share (the largest decline to the right).
The vertical red line demarcates those nations that have experienced rising wage shares (to the left) and those who have seen their wage share declining (to the right of the line).
The overwhelming observation is that the decline in the wage share is a world-wide phenomenon and began around the 1990s.
Conclusion
It is no wonder household consumption spending is slowing down quickly. The suppression of wages and salaries growth (now manifesting as real income cuts) and the capture of most of the income growth in Australia by corporations as profits leaves only one option for consumers – to borrow to maintain spending levels.
The problem with that strategy is that households are already carrying record levels of debt, which is unsustainable given the possible fluctuations in economic fortunes (a slight rise in unemployment translates into thousands of new bankruptcies and foreclosures).
The policy environment is encouraging this increasingly unbalanced economy. The costs that will be borne when it finally all unwinds – and the recession being endured by many workers becomes generalised – will be enormous.
Write it down as another example of neo-liberalism where corporate greed gets ahead of itself and a compliant workforce gives up spending the pittance of income growth the elites allow to filter down.
That is enough for today!
(c) Copyright 2017 William Mitchell. All Rights Reserved.
I’m not sure why this trend should surprise anyone. Corporate managers are evaluated and compensated almost entirely by how much they can return to shareholders. That is done by increasing net income which means some combination of increasing gross income and decreasing the cost of the various factors of production. Labor costs are just one of the latter. My own career was in computer software. Since the mid 70’s I’ve written programs which either replaced workers outright or enabled management to use less skilled workers to do the same work. For the most part that required only the tiniest amounts of the AI technology that I had learned. Many other sorts of advanced technology have had similar effects. I don’t view this as some nefarious plot to suppress worker incomes but rather the natural result of a system that rewards managers for decreasing the cost of labor. For the last 7 years I’ve given an annual talk about AI to high school seniors taking an advanced computer science class. The technological advances just over that short period of time have been nothing short of breathtaking. Just this year, for the first time, I included a discussion about the economic effects of the technolgy. I don’t have a solution to recommend, but the trends are clear and unstoppable and my fear is that large scale social upheavals may be the inevitable result before we really decide to address the problem in any meaningful way.
Bill, I don’t disagree with your calculations, but I strongly disagree with your interpretations.
Surely that depends on aggregate spending, not consumption spending?
The declining wage share DID NOT FORCE households to maintain spending.
People chose to maintain spending because they were confident about the future and because they could – and in many places because houses were much more expensive. Higher house prices were due to cheaper credit (a good thing because it reduces the finance share and enables businesses to make more long term decisions) and the lack of substantive land value taxation.
As you well know, the current declining household spending doesn’t have to lead to recession. It all depends on government spending. But there are some reasons why a higher profit share might be a good thing:
Firstly, because more value is in intellectual property, much of the profit is concentrated in the hands of a few firms. If the profit share were as low as it used to be, most businesses would be worse off then they used to be, and many would be in serious trouble.
Secondly, a high profit share makes the economy much more resilient to supply shocks. We don’t want to return to the OPEC-induced high inflation of the 1970s, but many people predict Peak Oil will have a similar effect.
Thirdly, a higher profit share encourages more people to start their own businesses, resulting in more competition, making consumers better off and putting downward pressure on inflation.
I suppose wage profit share also would be manifested in difference in GDP growth per capita and consumption growth. With investment at a fairly constant level.
Isn’t there a difference in the expenditure messurement between private and public produced? The private side is by market value and public by production cost. Which disadvantage the latter in productivity growth measurement?
When one look at GDP growt in the long term, how much does changes in inflation messurement models impact. As I understand it, in the early 90s the way to messure inflation changed. One time tax rises was downplayed, substitute gods and services was introduced, hedonic indexes and what more. The model in it self lowered inflation compared to before. Using the old model growth in neoliberal globalization would had been lower?
@Aiden Stanger…
I interpreted the point as being that a greater and greater portion of the nations wealth is becoming concentrated in a smaller and smaller number of hands – which does not bode well for consumption, given that even Rupert Murdoch (expat though he may be) still has only one d**k and one stomach and there is only so much he can do for them.
With an ever-falling share of national income going to your average consumer, where will the demand for increasing volumes of goods and services to encourage increasing numbers of successful new business start-ups come from? Not from solidly increasing rates of household borrowing on an ongoing basis, we look to have about exhausted that avenue.
I’m not 100% certain as to what you mean when you say that a high profit share makes the economy much more resilient to supply shocks. If you’re saying that a lower wages share resulting from a greatly weakened trade union movement makes destructive wage-price spirals unlikely then I would agree that probably is the case. But simply having capital force the cost of any such adjustment onto labour with impunity when labour’s ability to consume capital’s output is already deteriorating and millions of household balance sheets are precarious doesn’t seem like an economy resilient to shocks to me, more like a recipe for a potential economic implosion.
@Leftwinghillbillyprospector
A greater profit share doesn’t necessarily mean fewer hands, as a lot of the companies have many shareholders. And a lower wage share doesn’t always mean that those on wages are getting less wealthy – they could be getting more wealthy at a slower rate than what the economy’s growing at. Though as Bill has shown, that’s not what’s happening at the moment.
Not all business startups are aimed at consumers – some provide services to other businesses and governments, for example. But for the consumer oriented startups, it shouldn’t be too great a problem – consumers are still spending money, but they’ll have to compete with other businesses to get it. Plus of course there’s also more rich consumers now.
Nowadays a lot of people’s wages are automatically linked to inflation. With a high profit share, if there’s a supply shock, wages and costs would both rise, resulting in a fall in profits and business as usual. But with a low profit share, that’s not possible. Businesses would be unable to pay their employees more and may have to pay them less or lay them off.
So, wage share has gone up in Greece since 1995?
Hard to believe.
“A greater profit share doesn’t necessarily mean fewer hands, as a lot of the companies have many shareholders. ”
You’re saying dividends paid to shareholders – some number of whom may be foreigners – are a replacement for lost consumer spending within the economy (given the context of this discussion)? It would seem to me that a greater profit share means exactly that in real terms – a greater share going to capital with a declining share going to labour, whose hands greatly outnumber those of capital. I understand your point about a lot of companies having many shareholders but if you’re saying that a greater profit share does not mean more of the wealth normally available for day to day consumer spending ending up in fewer hands then I must disagree. What percentage of the labour force do you think derives a significant and regularly spent portion of their income from shares to contribute to the running of the economy on a continual basis? A greater share going to profits means exactly that in all practical terms – more of the wealth in less hands.
“Not all business startups are aimed at consumers – some provide services to other businesses and governments, for example.”
Of course.
But for us, consumption makes the economy go round. I would think that in the long run, the level of demand for businesses that provide services to consumer-oriented business will be determined by the level of consumer demand. Would I find that the demand for say, business that operates as a courier service to other business, or does their tax returns or whatever – would I expect to find them thriving in my busted-arse resource home town at present? I don’t see any point in trying to separate consumer-oriented business from those that provide services to them, their fortunes are intrinsically linked. Ask many local businesses in my area and they will tell you that yes, consumers are still spending in a similar fashion to how a man who has just copped a kick in the nuts is still walking……slowly and awkwardly.
These things could easily be offset by our sovereign government – but will they?
“Nowadays a lot of people’s wages are automatically linked to inflation. With a high profit share, if there’s a supply shock, wages and costs would both rise, resulting in a fall in profits and business as usual.”
Can I ask how much experience you have at the grassroots industrial relations front?
Hypothetically, if dear Donald was to start something major in the Middle East and the price of oil skyrocketed, any notion that wages would simply rise to compensate does not square with reality. Employers representatives would hotly contest any such wage claims (and probably any at all) and unions simply don’t have the strength they once had. The cost of any such adjustment would be forced onto labour, further eroding their ability to consume.
It seems to me that the distribution of the profit share is crucial.
If the vast bulk goes to the mining sector or the financial sector
then how does broad based labour get their hands on it even if those
profits decline?
Except through fiscal transfers?
Not worrying for those with the profits- should be, but isn’t. Blinded by the glowing figures on the bank statements, perhaps? Can’t see over the pile of money?