I am late today because I am writing this in London after travelling the last…
Australia records another quarter of record low wages growth
In the last few weeks, three sets of economic data released by the Australian Bureau of Statistics reveal just how bad the Australian economy is performing and exposes the lies that the mainstream media pedals on behalf of the conservative government and the establishment that seeks to defend the disastrous neo-liberal policy regime. Last week (November 17, 2016), I analysed the recent labour market data for October (see Australian labour market – staggering along and in trend deterioration). The ABS said the data represented a Continuing shift to part-time employment . On November 10, 2016, the ABS released its latest – Participation, Job Search and Mobility, Australia, February 2016 – data, which reveals that 1 million Australians were underemployed in February 2016 and on average wanted an additional 13.5 hours of extra work per week. Do the multiplication – an enormous amount of wasted labour. Further, of the 6.4 million Australians not classified as being in the labour force, 954,800 wanted to work and were available to work. Finally, last week (November 16, 2016), the ABS released the latest – Wage Price Index, Australia – for the September-quarter 2016. For the fourth consecutive month, annual growth in wages has recorded its lowest level since the data series began in the December-quarter 1997. Real wages are barely growing and trailing productivity growth. The flat wages trend is intensifying the pre-crisis dynamics, which saw private sector credit rather than real wages drive growth in consumption spending. The lessons have not been learned.
The underemployment problem
The ABS publication released on November 10, 2016 – Participation, Job Search and Mobility, Australia, February 2016 – shows the massive quantity of unused labour in Australia.
And the situation has deteriorated since (given we know that underemployment has continued to rise).
We learn (as at February 2016):
1. Between the September-quarter 2010 and the February-quarter 2016, the labour force grew by 717.9 thousand, employment grew by 541.8 thousand, which means unemployment rose by 177.9 thousand.
2. Over the same period, there was an extra 92.5 thousand workers with a “marginal attachment to the labour force”, but 103.8 thousand extra workers who “Wanted to work but were not actively looking for work and were available to start work within four weeks”.
3. The number of workers who “Wanted to work but were not actively looking for work and were available to start work within four weeks” stood at 954.8 thousand as at February 2016. The ABS estimate this to be equivalent to a loss of potential participation of 2.5 percentage points.
4. There were 1,010.4 thousand workers who were underemployed in February 2016 (that number has risen to 1,011.1 thousand in August 2016). Since the September-quarter 2010, an extra 193.3 thousand workers have entered underemployment. That is more than those who have entered official unemployment.
5. Taken together an extra 371.2 thousand workers have become either unemployed or underemployed between the September-quarter 2010 and the February-quarter 2016.
6. If we sum the categories of workers who are either officially unemployed, underemployed or marginally attached who want to work and are availabe to work then we get 2,752.3 thousand workers who are being wasted in one way or another.
These workers – 2.75 million of them – would be working if there were enough jobs being generated.
If we add the marginal workers back into the official labour force estimate (as at February 2016) and express the idle workers as a percentage then the broad labour underutilisation rate stood at 20.1 per cent.
The next person who says Australia is close to full employment throw something heavy at them.
I also note that the media are increasingly starting to talk about underemployment. I have done a lot of radio interviews recently on that topic.
It is about time. This has been a growing problem for years. And finally people are starting to realise that the political speak – the “post truth” – about how wonderful and resilient Australia’s labour market is, looks rather like a dirty big lie!
The ‘post-truth’ media
Talking about ‘post-truth’ …
The Australian media also distorts the public perception of what is going on.
In this article (November 19, 2016) – How Australia rolls with the economic punches – by the Fairfax economics editor Ross Gittins, which is just a reiteration of the speech by the RBA governor this week.
I discussed that speech and its premises in this blog – Australia’s new central bank governor chooses to dissemble on fiscal issues. The points I made are lost on Gittins who uncritically paraphrases the governor’s claims.
Gittins claims among other things that:
Since we ended the centralised wage-fixing system and moved to collective bargaining at the enterprise level in the first half of the 1990s, we’ve avoided wage inflation, kept real wages rising in line with improvements in productivity (until recently, anyway) and made employers less inclined to respond to downturns with mass layoffs.
Which gives the impression that the wage share has been constant “until recently”. Recently means in anyone’s language in the last few months, quarters or perhaps, to be generous years.
This claim makes it look like the distribution of national income between wages and profits has been stable despite the shift away from the fairer system of centralised wage-fixing.
Well, like a lot of the claims that circulate in this post truth age, where it seems that if you just make something up and say it, it becomes ‘truth’, Gittins claim is untrue.
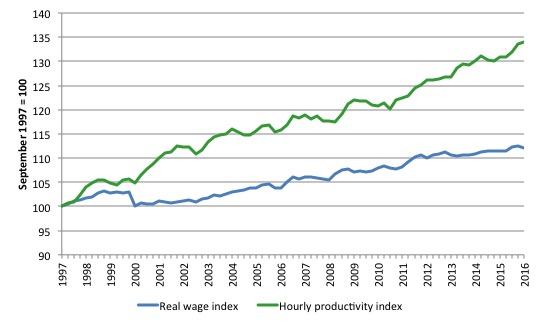
Prefacing later analysis, the following graph shows the total hourly rates of pay in the private sector in real terms (deflated with the CPI) (blue line) from the inception of the Wage Price Index (September-quarter 1997) and the real GDP per hour worked (from the national accounts) (green line) to the September-quarter 2016.
I have extrapolated the productivity data from the June-quarter 2016 using the average growth rate for the last 10 years to smooth out cycles etc.
Over that time, the real hourly wage index has grown by 12.1 per cent, while the hourly productivity index has grown by 34 per cent.
That is not “rising in line”.
If I started the index in the early 1980s, when the gap between the two really started to open up, the productivity index would stand at around 180 and the real wage index at around 115.
Starting the index in the September-quarter 1997 produces a smaller gap, which just goes to show that one can manipulate data to achieve a range of ends (often quite contrasting) by altering the sample size.
This gap represents a massive redistribution of national income to profits and away from wage-earners. For more analysis of why the gap represents a shift in national income shares, please read the blog – Australia – stagnant wages growth continues.
Where does the real income that the workers lose by being unable to gain real wages growth in line with productivity growth go? Answer: Mostly to profits. One might then claim that investment will be stimulated.
At the onset of the GFC (December-quarter 2007), the Investment ratio (percentage of private investment in productive capital to GDP) was 23.8 per cent.
It peaked at 24.3 per cent in the September-quarter 2013. But in recent quarters as the gap between real wages growth and productivity growth widens, the Investment ratio has fallen and in the June-quarter 2016 it stood at 18.8 per cent and is falling.
The downward shift in the non-mining investment ratio is more stark than that.
Some of the redistributed national income has gone into paying the massive and obscene executive salaries that we occasionally get wind of.
Some will be retained by firms and invested in financial markets fuelling the speculative bubbles around the world.
For workers, the problem is that they rely on real wages growth to fund consumption growth and without it they borrow or the economy goes into recession. The former describes what happened around the world in the lead up to the crisis (and caused the crisis).
The latter option describes more or less what is happening now.
One of the essential changes that needs to happen to ensure that another bout of financial instability doesn’t hit soon is that real wages have to start growing in proportion with productivity growth – exactly the reverse of what is happening now.
I will say more about that later.
Nominal wage and price inflation and real wage trends
The ABS media release (November 16, 2016) – Low wage growth continues in September Quarter 2016 – said:
Through the year to September quarter 2016 the WPI rose 1.9 per cent, a new low for the series.
They presented an additional research paper which tried to explain why wages growth had plummetted – see below.
The wage series used in this blog is the quarterly ABS Wage Price Index published by the ABS. The Non-farm labour productivity per hour series is derived from the quarterly National Accounts.
A compact dataset can be downloaded from the RBA Table H2 Labour Costs and Productivity.
Please read my blog – Inflation benign in Australia with plenty of scope for fiscal expansion – for more discussion on the various measures of inflation that the RBA uses – CPI, weighted median and the trimmed mean The latter two aim to strip volatility out of the raw CPI series and give a better measure of underlying inflation.
The deflator used in this blog is the RBA’s ‘core’ or ‘underlying’ inflation measure. The RBA says (Source):
Because of the noise in short-horizon movements in the CPI, policymakers and other analysts often look to measures of underlying or core inflation, which should be subject to less noise than headline inflation …
The most widely used underlying measure is the inflation rate for the CPI basket excluding a few items which historically have had particularly volatile prices. The items typically excluded are various types of food and/or energy, and in some countries the resulting measure is often referred to as ‘core’ inflation. These ‘exclusion’ measures of underlying inflation remove the direct effect of movements in the prices of those items on the rationale that they tend to be volatile and often not reflective of the underlying or persistent inflation pressures in the economy. They are obviously easily calculated and explained to the public.
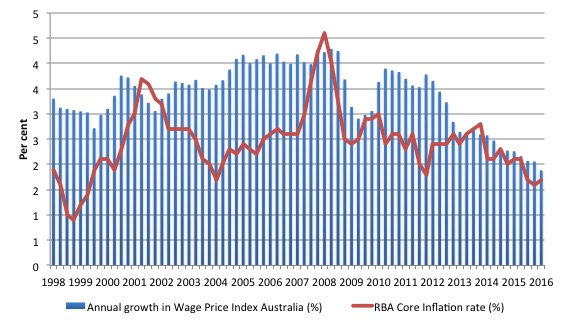
The first graph shows the overall annual growth in the Wage Price Index since the September-quarter 1998 (series was first published in the September-quarter 1997).
I also superimposed the annual core inflation rate (red line). The bars above the red line indicate real wages growth and below the opposite.
We see that the real wage has barely risen since the September-quarter 2012. The real wage has only shown modest growth in the last three quarters because the inflation rate is so low – a reflection of the weakness of the economy.
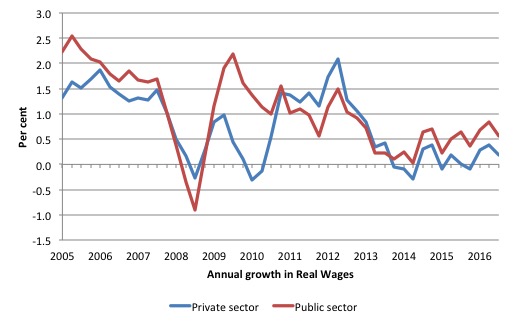
The following graph shows the annual growth in real wages from the September-quarter 1998 to the September-quarter 2016 for the public and private sectors.
After a few quarters of hard real wage cutting in 2013-14, the private sector returned to positive real wages growth but at very subdued rates.
In the last three quarters real wages growth has been fairly modest.
The rise in real wages in 2012 into 2013 was the result of the strong economic growth supported by the fiscal stimulus. The declining profile after that is associated with the end of the mining investment boom exacerbated by the obsessive fiscal restraint that was introduced (too early) and has led to the economy stalling.
The low wages growth raises several questions that are not unique to the Australian setting.
1. With household consumption a major part of aggregate spending, low wages growth threatens a major source of growth. Private investment will also not pick up the pace if consumption spending is weak.
2. The Australian government is mired in a trap of its own making – it still seeks to withdraw a massive $A6 billion in public spending (a significant cut) because in its blinkered eyes the fiscal deficit is too large.
3. Australian households are carrying record levels of debt and their position is made more precarious by the low wages growth.
As cuts spending, growth falters and taxation revenue falls – the Federal government is then just chasing its own tail at the expense of the unemployed who have to wear the costs of this folly.
Suppressing growth also leads to this declining wages growth profile, which further undermines the tax base of the Government.
Round and round it goes – totally unnecessary and very damaging.
Unfortunately, as I demonstrated in the first part of this blog, real wages growth in Australia has not tracked productivity growth in any proportional way as it did in the period before this neo-liberal domination began.
The conservatives like to say that productivity growth is passed on to workers but they know that for the last three decades or so that has not been the case. Moreover, the labour market policies of successive governments on both sides of politics have created a situation where it is increasingly difficult for workers to gain real wages growth in proportion with productivity.
I will say more on that later.
Size and Frequency of Wage Changes
As part of this month’s Wage Price Index release, the ABS provided an additional Feature Article – The Size and Frequency of Wage Changes – prepared by an RBA economist.
It says that:
The decline in wage growth over recent years has been one of the most important developments in the Australian economy. This article explores some of the factors underpinning this decline by analysing the job-level micro data from the Wage Price Index (WPI). In particular, it decomposes aggregate wage growth, as measured by the WPI, into the frequency and size of wage changes.
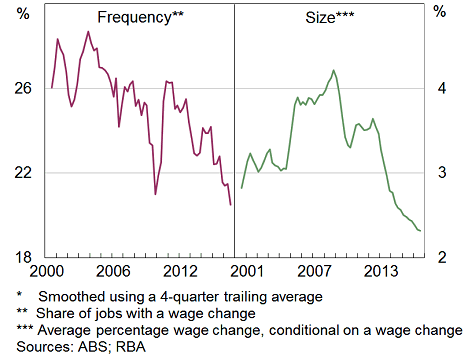
The following graph (taken from Graph 1 of the Feature Article) shows the frequency and size of wage changes since 2000 and shows that “average frequency and the average size of wage changes have both fallen since 2012”.
So at present “21% of all wages being adjusted each quarter, compared with 25% in 2012 … the average length of time between wage changes has risen from once every 4 quarters in 2012 to once every 4¾ quarters in 2016”.
Further, the “average size of wage changes (conditional on a wage change) has fallen from 3.6% in 2012 to 2.3% in 2016 and is now well below its 2000s average.”
When these two factors are combined, they reveal that “the declining size of wage rises has contributed more than two-thirds of the overall fall in wage growth since 2012 … The reduction in the frequency of wage adjustment has contributed the remainder.”
The research also shows that “the share of jobs that experienced wage growth in excess of 4% has fallen sharply since 2012.”
A pretty bleak outlook indeed.
Workers not sharing in productivity growth
The previous analysis shows that even though there has been some modest real wages growth in the last three quarters, it is clear that workers have not been sharing in the productivity growth generated in the Australian economy over the same period.
Productivity growth provides the ‘non-inflationary’ space for real wages to grow and for material standards of living to rise.
But, one of the salient features of the neo-liberal era has been the on-going redistribution of national income to profits away from wages. This feature is present in many nations.
This has occurred because real wages growth has lagged behind productivity growth and the extra real income produced as been expropriated by capital in the form of profits.
The suppression of real wages growth has been a deliberate strategy of business firms, exploiting the entrenched unemployment and rising underemployment over the last two or three decades.
The aspirations of capital have been aided and abetted by a sequence of ‘pro-business’ governments who have introduced harsh industrial relations legislation to reduce the trade unions’ ability to achieve wage gains for their members. The casualisation of the labour market has also contributed to the suppression.
The so-called ‘free trade’ agreements, which are currently in the spotlight, have also contributed to this trend.
That redistribution of national income to profits continues in Australia.
I consider the implications of that dynamic in this blog – The origins of the economic crisis. As you will see, I argue that without fundamental change in the way governments approach wage determination, the world economies will remain prone to crises.
In summary, the substantial redistribution of national income towards capital over the last 30 years has undermined the capacity of households to maintain consumption growth without recourse to debt.
One of the reasons that household debt levels are now at record levels is that real wages have lagged behind productivity growth.
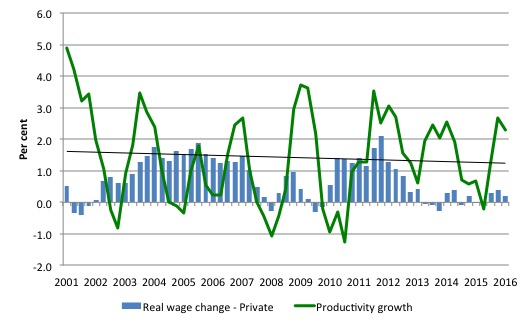
The next graph shows the annual hourly real wage change for the private sector (blue bars) and the annual hourly productivity growth (green line) since the March-quarter 2001. The black line is the trend productivity growth over the same time period.
Productivity growth has strengthened over the last two quarters and over the last 5 years has been well above the growth in real wages.
Historically (for periods which data is available), rising productivity growth was shared out to workers in the form of improvements in real living standards. Higher rates of spending driven by the real wages growth then spawned new activity and jobs, which absorbed the workers lost to the productivity growth elsewhere in the economy.
The neo-liberal period marked a shift in that relationship.
Clearly, since the September-quarter 2011, the payoff to workers from the positive productivity growth has been less than proportional with real wages growth lagging productivity growth.
Real wages growth and employment
The recent labour force data has revealed on-going weak employment growth.
The standard mainstream argument that unemployment is a result of excessive real wages and moderating real wages should drive stronger employment growth.
The problem with this ‘theory’, when applied to the recent Australian experience, is that wages growth has been moderate for several years now while employment growth has been zig-zagging across the zero line over the same period – but generally very weak itself.
The coincidence of both the flat wages growth and the poor employment growth for the last several quarters is supportive of the Modern Monetary Theory (MMT) position – that both are responding to the weak overall spending in the economy.
Firms will not employ new labour, no matter how cheap it becomes, if they cannot sell the extra goods and services that would be produced.
The claim that real wage cuts or growth retardation is necessary to stimulate employment is never borne out by the evidence.
As Keynes and many others have shown – wages have two aspects:
First, they add to unit costs, although by how much is moot, given that there is strong evidence that higher wages motivate higher productivity, which offsets the impact of the wage rises on unit costs.
Second, they add to income and consumption expenditure is directly related to the income that workers receive.
So it is not obvious that higher real wages undermine total spending in the economy. Employment growth is a direct function of spending and cutting real wages will only increase employment if you can argue (and show) that it increases spending and reduces the desire to save.
There is no evidence to suggest that would be the case.
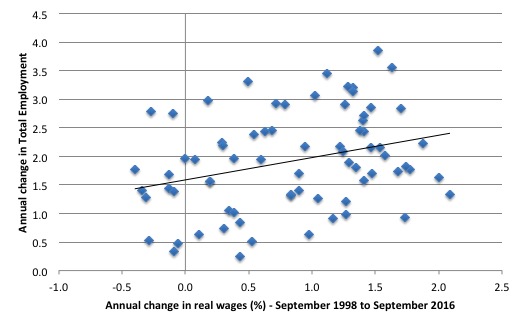
The following graph shows the annual growth in real wages (horizontal axis) and the quarterly change in total employment. The period is from the September-quarter 1998 to the September-quarter 2016. The solid line is a simple linear regression.
Conclusion: When real wages grow faster so does employment although from a two-dimensional graph causality is impossible to determine.
However, there is strong evidence that both employment growth and real wages growth respond positively to total spending growth and increasing economic activity. That evidence supports the positive relationship between real wages growth and employment growth.
International comparison
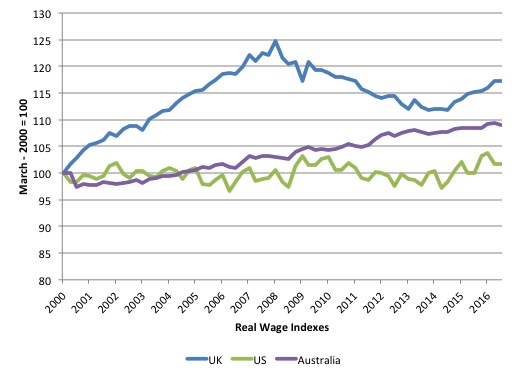
The following graph shows real wage movements since the March-quarter 2000 in the UK, US and Australia to the September-quarter 2016. The measures of wages growth are slightly different due to the different ways that the US Bureau of Statistics and the UK Office of National Assessments classifies and accumulates the data, compared to the ABS in Australia.
But the definitional differences are not so great that the trends in each nation are distorted to much.
It is clear that American workers have experienced very little movement in real wages over the period.
In fact, real wages in the US are only 1.3 per cent higher than they were in the March-quarter 1979. That is a scandalous indictment of the policies that have been pursued in that nation.
The GFC clearly has undermined real wages growth in the UK and flattened real wages growth in Australia.
Conclusion
For the last three-quarters, the ABS has announced that the latest wages growth in Australia has set a new record. The situation continues to deteriorate.
Depending on how we measure inflation, real wages growth is at best modest at present but has zig-zagged across the zero growth line several times in the last few years.
The slow wages growth is a cause and reflection of the slow growth in overall economic activity and employment as well as major shifts in the type of employment that is on offer.
Over the last 12 months, Australia has become a part-time employment nation, with full-time work in retreat. That compositional shift, alone, largely due to weak domestic demand and declining commodity prices, sets the scene for low wages growth.
But then, add in the underemployment and hidden underemployment that I discussed at the outset of this blog. This suggests that around 1/5 or 20.1 per cent of the available and willing workforce is idle in Australia.
That is a massive waste of labour and foregone income. It cannot be explained through worker preference. It is all about a shortage of job creation stifled by excessively restrictive fiscal policy settings.
In turn, workers are adopting a much more cautious approach to spending and firms are demonstrating that they will not lift the investment rate while sales are flagging.
The on-going subdued economic activity will also undermine the Government’s fiscal strategy, which can be summarised as squeezing net public spending out of the economy in the hope that in three years they will achieve a fiscal surplus.
That folly will be exposed. Economic growth will not be strong enough to match their assumptions and that means the growth in tax receipts will be less than assumed.
It would be better for the Government to stimulate the economy more now with larger fiscal deficits and then see the fiscal balance drop on the back of income growth.
Higher (and more reasonable) wages growth would both benefit from and provide support to such a fiscal strategy.
At the moment, we are in a race-to-the-bottom, which is nowhere any reasonable policy strategy should aim for.
And our Government! Silent … trying to work out how it will push a free trade on us when the US President-elect is opposed. But then Mr Trump was going to do a lot of things … we will see.
That is enough for today!
(c) Copyright 2016 Bill Mitchell. All Rights Reserved.
The redistribution of income to profits is only half the story. The other half is that the banking and finance industries are getting the lions share due to people using up large chunks of their incomes on mortgage repayments. Then you have around 10% or more of all wages costs gong into the coffers of the Super Annuation Funds – which also appear to be throwing their hats into the housing market as well – further increasing speculative pricing.
Moving on to the utilities companies which are slowly but surely falling into the hands of only the mega wealthy….
Then in Australia you have the two largest Supermarkets running what can only be described as a two firm dictatorship over the grocery bills of many Australian households. To make matters worse these two big players have also gotten in with the sale of fuel as well to grab even more from everyone’s pay packets.
There is also the insurance companies sticking their hands out for as much as they can grab as well from medical to dental, to car, to house, to income… and so on. And we all need it to because the marketing on the TV and everywhere you look tells us that it’s just not safe anymore and the more protection you have the better.
After all these claims upon our incomes there cannot be too much left. How on earth can small businesses that’s aren’t either directly serving these companies or the ever shrinking government sector ever manage to stay afloat let alone make a profit?
And this is the real problem. Small business who are the majority employer are paying the price for the greed at the top of the tree. Workers are making unrealistic claims on small business, small businesses are cutting costs and underpaying workers to at best break even in many respects.
Meanwhile, those at the top supplying the essentials to households are quietly lobbying government to keep their corporate welfare flowing.
No amount of economic reasoning will ever fix these problems. It’s going to take a revolution of massive proportions.
Bill I never really see you mention two issues that are critical for both employment and the currency/government money issuance
1. Immigration (“skilled” 457, not refugees/humanitarian)
2. Massive private debt used to bid against each other at house auctions
Are you deliberately avoiding these?
Land prices and population growth are two of the biggest problems facing Australians, and critical factors in considering the direction and fairness of the economy
Hi Alan,
I think you have nailed the incredible self-serving behaviour of big corporates. At least for now this is probably paying off handsomely as there is a cohort which is doing fine- the well off and most professionals. The federal government must be considered to be in cahoots with them as just about all they do is beneficial to this “I’m all right Jack” cohort.
Brexit, the rise of Trump and even One Nation here are indicators of disaffection and economic pain. Whether that leads to real change is debatable. At this stage dissatisfaction and anger is directed to foreign workers and racism rather than federal policies.
Bill has regularly provided both the diagnosis and a range of practical measures that would very much improve life for those hurt by neoliberalism but at present I can’t envisage a change of course.