I am travelling today to Tokyo and have little time to write here. But with…
Australia continues to grow but the signs are not all good
Well its officially Spring in Australia and today in Newcastle it is a very warm 23 degrees (warm for this time of year) and it looks like being a long hot (beautiful) summer. The statistics world is looking very bright today as well with the release by the Australian Bureau Statistics of the National Accounts data for the June quarter. The media are today beating up a story about the Goldilocks economy which on first glimpse is a reasonable conclusion. But given that growth has been driven by rising personal consumption and falling saving when household debt remains at dangerous levels, and export growth which is mostly due to terms of trade effects which will not last for much longer and government fiscal stimulus spending which is now being withdrawn something has to happen to private investment soon for the growth to endure. Further, if you take the government contribution out over the last year then things look very sick indeed. The fiscal intervention definitely kept the Australian economy afloat over the last year although that impact is now waning significantly.
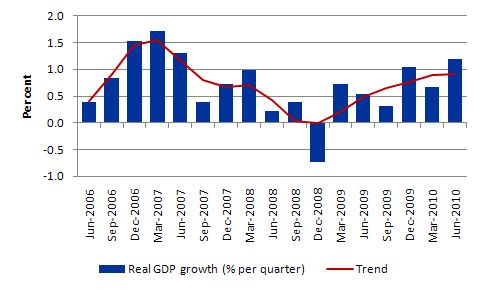
The following graph shows the quarterly percentage growth in real GDP from June 2006 to June 2010 (blue columns) and the ABS trend series (red line) superimposed to bring out the fact that the Australian economy is now experiencing fairly solid growth and the latest quarter will push the trend growth rate up a little.
The Sydney Morning Herald reported today (September 1, 2010) that Australia’s economic growth accelerates.
The Report said:
Australia remains home to one of the world’s best performing economies, with the latest data showing growth is now back to pre-financial crisis levels. The economy grew a seasonally adjusted 1.2 per cent in the June quarter, up from a revised 0.7 per cent pace reported for the January-March period … Economists had expected gross domestic product to register a 0.9 per cent expansion rate for the June quarter.
The quarterly growth rate of 1.2 per cent is the best performance since the June quarter of 2007, just before the crisis started to impact.
But while one bank economists said that the result “highlights just how different the Australian economy is from the rest of the world” he also said “The most encouraging sign is some indications that the private sector is coming back in, a lot of the past 12 months has been a public sector a story and we really need the private sector to sign off on the recovery story.”
There is still a very weak private sector contribution outside of household consumption which was the biggest contributor to the growth in the June quarter.
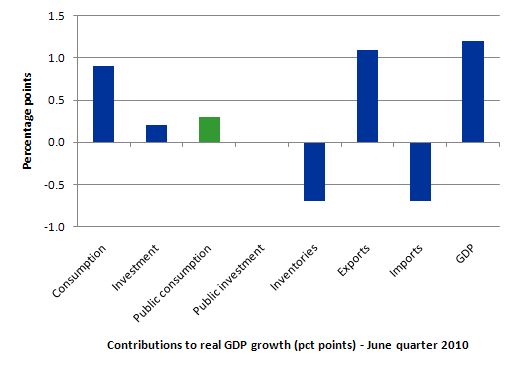
So what is driving this growth? The following graph shows the percentage contributions to real GDP growth in the June 2010 quarter by aggregate spending type.
While GDP growth was 1.2 per cent in the June quarter, private consumption added 0.9 percentage points to that (whereas in the March quarter it added only 0.3 percentage points to overall growth). Retail trade data which was published yesterday suggest there is a strengthening in that area of the economy.
Private investment contributed 0.2 percentage points which was a modest recovery from the negative contribution in the March quarter. There is very little productive capacity being added to the Australian economy at present.
The external sector also was a strong contributor – net exports added adding 0.4 percentage points which was a reversal to the negative contribution in the March quarter.
Yesterday (August 31, 2010) the Australian Bureau of Statistics released the June quarter Balance of Payments data which showed a strong reversal in the overall balance and a positive net exports of goods and services.
The main results in seasonally adjusted terms were:
- The current account deficit, seasonally adjusted, fell $A10,817m (66%) to $A5,640m in the June quarter 2010.
- There was a goods and services surplus of $A6,497m in the June quarter 2010.
- The primary income deficit fell $1,112m (9%) to $A11,909m.
- In real terms, the deficit on goods and services fell $A1,260m (16%) from $A7,694m in the March quarter 2010 to $A6,434m in the June quarter 2010.
- This is expected to contribute 0.4 percentage points to growth in the June quarter 2010 volume measure of GDP.
It is mostly price increases (rising terms of trade – that is, export prices relative to imports) that are driving the trade reversal at present. The Terms of Trade increased by 12.5 per cent in the June quarter and the index rose by 24.5 per cent in the 12 months to June 2010. The gains are mostly in the mining sector (coal and iron ore).
Will this continue? Answer: unlikely. There was a report in the Sydney Morning Herald saying that:
THERE are tentative signs the commodity price boom will soon lose some of its heat, amid pressure on miners to accept lower prices for coal and iron ore in the coming quarter. Negotiations of new quarterly supply contracts for the December quarter are expected to be finalised this week … [and companies] … face lower prices in the final quarter of this year, after recent falls in spot markets.
The clear signal that is emerging from commodity markets is that the terms of trade will remain high but will “detract from the national income later this year”.
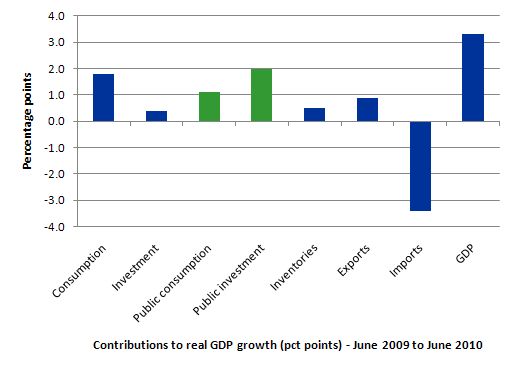
The other thing to note is that the fiscal stimulus which has kept the economy afloat over the last year is now waning. The following graph shows the percentage contributions to real GDP growth over the period from June 2009 to June by aggregate spending type. The contribution of government consumption and investment and the additional multiplier effects on private consumption clearly kept real economic growth going over the 12 months to June 2010.
Contributions by industry
With all the talk of the mining boom, the June quarter data actually supports the view that the fiscal stimulus still kept the economy going in the June quarter. Mining only contributed 0.1 percentage points to June quarter real GDP growth along with a number of other industries such as Wholesale trade, Information media and telecommunications, Financial and insurance services, Professional, scientific and technical services, and Health care and social assistance.
The stand out industry was Construction courtesy of the schools infrastructure program which was a central part of the fiscal stimulus.
Please read my blog – Fiscal stimulus and the construction sector – for more discussion on this point.
Labour market impact
When the most recent labour force data was released I wrote a blog – Labour market – going backwards now – which showed how full-time employment growth was negative in July and net employment growth was being driven by part-time jobs growth.
The latest National Accounts data also sheds some light on what is happening in the labour market albeit indirectly.
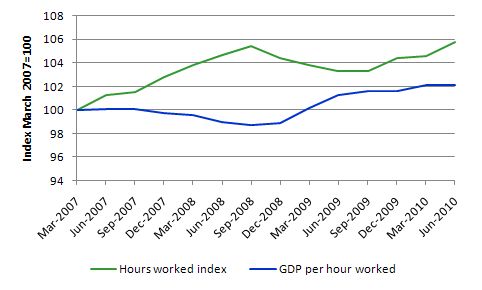
The following graph shows real GDP per hour worked and total hours worked indexes (March 2007 = 100) which provide some insights.
The economic growth is now, finally driving some increased growth in hours worked after some very slow growth in preceding quarters. While the relatively modest growth in hours worked is consistent with the Labour Force data (declining full-time and rising part-time work) it is clearly not enough to allow unemployment to fall, especially when the labour force is growing around 1.8 per cent per annum at present.
The reality is that the rise in unemployment in July was muted because productivity growth is flat. This is also consistent with the lack of private investment in the economy. The economic growth is producing more low-productivity jobs with low wages that is desirable.
In part, this relates to the fact that the export sector is not a large employer and the spill-overs into the non-tradable goods sector of the economy are not as strong as is imagined by the commentators.
Wage share continues to fall
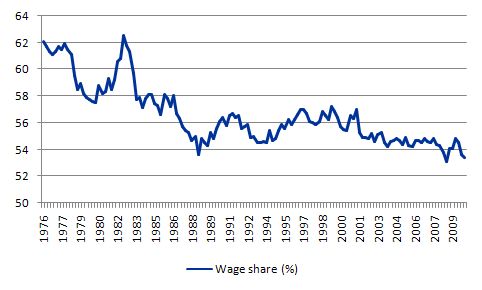
The wage share in factor income is tells us about the direction of real unit labour costs – that is, what each unit of output is costing per real unit of labour input.
The wage share can fall because the real wage is falling as a result of discretionary policies to deregulate the labour market and attack unions. But, equally, it can fall because the economy is booming and productivity growth is strong.
The estimates for the June quarter 2010, show the wage share fell from 53.3 per cent to 52.7 per cent in that quarter along. In the last year, the wage share has fallen by 2.1 percentage points alone.
The following graph shows the evolution of the wage share in national income since March 1974. It shows the continuous redistribution of income from wages to profits which I document as one of the characteristics of the neo-liberal period that led to the current crisis. Please read the blog – The origins of the economic crisis – for more detail on this point.
In historical terms, this redistribution is very large and unprecedented – another atypical behaviour – which the neo-liberals have tried to condition us is just normal. This trend along with the rapid increase in household indebtedness and the obsessive pursuit of budget surpluses are all historically atypical behaviours – which have to be reversed if we are to avoid further crises of the type that has recently crippled the World economy.
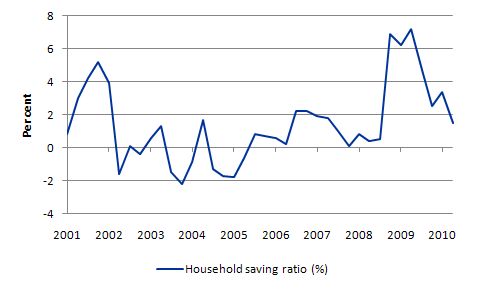
This relates also to the results today that shows that household saving ratio (graphed next) has plunged again. It is clear that the household sector is still carrying very high levels of debt (historically unprecedented) and the recession provoked some attempts to reconstruct the precarious balance sheets.
But that process has not been completed yet but consumption is starting to boom again.
With real wages growth continuing to lag behind productivity growth (and the gap is increasing), I do not believe that the households can continue to absorb the real output that is being produced by the economy under these distributional trends without having to continually increase their debt levels.
Real wages growth has to come back into line with productivity growth to ensure sustainable growth is achieved and this means one thing – there has to be a rather significant shift in the wage share upwards.
The reality is that this can only be accomplished if real wages growth is allowed to track labour productivity growth. That will require a paradigm shift away from labour market deregulation, anti-labour legislation and trade union bashing.
I don’t see that happening any time soon and combined with our failure to take a serious position on financial market reform and our obsession with fiscal austerity – it is clear we are setting our economies up for the next crisis. Conservative ideology triumphing over good economics.
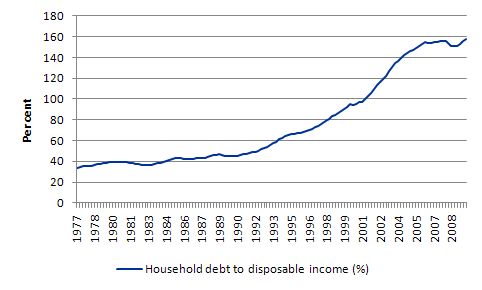
The following graph taken from the Reserve Bank database shows the evolution of the household debt to disposable income ratio since June 1997 to March 2010. You can see that the recession caused households to focus on reducing this ratio but that process seems to have stopped.
At present interest rates are below the level they have been in previous booms and the RBA is expected to raise rates by at least 1 per cent in the coming 12 months. The burden that this will place on these exposed households with housing prices also still to adjust back downwards to more sustainable levels will be heavy.
As I indicated above, the signs are strong that all the components of growth at present will not be enduring and are continuing to play on the imbalanced nature of the aggregate economy – reliance on household consumption and rising indebtedness and a booming terms of trade to promote growth with the public sector aiming to contract.
Conclusion
Australia is now poised to see the return of the conservatives to minority government. I cannot see the three independents upon whom the balance of power and the choice of government now rests will back the current government. The independents are essential rural conservatives who fell out with the national party.
In that case, I expect some harsh fiscal contraction to come in the next 12 months which will put the brakes on economic growth.
For the time being the booming terms of trade and the renewed consumption binge will continue to drive growth and make the Australian economy the envy of the world. But unless private investment really starts to pick up and add to productive capacity and drive production using existing capacity I think the growth will not sustain itself.
The indications are that the terms of trade will come off their current levels by the end of this year and into next year. However, I also note that China manufacturing has recorded strong growth in the current data release which will continue to support our export sector.
But the household sector cannot keep increasing its indebtedness and when the fall comes next time it will be very damaging to those carrying so much debt. It will surely be accompanied by a significant correction in housing prices which was largely avoided this time because the government propped up the sector with the subsidies to first-home buyers.
It is clear that the fiscal stimulus packages were still driving economic growth in the June 2010 quarter. Construction was the single large contributor to GDP growth in the June quarter.
It is clear that the contribution of government over the last 12 months (3.1 percentage points out of a growth rate of 3.3) has been the difference between our economy avoiding the worst of the recession instead of stagnating like most other advanced economies.
The federal government should have promoted that contribution via their bold fiscal interventions much more in the recent election campaign. Instead they raved on about getting back into surplus as soon as possible. It really downplayed the only good thing they have done in their three years of government. Now they look like being only the second first-term government to lose office.
The relatively strong real GDP growth is good news but is not translating into strong jobs growth. Employment growth is still insufficient to absorb the pool of underutilised labour and labour productivity growth is skating along the bottom.
Further, the distributional shifts away from the workers (continued decline in the wage share) and falling saving ratio tells me that the lessons of the last crisis have not been learned. There has been no significant structural change in distributional policy to render the next period of growth more sustainable and not dependent on rising household indebtedness.
That is enough for today!
The sharply falling household savings rate seems very much at odds with so many anecdotes from retailers that consumers have adopted a “save rather than spend” mentality Bill. Food outlets were the only significant gainers from recent consumer spending in the data I saw with department store spending sharply down.
Housing finance and approvals are all down and house prices are moving sideways.
I seldom agree with Terry Mcrann but I will agree with what he said today – this result is a confusing mixed bag.
If household saving is plummeting, where is all the spending going?
April to June 2010. Mortgage applications down 20%. Personal loan and credit card growth remained flat.
How much of this falling household savings rate is going into paying down debt?
If the average Aussie consumer is hokked to the eyeballs (they are), wouldn’t it be kind of logical to see what the household saving ratio chart shows? A sharp spike in saving beginning around the great crash of ’08 and a continual accumulation of savings through ’09 driven by fear and uncertainty. As ’09 draws to a close it becomes apparent to all that Australia has avoided the awful malaise that has caused so much carnage overseas and confidence about job security rises. At this point they are taking notice of the endless repetition in the media that too much debt caused the crisis and Kochie’s face on sunrise every morning telling people to reduce their debt. They now have the confidence to funnel money out of savings and into debt repayment as they no longer fear losing their income.
Look, I have no idea. Just throwing some random thoughts out there. I can’t really see anything to sugest that consumers are on a renewed credit binge. Looks more like the opposite.
If the Coalition and the Indipendents form goverment, good chance they’ll be the third one term wonder.
Off-topic but I think people here are going to want to read this:
http://www.zerohedge.com/article/guest-post-termite-riddled-house-treasury-bonds
The attack on MMT starts about half way into the article.
Good post Lefty.
I wanted the conservatives to win the last election and I’ll be happy if they win this one.
Happy, not because I support them , but happy because I want to watch them totally %$%^ the economy – to the point whereby they are seen by the public, as economically illiterate and not fit to run a chook raffle.
cheers
Bill,
Great idea to do one page containing links to all your posts. I’ve been reading your blog for few months now and it is simply great. You really demystified and clarified a lot of things to me, and your link to Mossler’s pdf book 7 deadly sins was great too. Would you mind writing a post of the role and quantity of private debt in the economy and how it fits to MMT. You cover the government debt quite extensively and convincingly. But for lay people like me, how does the private debt come into play. Is it important, how and why? Since you don’t write much about it, does it mean that it does not matter. Does it matter if the private sector debt is held by its fellow citizens or foreigners etc. I’ve noticed that Keen harps on private debt quite convincingly,
http://www.debtdeflation.com/blogs/2010/08/29/what-bernanke-doesn%E2%80%99t-understand-about-deflation/
so please, please, please a post on private debt.
Many thanks.
You also have an unlikely fan on Youtube http://www.youtube.com/watch?v=iBQF3c_3BZs
http://www.youtube.com/watch?v=rlHUiEcPD6U
maybe it’s time to start your own channel.
Bill,
I take my comment back, you do in fact in this post talk about the household debt, the wage share not keeping up with the productivity, and the debt filling up the purchasing power of the workers.
WHAT A GOVERNMENT CAN DO WITH ITS OWN BANK:
THE REMARKABLE MODEL OF THE COMMONWEALTH BANK OF AUSTRALIA
http://www.webofdebt.com/articles/commonwealth_bank_aus.php
Off-topic and From:
http://www.minneapolisfed.org/publications_papers/pub_display.cfm?id=4526
“The Bryant and Diamond-Dybvig model starts with an environment in which banks can do things that are very worthwhile socially; namely, they provide maturity transformation and liquidity transformation activities that improve the efficiency of the economy. They enable coalitions of people, namely, the banks’ depositors, to make long-term investments-loans, mortgages and the like-while at the same time the bank’s depositors hold demand deposits, bank liabilities that are short term in duration, because they can withdraw them at any time. Banks thereby facilitate risk-sharing among people with uncertain future liquidity needs. These are all good things.”
Where is the bank capital?
From hrvoje’s debtdeflation post,
“Most economists are conditioned to think of commodity markets and asset markets as two separate spheres, but my definition lumps them together: aggregate demand is the sum of expenditure on goods and services, PLUS the net amount of money spent buying assets (shares and property) on the secondary markets. This expenditure is financed by the sum of what we earn from productive activities (largely wages and profits) PLUS the change in our debt levels. So total demand in the economy is the sum of GDP plus the change in debt.”
That sounds correct to me. Is it?
And, “That sucking sound will continue for many years, because the level of debt that was racked up under Bernanke’s watch, and that of his predecessor Alan Greenspan, was truly enormous. In the years from 1987, when Greenspan first rescued the financial system from its own follies, till 2009 when the US hit Peak Debt, the US private sector added $34 trillion in debt. Over the same period, the USA’s nominal GDP grew by a mere $9 trillion.”
Did the rest end up in asset prices and in the trade deficit?
Is/was Steve Keen only wrong about the housing bubble in Australia because of the housing credit and/or the trade deficit with china was not large enough?
Are Australia and Canada actually “colonies” of china right now?
Change in debt vs GDP, is there a velocity factor missing there?
Hi Bill,
You say “but unless private investment really starts to pick up …..I think growth will not sustain itself”. What would it take to
improve the likelihood that “private investment really starts to pick up…….” ?
Thanks,
JB
Fed,
” the US private sector added $34 trillion in debt. Over the same period, the USA’s nominal GDP grew by a mere $9 trillion.”
I think gdp is a “flow” (measured per unit time) and debt is a “stock” (measured at a single point in time). So it is proably not appropriate to compare them as stocks and flows are different animals. The debt here may be financing multi-year assets, while the gdp measures cumulative economic activity only over 1 year… they are different phenomenoms. Think in the physical world velocity (km/hr) vs distance (km).
You wouldnt say (excuse US units if you are non-US): “He couldnt have travelled 1,000 miles because he is only doing 55!”
I think this may be where the phrase “stock-flow consistent” analysis comes from in/around MMT.
Resp,
Matt Franko, thanks. I was wondering about that when I read thru it a second time.
frolix22,
Thanks for the link. The misrepresentation of MMT – that treasury debt doesn’t matter – is amazing. It’s honestly beyond me how someone can apparently read MMT and get this idea, particularly when the real constraints of government spending are continuously emphasised.
I read through most of the comments. It’s going to be interesting to see how things go, particularly after his MMT post in the coming weeks. if the level of discourse can move beyond that first step of understanding accounting, then something interesting might come out of it.