Earlier this week (July 28, 2026), the Governor of the Reserve Bank of Australia presented…
Australia – stronger nominal wages growth but still below the inflation rate – no justification for deliberately increasing unemployment
Last week (November 15, 2023), the Australian Bureau of Statistics released the latest – Wage Price Index, Australia – for the September-quarter 2023, which shows that the aggregate wage index rose by 1.3 per cent over the quarter (up 0.5 points) and 4 per cent over the 12 months (up 0.3 points). The ABS noted this was a “record” increase in relation to the history of this time series, which began in 1997. The RBA and all the economists who want interest rates higher (mostly because the financial market institutions they represent profit from higher rates) are now claiming that the higher wages growth is evidence of a domestic inflation problem and higher unemployment is needed to force wages down. The problem is that the nominal wages growth is still well below the inflation rate (which is falling) and while productivity growth is weak, the decline in real wages is still larger than the decline in productivity growth. That combination, which I explain in detail below, signifies that corporations are failing to invest the massive profits they have been earning and are also taking advantage of the current situation to push up profit mark-ups. A system that then forces tens of thousands of workers out of employment to deal with that problem is void of any decency or rationale.
Latest Australian data
The Wage Price Index:
… measures changes in the price of labour, unaffected by compositional shifts in the labour force, hours worked or employee characteristics
Thus, it is a cleaner measure of wage movements than say average weekly earnings which can be influenced by compositional shifts.
The summary results (seasonally adjusted) for the September-quarter 2023 were:
| Measure | Quarterly (per cent) | Annual (per cent) |
| Private hourly wages | 1.4 (+0.6 points) | 4.1 (+0.5 points) |
| Public hourly wages | 0.9 (+0.2 points) | 3.5 (+0.4 points) |
| Total hourly wages | 1.3 (+0.5 points) | 4.0 (+0.4 points) |
| Employee Selected Cost-of-Living measure | 2.0 (+0.5 points) | 9.0 (-0.6 points) |
| Basic CPI measure | 1.0 (+0.2 points) | 5.3 (-0.7 points) |
| Weighted median inflation | 1.3 (+0.4 points) | 5.2 (-0.3 points) |
| Trimmed mean inflation | 1.3 (+0.3 points) | 5.2 (-0.7 points) |
On price inflation measures, please read my blog post – Inflation benign in Australia with plenty of scope for fiscal expansion (April 22, 2015) – for more discussion on the various measures of inflation that the RBA uses – CPI, weighted median and the trimmed mean. The latter two aim to strip volatility out of the raw CPI series and give a better measure of underlying inflation.
The ABS press release – Quarterly wages growth highest in WPI history – said:
The Wage Price Index (WPI) rose 1.3 per cent in September quarter 2023, and 4.0 per cent for the year … This is the highest quarterly growth in the 26-year history of the WPI …
A combination of factors led to widespread increases in average hourly wages this quarter.
In the private sector, higher growth was mainly driven by the Fair Work Commission’s annual wage review decision, the application of the Aged Care Work Value case, labour market pressure, and CPI rises being factored into wage and salary review decisions. The public sector was affected by the removal of state wage caps and new enterprise agreements coming into effect following the finalisation of various bargaining rounds.
So don’t expect the December-quarter figures to be anywhere near this outcome.
The FWC’s annual decision for minimum wage workers was unusually generous but will quickly disappear from the data.
The RBA has been looking for some justification for its misguided interest rate hikes for some time and has now seized on the wage data as an indicator that there is a ‘domestic’ inflation problem, which transcends the global supply side influences.
The new RBA governor came out firing this week (November 22, 2023) in a speech to business economists in Sydney – A Monetary Policy Fit for the Future.
The audience was full of the special pleaders from the financial sector who have been urging the RBA to push up interest rates for some time because they know their institutions profit from the increases.
The governor moved the dial a little:
If inflation is simply the product of global supply disruptions or other price rises that monetary policy has little influence over then the appropriate response from interest rates would generally be limited. This is especially the case if inflation is driven by just a few items such as fuel, electricity or rents. However, a more substantial monetary policy tightening is the right response to inflation that results from aggregate demand exceeding the economy’s potential to meet that demand.
We heard nothing of this last year when the RBA started hiking rates in the face of ‘global supply disruptions’.
But now, she has found some data that she can hang her hat on – the wage growth data for the September-quarter:
Labour costs have risen, especially when we incorporate the effect of weak productivity growth, and the price of domestic non-labour costs such as energy, business rents and insurance has increased noticeably …
The third signal is the continuation of limited spare capacity, most evident in high rates of labour utilisation.
On the latter point, the most recent labour force data shows that the broad labour underutilisation index stood at 10.1 per cent.
This is the sum of the unemployment rate and the underemployment rate and indicates the willing and able workers who are seeking extra work but due to slack demand cannot find the extra hours.
A wastage rate of 10.1 per cent is not evidence of ‘high rates of labour utilisation’.
And on the first point, what the RBA governor is saying is that because nominal labour costs have risen more than productivity growth, the RBA has to suppress the wages growth by creating more unemployment.
But dealing in nominal terms doesn’t tell the full story.
Economists have a measure – Real Unit Labour Costs (RULC) – which can be derived as the relationship between real wages (the purchasing power of nominal wages) and productivity growth.
In formulaic terms:
RULC = (W/P)/(GDP/L)
where W is the nominal wages, P is the price level, GDP is Output and L is labour hours.
(W/P) is the real purchasing power of the wage, and (GDP/L) is output per unit of labour input or productivity.
So RULC can rise if (W/P) growth is larger than (GDP/L) – that is, the growth in real wages outstrips the growth in productivity.
It can also rise if (GDP/L) growth or labour productivity growth is declining, which has been the case in recent quarters, and the point the RBA has made.
But if the decline in real wages is faster than the decline in labour productivity growth, then RULC will fall and the profit share will rise.
In that case, one cannot make the case that the inflation is a wages problem.
Moreover, declining productivity growth is a sign that business investment is weak or that the economy is languishing below capacity.
And if the growth in RULC comes at a time when labour productivity growth is negative, then it is a sure sign that corporations are using market-power to increase their profit margins.
All these qualifications are ignored by the RBA when they just claim the wages growth is excessive.
Despite the September-quarter delivering significant nominal WPI increases, the fact remains that the real wage continued to fall.
In making this judgement, we have to consider what is the most appropriate cost-of-living measure to deploy.
Inflation and cost of living measures
There is a debate as to which cost-of-living measure is the most appropriate.
The most used measure published by the Australian Bureau of Statistics (ABS) is the quarterly ‘All Groups Consumer Price Index (CPI)’.
Reflecting the need to develop a measure of ‘the price change of goods and services and its effect on living expenses of selected household types’, the ABS began publishing a new series in June 2000 – the Analytical Living Cost Indexes – which became a quarterly publication from the September-quarter 2009.
In its technical paper (published October 27, 2021) – Frequently asked questions (FAQs) about the measurement of housing in the Consumer Price Index (CPI) and Selected Living Cost Indexes (SLCIs) – the ABS note that:
The CPI and SLCIs are closely related. All these indexes measure changes in prices paid by the household sector (consumers) for a basket of goods and services provided by other sectors of the economy (e.g. Government, businesses). The weights in the ‘basket’ represent amounts of expenditure by households on goods and services bought from other sectors. Goods traded between households (like buying and selling existing houses) are excluded as both sides of the transaction occur within the household sector.
I discuss these indexes in detail in this blog post – Australia – real wages continue to decline and wage movements show RBA logic to be a ruse (August 16, 2023).
In effect, the SCLIs represent a more reliable indicator of ‘the extent to which the impact of price change varies across different groups of households in the Australian population’.
There are four separatee SLCIs compiled by the ABS:
- Employee households.
- Age pensioner households.
- Other government transfer recipient households.
- Self-funded retiree households
The most recent data – Selected Living Cost Indexes, Australia – was published by the ABS on November 1 2023.
Between the September-quarter 2022 and the September-quarter 2023, the growth in the respective SLCIs has been:
- Employee households – 9.0 per cent.
- Age pensioner households – 5.7 per cent.
- Other government transfer recipient households – 6.0 per cent.
- Self-funded retiree households – 5.7 per cent.
The ‘All groups CPI’, by contrast, rose 5.4 per cent over the same period (as in above Table).
The following graph shows the differences between the CPI-based measure and the Employee SCLI measure which better reflects the changes in cost-of-living.

Thus, when specific household expenditure patterns are more carefully modelled, the SLCI data reveals that the cost-of-living squeeze on ‘employee households’ is more intense than is depicted by using the generic CPI data.
The ABS considers the ‘Employee households SCLI’ to be its preferred measure designed to capture cost-of-living changes more accurately for ‘households whose principal source of income is from wages and salaries’.
This puts the Treasurer’s comments in a wholly different light.
The relevant cost-of-living measure for workers has risen by 9.0 per cent over the last year while wages growth was just 4.02 per cent – a massive real wage cut of 5 per cent.
Real wage trends in Australia
The summary data in the table above confirm that the plight of wage earners continues in Australia.
The extent of the real wage decline over the last 12 months depends on the cost-of-living measure used (see previous graph for a comparison between the CPI measure and the Employee SCLI measure).
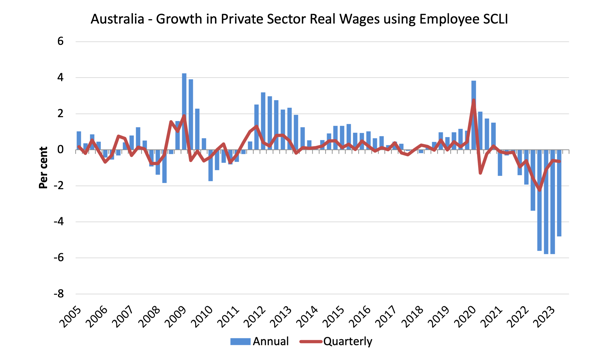
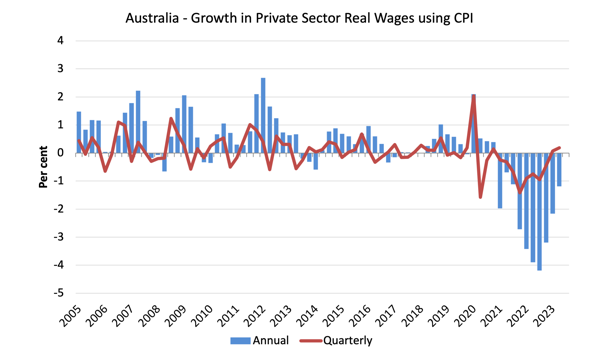
The following graphs use the Employee SCLI measure (first graph) and the CPI (second graph) to show the movement of real wages in the private sector from 2005 to the September-quarter 2023.
In terms of the SCLI measure, there has been a dramatic drop in real wages in the economy over the last 10 quarters.
Workers in the private and public sectors have both experienced sharp declines in the purchasing power of their wages.
This is at the same time as interest rates are have risen more quickly than any time in the distant past.
The fluctuation in mid-2020 is an outlier created by the temporary government decision to offer free child care for the September-quarter which was rescinded in the September-quarter of that year.
Overall, the record since 2013 has been appalling.
Throughout most of the period since 2015, real wages growth has been negative with the exception of some partial catchup in 2018 and 2019.
The systematic real wage cuts indicate that wages are not driving the inflationary episode.
Workers are only able to secure partial offset for the cost-of-living pressures caused by the supply-side, driven inflation.
The second graph shows the real wage calculation using the CPI as the deflator.
The situation for workers is only marginally better given the CPI inflation rate is lower than the SCLI rate.
But still real wages have fallen over the last year.
The great productivity rip-off continues
While the decline in real wages means that the rate of growth in nominal wages being outstripped by the inflation rate, another relationship that is important is the relationship between movements in real wages and productivity.
The RBA is now making a big deal of the fact that wages growth is too high relative to productivity growth.
Historically (up until the 1980s), rising productivity growth was shared out to workers in the form of improvements in real living standards.
In effect, productivity growth provides the ‘space’ for nominal wages to growth without promoting cost-push inflationary pressures.
There is also an equity construct that is important – if real wages are keeping pace with productivity growth then the share of wages in national income remains constant.
Further, higher rates of spending driven by the real wages growth can underpin new activity and jobs, which absorbs the workers lost to the productivity growth elsewhere in the economy.
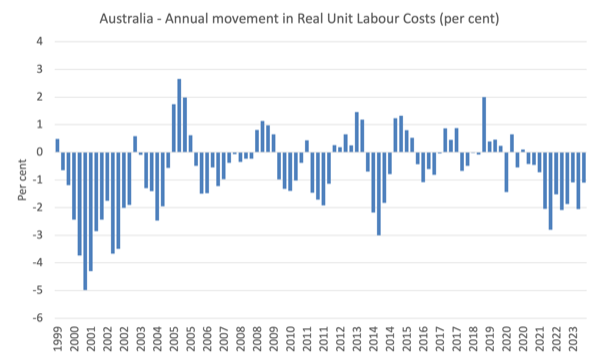
The following graph shows the annual change (per cent) in Real Unit Labour Costs from the December-quarter 1999 to the September-quarter 2023 using the CPI measure to deflate nominal wages.
I used the CPI measure because the RBA claims that is what they focus on rather than the SCLI, which is a measure of the cost of living.
Even though productivity growth has been weak or negative recently, RULCs have continued to fall, because the real wage growth has been weaker than the productivity growth (or in the current period, the fall in real wages has outstripped the fall in productivity growth).
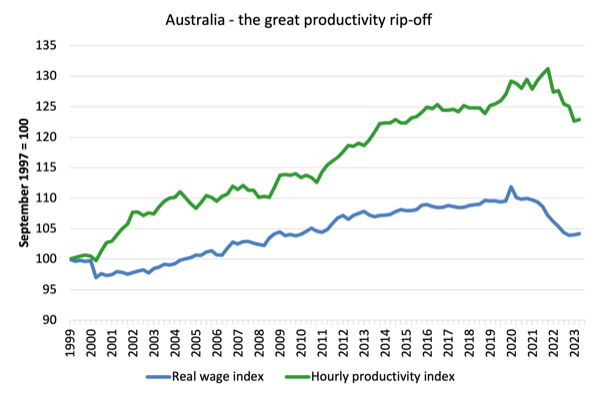
We can see that in the following graph which shows the total hourly rates of pay in the private sector in real terms deflated with the CPI (blue line) and the real GDP per hour worked (from the national accounts) (green line) from the December-quarter 1999 to the September-quarter 2023.
It doesn’t make much difference which deflator is used to adjust the nominal hourly WPI series. Nor does it matter much if we used the national accounts measure of wages.
But, over the time shown, the real hourly wage index has grown by only 4.2 per cent (and falling sharply), while the hourly productivity index has grown by 22.9 per cent.
So not only has real wages growth turned negative over the 18 months or so, but the gap between real wages growth and productivity growth continues to widen.
If I started the index in the early 1980s, when the gap between the two really started to open up, the gap would be much greater. Data discontinuities however prevent a concise graph of this type being provided at this stage.
For more analysis of why the gap represents a shift in national income shares and why it matters, please read the blog post – Australia – stagnant wages growth continues (August 17, 2016).
Where does the real income that the workers lose by being unable to gain real wages growth in line with productivity growth go?
Answer: Mostly to profits.
These blog posts explain all this in more technical terms:
1. Puzzle: Has real wages growth outstripped productivity growth or not? – Part 1 (November 20, 2019).
2. Puzzle: Has real wages growth outstripped productivity growth or not? – Part 2 (November 21, 2019).
Conclusion
In the September-quarter 2023, Australia’s nominal wage growth remained well below that necessary to restore the purchasing power losses arising from cost-of-living increases.
The data shows that the significant cuts to workers’ purchasing power continue, and, in my view, constitute a national emergency.
Further with the gap between productivity growth and the declining real wages increasing, the massive redistribution of national income away from wages to profits continues.
That is enough for today!
(c) Copyright 2023 William Mitchell. All Rights Reserved.
“The significant cuts to workers’ purchasing power continue, and constitute a national emergency.”
Right on Bill. The working class are having their living standard marked down in front of our eyes in rapid time.
One question. the SCLI doesn’t include house prices but does it include rent and mortgage payments?
Like many sheep producers at present I am faced with the reality that surplus sheep (of which there are plenty due to a dry spring) may not have sufficient value to cover cartage to an abattoir.
The lowest sheep prices since the collapse of the Australian wool industry in 1990 combined with an urgency to reduce numbers in line with reduced carrying capacity means the sickening process of shooting and burying unsalable stock on farm is happening or is fast approaching for many people.
I was able to get a buyer from the large international meat company (our only selling option for mutton in South Australia) to inspect the sheep we have shorn ready to sell and offer a price delivered to the meat works, to avoid the risk of receiving a bill for freight.
We obviously expect fluctuations in stock prices, but austerity and unnecessary interest rate rises both here and overseas have impacted heavily on our markets in this instance.
In addition the current price grids set by most meat companies seem particularly ruthless with excessively heavy discounts on lighter carcasses, so that only the heavier animals are likely to cover freight (roughly $10/head from Kangaroo Island).
The buyer defended this as I expected, claiming they have to do it to keep costs down, as slaughter staff are paid per head meaning more profit for the same number processed. I asked why they couldn’t pay per kilogram of carcass weight, to incentivise higher throughput on the lighter animals to the benefit of all parties.
This suggestion was countered by a complaint that 17 workers had not even turned up to work the other day, and how could a company operate with that sort of worker attitude?
Somewhat surprised in my naivety that such a poor relationship would be allowed to develop in a modern workplace I replied that they obviously weren’t being paid enough, only to be told that the workers were well looked after, even having meals supplied!
I’m not sure that free mals at work would cover the impact of increased interest rates on home mortgages and rental accommodation or price gouging on their living costs. I have certainly not heard of low sheep and lamb prices being reflected in retail meat prices.
Nevertheless in a positive tone I suggested that issuing some company shares to the staff might make them more invested in productivity. The response to this sounded like a semi-audible grunt.
The buyer came up with a price on the heavier sheep which will just cover freight and a skin disposal fee. The balance are going to a mainland cropper who will take them for nothing to put on stubbles and hopefully make a worthwhile return from both wool and meat in a few months. He will cart the abattoir sheep for me at cost on the same load, saving us a couple of dollars per head.
There is some irony in the fact that the large meat companies then in existence were able to pay sufficient to divert enough stock away from the Kangaroo Island Export Abattoir to finally ensure its closure in 1998.
That facility was established with the financial support of many sheep producers who hoped its existence would protect them from the very situation we face at present.
I could go on about the impact of privatisation of our ferry service to the mainland, but that is another story!