Today (June 3, 2026), the Australian Bureau of Statistics (ABS) released the latest - Australian…
Australia national accounts – growth continues to be sluggish as material living standards decline
Today (September 6, 2023), the Australian Bureau of Statistics released the latest – Australian National Accounts: National Income, Expenditure and Product, June 2023 – which shows that the Australian economy grew by just 0.4 per cent in the June-quarter 2023 and by 2.1 per cent over the 12 months. If we extend the June result out over the year then GDP will grow by 0.8 per cent, well below the rate required to keep unemployment from rising. GDP per capita fell by 0.3 per cent and Real net national disposable income fell by 1.4 per cent – a measure of how far material living standards declined. Households cut back further on consumption expenditure while at the same time saving less relative to their disposable income in an effort to maintain consumption growth in the face of rising interest rates and temporary inflationary pressures. The result also shows that the RBA’s attempts to engineer a recession are so far failing which tells us about the ineffectiveness of monetary policy.
The main features of the National Accounts release for the June-quarter 2023 were (seasonally adjusted):
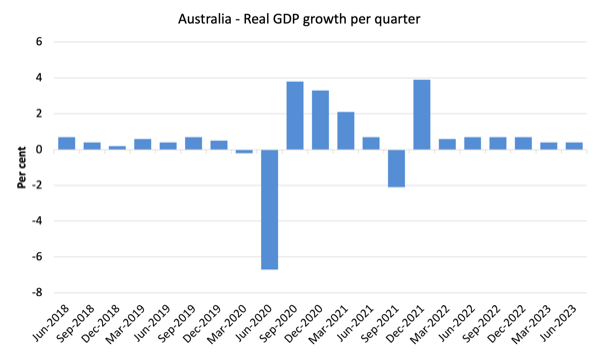
- Real GDP increased by 0.4 per cent for the quarter (down from 0.5 per cent last quarter). The annual growth rate was 2.1 per cent but the annualised June-quarter rate would only be 0.8 per cent
- GDP per capita fell by 0.3 per cent for the quarter, the second consecutive quarter of contraction. Over the year, the measure was down 0.3 per cent – signalling declining average income.
- Australia’s Terms of Trade (seasonally adjusted) fell by 7.9 per cent and by 0.1 per cent over the 12 month period. It was the largest quarterly fall since the June-quarter 2009.
- Real net national disposable income, which is a broader measure of change in national economic well-being, fell by 1.4 per cent for the quarter but still rose by 0.2 per cent over the 12 months, which means that Australians are better off (on average) than they were at that point 12 months ago but worse off than they were in the March-quarter 2023.
- The Household saving ratio (from disposable income) fell to 3.2 per cent from 3.6 per cent. So the squeeze on household wealth is having an effect with continual declines in the ratio. A bad outcome
Overall growth picture – growth continues at much slower rate
The ABS – Media Release – said that:
Australian gross domestic product (GDP) rose 0.4 per cent (seasonally adjusted, chain volume measure) in the June quarter 2023 and by 3.4 per cent over the 2022-23 financial year … GDP per capita fell 0.3 per cent …
Capital investment and exports of services were the main drivers of GDP growth this quarter. …
Household spending remained subdued, rising 0.1 per cent and contributing 0.1 percentage points to GDP growth …
The household saving to income ratio fell for the seventh consecutive quarter to 3.2 per cent, its lowest level since June quarter 2008 …
Net trade in goods contributed 0.5 percentage points to GDP …
The first graph shows the quarterly growth over the last five years.
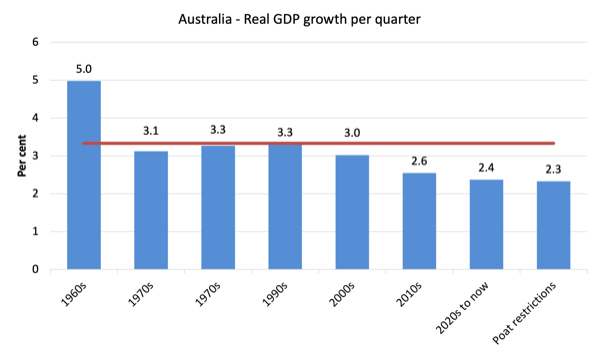
To put this into historical context, the next graph shows the decade average annual real GDP growth rate since the 1960s (the horizontal red line is the average for the entire period (3.26 per cent) from the June-quarter 1960 to the June-quarter 2008).
The 2020-to-now average has been dominated by the pandemic.
But as the graph shows the period after the major health restrictions were lifted has generated lower growth than if we include the period when the restrictions were in place.
It is also obvious how far below historical trends the growth performance of the last 2 decades have been as the fiscal surplus obsession has intensified on both sides of politics.
Even with a massive household credit binge and a once-in-a-hundred-years mining boom that was pushed by stratospheric movements in our terms of trade, our real GDP growth has declined substantially below the long-term performance.
The 1960s was the last decade where government maintained true full employment.
Analysis of Expenditure Components
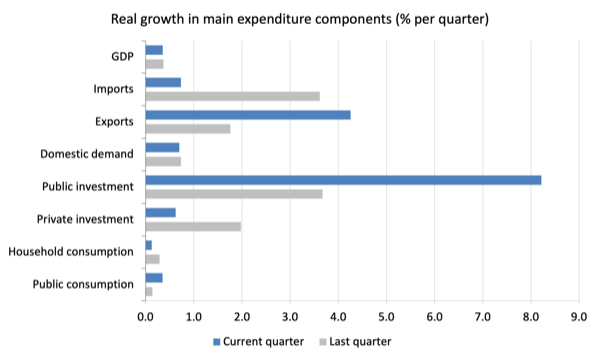
The following graph shows the quarterly percentage growth for the major expenditure components in real terms for December-quarter 2022 (grey bars) and the June-quarter 2023 (blue bars).
Points to note for the June-quarter:
1. Household Consumption expenditure rose by just 0.13 per cent (down from 0.29 per cent) – spending growth has now declined for the last four quarters at the same time that household saving is being rundown to support the current declining growth.
2. General government consumption expenditure rose by 0.35 per cent (up from 0.14 per cent).
3. Private investment expenditure growth rose by 0.62 per cent after riaing by 1.98 per cent in the last quarter.
4. Public investment rose by 8.22 per cent on the back of big state and local government infrastructure projects.
5. Export expenditure rose by 4.26 per cent. Imports growth was 0.73 per cent – a major slowdown).
6. Real GDP rose by just 0.36 per cent (down from 0.37 per cent).
Contributions to growth
What components of expenditure added to and subtracted from the 0.4 per cent rise in real GDP growth in the June-quarter 2023?
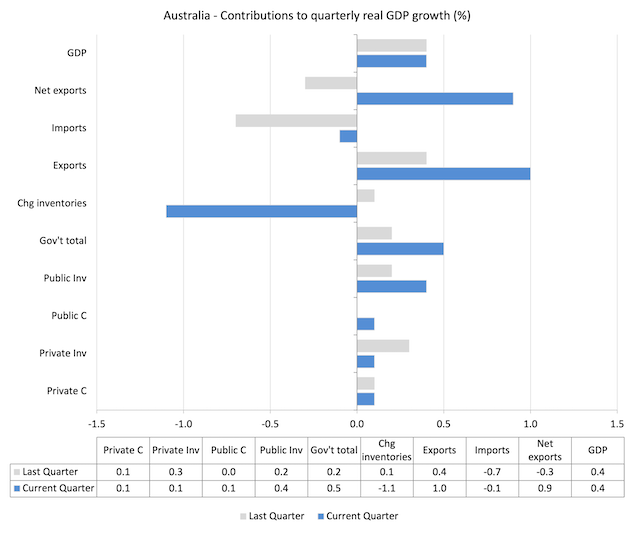
The following bar graph shows the contributions to real GDP growth (in percentage points) for the main expenditure categories. It compares the June-quarter 2023 contributions (blue bars) with the previous quarter (gray bars).
In no order:
1. Household consumption expenditure added 0.1 points to the overall growth rate (steady).
2. Private investment expenditure added 0.1 points (down 0.1 point).
3. Public consumption added 0.1 point this quarter (up from 0.0).
4. Public Investment added 0.4 points this quarter (up from 0.2).
5. Overall, the government sector added 0.5 points to growth (up from 0.2).
6. Growth in inventories subtracted -1.1 points (down from 0.1).
7. Net exports added 0.9 points to growth with exports (+1.0 points) being overridden by rise in imports (-0.1 points) – remember imports are a drain on expenditure.
The decline in inventories was driven by what the ABS said:
Global supply-chain constraints continued to ease over the quarter as domestic inventory behaviour normalised.
A GDP per capita recession?
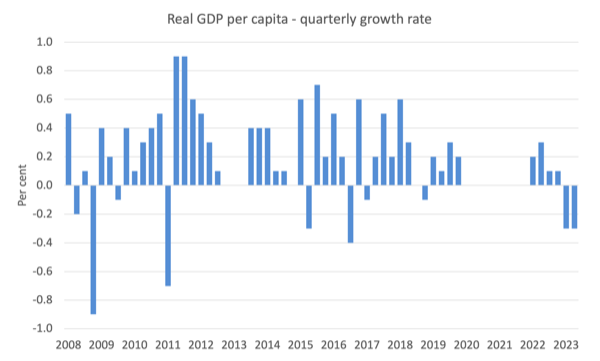
GDP per capita fell for the second consecutive quarter, which means that total output averaged out over the entire population contracted for the 6 months of 2023.
The following graph of real GDP per capita (which omits the 8 quarters between March-quarter 2020 and March-quarter 2022) tells the story.
Material living standards fall in June-quarter
The ABS tell us that:
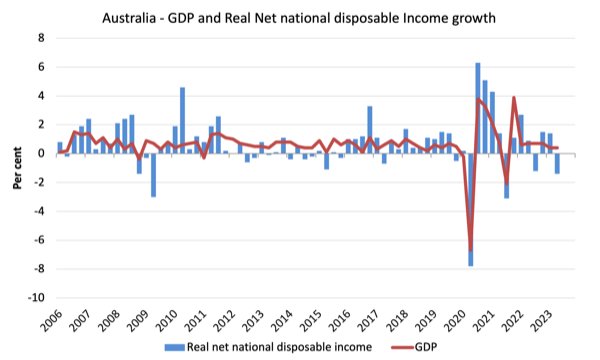
A broader measure of change in national economic well-being is Real net national disposable income. This measure adjusts the volume measure of GDP for the Terms of trade effect, Real net incomes from overseas and Consumption of fixed capital.
While real GDP growth (that is, total output produced in volume terms) rose by 0.4 per cent in the June-quarter, real net national disposable income growth fell by 1.4 per cent.
How do we explain that?
Answer: The terms of trade fell 7.9 per cent in the June -quarter, the largest decline since the June-quarter 2009.
The ABS noted that:
The terms of trade fell 7.9% due to export prices (-8.2%). A warmer northern hemisphere winter resulted in high European inventories of coal and liquefied natural gas, reducing demand and prices for these commodities. Prices for iron ore also fell due to reduced demand from China’s construction and manufacturing industries. Import prices recorded a small fall of 0.3%.
Household saving ratio fell by 0.4 points to 3.2 per cent
The ABS noted that:
The household saving ratio declined from 3.6% to 3.2%, the seventh consecutive fall and the lowest level since June 2008. Savings fell as the rise in nominal household consumption outweighed a softer rise in gross disposable income.
With inflation temporarily at elevated levels and interest rates now being pushed up by the RBA, the squeeze on income is seeing households maintaining (moderating) growth in consumption expenditure by reducing their saving rate.
Digging into savings to maintain the flow of consumption spending undermines household wealth and is a finite process, especially given the record levels of household debt.
The following graph shows the household saving ratio (% of disposable income) from the June-quarter 2000 to the current period. It shows the period leading up to the GFC, where the credit binge was in full swing and the saving ratio was negative to the rise during the GFC and then the most recent rise.
The current position is that households are being squeezed by a combination of rising living costs and interest rates and flat wages growth, which is driving a gap between income and expenditure.
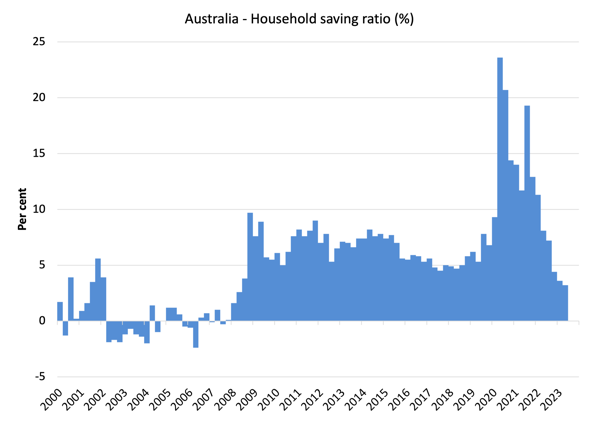
If this trend continues, Australia will go back to the pre-GFC period when the household saving ratio was negative and consumption growth was sustained by increasing debt.
However, with household debt so high, it is likely that households will cut back consumption spending and the economy will head towards recession.
It will be a deliberate act of sabotage engineered by the RBA.
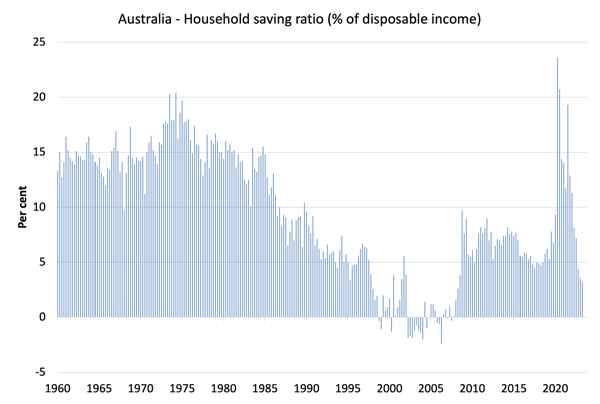
The next graph shows the household saving ratio (% of disposable income) from the June-quarter 1960 to the current period.
Back in the full employment days, when governments supported the economy and jobs with continuous fiscal deficits (mostly), households saved significant proportions of their income.
In the neoliberal period, as credit has been rammed down their throats, the saving rate dropped (to negative levels in the lead-up to the GFC).
Hopefully, households are paying off the record levels of debt they are now carrying and improving their financial viability.
The following table shows the impact of the neoliberal era on household saving. These patterns are replicated around the world and expose our economies to the threat of financial crises much more than in pre-neoliberal decades.
The result for the current decade (2020-) is the average from June 2020.
| Decade | Average Household Saving Ratio (% of disposable income) |
| 1960s | 14.4 |
| 1970s | 16.2 |
| 1980s | 11.9 |
| 1990s | 5.0 |
| 2000s | 1.4 |
| 2010s | 6.5 |
| 2020s on | 6.5 |
| Since RBA hikes | 5.3 |
Real GDP growth rose but GDP per hour worked falls
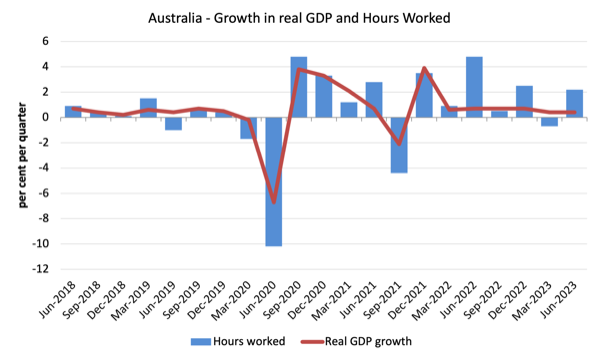
Real GDP rose 0.4 points in the quarter, while working hours rose 2.2 per cent.
Which means that GDP per hour worked declined – a fall in labour productivity.
The following graph presents quarterly growth rates in real GDP and hours worked using the National Accounts data for the last five years to the June-quarter 2023.
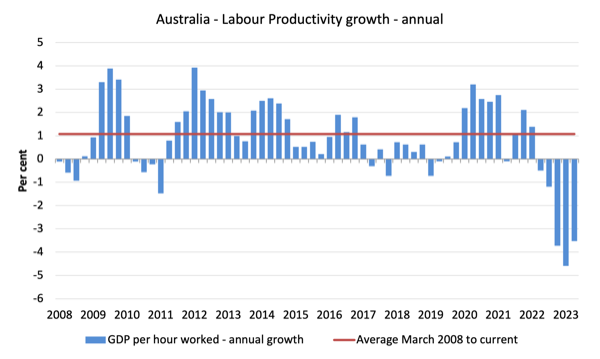
To see the above graph from a different perspective, the next graph shows the annual growth in GDP per hour worked (labour productivity) from the June-quarter 2008 quarter to the June-quarter 2023.
The horizontal red line is the average annual growth since June-quarter 2008 (1.1 per cent), which itself is an understated measure of the long-term trend growth of around 1.5 per cent per annum.
The relatively strong growth in labour productivity in 2012 and the mostly above average growth in 2013 and 2014 helps explain why employment growth was lagging given the real GDP growth. Growth in labour productivity means that for each output level less labour is required.
GDP per hours worked has now fallen for the last five quarters – a poor outcome.
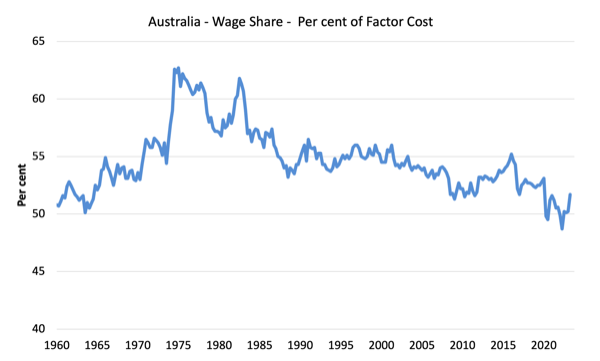
The distribution of national income – wage share rises
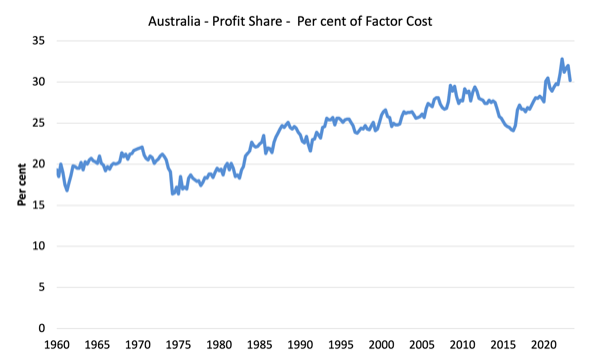
The wage share in national income rose slightly to 51.7 per cent while the profit share fell to 30.2 per cent as labour compensation rose and the terms of trade fell sharply which affects corporate profits.
But as the following graphs show, this shift is minor in the face of the recent trends.
The first graph shows the wage share in national income while the second shows the profit share.
The declining share of wages historically is a product of neoliberalism and will ultimately have to be reversed if Australia is to enjoy sustainable rises in standards of living without record levels of household debt being relied on for consumption growth.
Conclusion
Remember that the National Accounts data is three months old – a rear-vision view – of what has passed and to use it to predict future trends is not straightforward.
The data tells us that after the initial rebound from the lockdowns, growth has now stalled at well below the trend rate.
Households are now saving less relative to their disposable income in an effort to maintain consumption growth in the face of rising interest rates and temporary inflationary pressures.
I expect growth to decline further and we will be left with rising unemployment and declining household wealth as a result of the RBA’s poor judgement.
That is enough for today!
(c) Copyright 2023 William Mitchell. All Rights Reserved.
I don’t think the RBA got it wrong. Their objective was to transfer money from ordinary people to the wealthiest.
Reducing the gap between rich and poor would have been getting it wrong for the RBA board.