Today (June 3, 2026), the Australian Bureau of Statistics (ABS) released the latest - Australian…
US national accounts data – no sign that interest rates are working the way economists think they work
On October 26, 2023, the US Bureau of Economic Analysis published the latest US National Accounts figures – Gross Domestic Product, Third Quarter 2023 (Advance Estimate) – which showed that “Real gross domestic product (GDP) increased at an annual rate of 4.9 percent in the third quarter of 2023”. The June-quarter 2023 growth rate was 2.1 per cent. There was broad-based growth in all the expenditure components, including those that would be most sensitive to interest rate rises. My prior, of course, is that the interest rates would not significantly reduce growth in the short run, whereas mainstream New Keynesian theory considers interest rate rises to be an effective tool in moderating total spending, and, in turn, reducing inflation. The reality does not support the mainstream proposition. Consecutive national accounts releases from the US, however, have shown that aggregate expenditure is resilient in the face of the interest rate increases.
The ineffectiveness of monetary policy – US economy
The US Bureau of Economic Analysis said that:
The increase in real GDP reflected increases in consumer spending, private inventory investment, exports, state and local government spending, federal government spending, and residential fixed investment that were partly offset by a decrease in nonresidential fixed investment … Imports, which are a subtraction in the calculation of GDP, increased.
So across the board growth in spending in the US.
And the “increase in consumer spending reflected increases in both services and goods”, so again broad-based.
And:
Compared to the second quarter, the acceleration in real GDP in the third quarter reflected accelerations in consumer spending, private inventory investment, and federal government spending and upturns in exports and residential fixed investment.
The question one might reasonably ask then in an environment of relentless monetary policy efforts to curb spending is why we believe that monetary policy is the most effective macroeconomic policy tool – which is the dominant view among the mainstream New Keynesians.
If the US government had have tightened fiscal policy significantly over the last 12 months, we would not have been observing real GDP growth rates that are now apparent.
Further, note that the BEA is using the annualised quarterly figure here (multiplying the September-quarter growth of 1.2 per cent by 4) rather than the actual annual (year-on-year) growth rate which is the percentage shift from the September-quarter 2022 to the September-quarter 2023.
That aggregate was 2.93 per cent up from 2.38 per cent in the June-quarter 2023.
The following sequence of graphs captures the story.
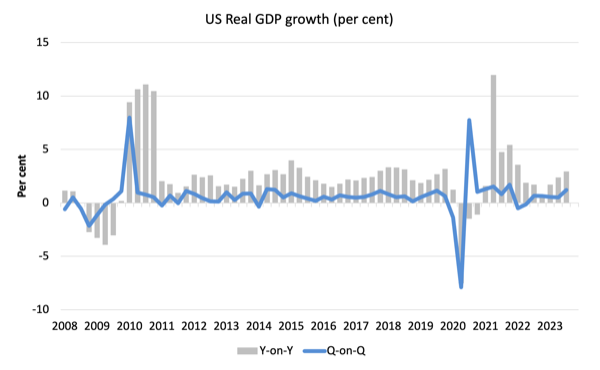
The first graph shows the annual real GDP growth rate (year-to-year) from the peak of the last cycle (December-quarter 2007) to the March-quarter 2020 (grey bars) and the quarterly growth rate (blue line). Note the date line starts at March-quarter 2008.
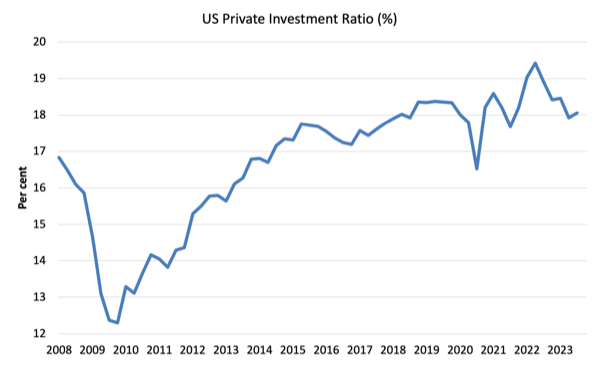
The next graph shows the evolution of the Private Investment to GDP ratio from the March-quarter 2008 (real GDP peak prior to GFC downturn) to the September_quarter 2023.
Business investment is one of the national accounting aggregates that mainstream economists believe would be highly sensitive to interest rate movements.
The data doesn’t suggest that.
The chaos caused by the pandemic is evident as is the stalling performance after the initial GFC recovery.
In recent quarters, the ratio has fallen because growth in investment spending has been below the growth in real GDP. That situation was reversed in the September-quarter 2023.
The investment rate is now around the pre-pandemic value and it is not showing anything like a dramatic ‘fall of the cliff’ dynamic.
The question is why is broad-based spending growing resisting the interest rate hikes?
Several factors appear to be operating.
First, the recent growth in real wages has provided a boost to consumer spending.
Second, there is a wealth effect operating, after households enjoyed significant growth in their net worth over the period of the pandemic, mainly because of house price inflation and the sharemarket boom.
Remember, we are talking macroeconomic aggregates here and we acknowledge that the gains in wealth are highly concentrated among a small group of already wealthy Americans, while many at the bottom of the income and wealth distributions are enduring considerable pain as a result of the interest rate rises.
The problem with trying to assess the impact of interest rates is the one that bedevils a lot of macroeconomic analyis – the so-called – observational equivalence – problem.
This refers to the situation (in our context) where two:
… theories are observationally equivalent if all of their empirically testable predictions are identical, in which case empirical evidence cannot be used to distinguish which is closer to being correct; indeed, it may be that they are actually two different perspectives on one underlying theory.
So:
1. Mainstream theory said that increasing interest rates would drive down inflation.
2. My framework said that inflation would be falling relatively quickly because it was being driven by supply-side factors associated with the pandemic and then the Ukraine and OPEC situations and that the interest rate increases were not necessary.
The empirical reality is that inflation has fallen fairly quickly at the same time as interest rates have increased.
The data cannot establish the causality.
Except, that under proposition one we should have also witnessed a significant slowdown in aggregate spending, given that the mainstream framework attributed the inflationary pressures to demand-side factors (too much spending relative to supply) and that interest rate hikes were considered to reduce that spending.
That last fact supports the validity of Proposition 2.
There is commentary that US expenditure growth is about to slow due to various factors (reversal of the wealth effect above, student loan repayment timing, etc) but that will not salvage proposition 1.
Contributions to growth
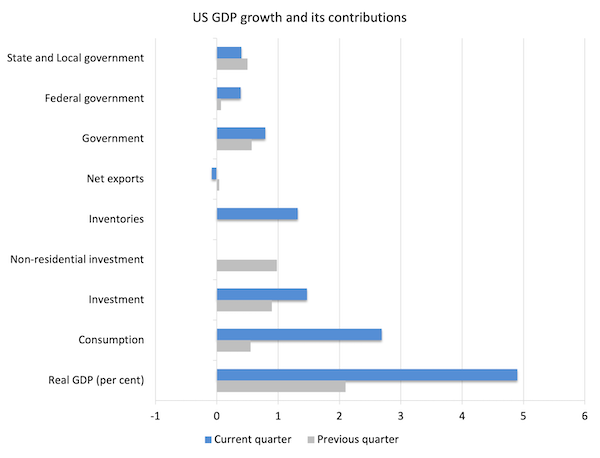
The next graph compares the June-quarter 2022 (grey bars) contributions to real GDP growth at the level of the broad spending aggregates with the September_quarter 2023 (blue bars).
All the major expenditure components bar net exports contributed to the strong GDP growth in the September-quarter 2023.
All the interest-rate sensitive components – consumer and investment spending – were strong.
Government spending, federal in particular, is also driving growth.
Net exports was a negative contributor but only because the strong domestic growth stimulated import growth that was faster than the growth in exports.
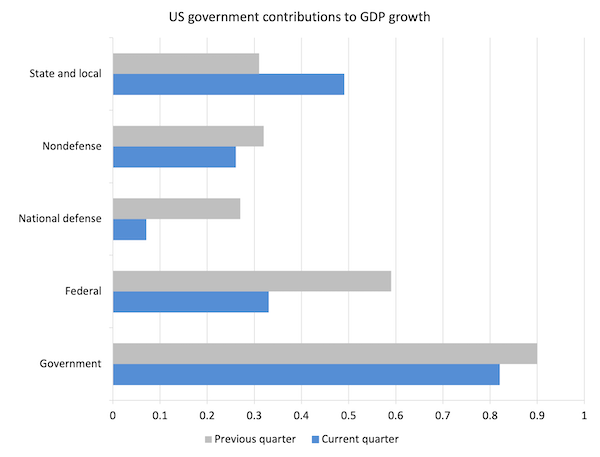
The next graph decomposes the government sector and shows there was strong growth contributions from all levels of government.
I expect national defense spending to rise significantly as the US government aids Israel in the slaughter of innocent people in Gaza.
To better understand what is happening with investment expenditure, the next graph breaks down the contributions to real GDP growth of the various components of investment.
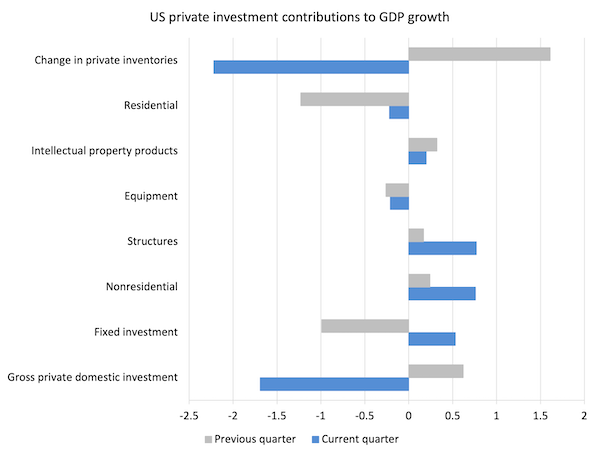
I cannot see any substantial negative interest rate effect in this data.
US Household consumption and debt
The Federal Reserve Bank of New York publication – Household Debt and Credit Report – was last updated for the June-quarter 2023 (published August 2023) – (PDF Download).
It shows:
Total household debt rose by $16 billion to reach $17.06 trillion in the second quarter of 2023 … Credit card balances saw brisk growth, rising by $45 billion to a series high of $1.03 trillion. Other balances, which include retail credit cards and other consumer loans, and auto loans increased by $15 billion and $20 billion, respectively. Student loan balances fell by $35 billion to reach $1.57 trillion, while mortgage balances were largely unchanged at $12.01 trillion.
There doesn’t appear to be a massive hit on consumer borrowing.
The data also shows that:
Aggregate delinquency rates were roughly flat in the second quarter of 2023 and remained low, after declining sharply through the beginning of the pandemic.
Once again no sign of a meltdown.
Conclusion
The Federal Reserve officials are no doubt congratulating themselves given that inflation is now around 3.7 per cent per annum, whereas in June 2022 it had peaked at 9.1 per cent.
They will be saying ‘job well done’ and we avoided a recession and achieved the so-called ‘soft landing’.
The media reports that the Federal Reserve economists are ‘surprised’ by the robust expenditure growth that the national accounts data is revealing.
Surprise reflects ignorance rather than any event that an expert with a reasonable understanding would have expected.
The housing market has slowed somewhat given the higher mortgage rates but nothing resembling a major slowdown in the US economy is evident.
And that is no surprise.
Why?
Because monetary policy is a very weak tool if the objective is to reduce aggregate expenditure.
Which tells me that mainstream macroeconomics is betting on the wrong horse.
That is enough for today!
(c) Copyright 2023 William Mitchell. All Rights Reserved.
In a world threatened by a looming war of hegemonic power between the US and his vassals on one side and China and his vassals on the other, it must be terribly amusing to watch the other side commiting suicide, searching for some dead man fantasies.
It’s called decadence and we signs of it everywhere.
Control of money supply is an ineffective substitute for control of energy supply.
If governments really wanted Central Banks (or anyone else) to control economic activity then they would give that institution control of energy supply (either through price controls or through direct control of the energy supply). Think of America’s Strategic Petroleum Reserve (which can buy and sell oil), but on a much, much larger scale (and including all energy sources, not just oil).
The state could easily control *all* economic activity by controlling the supply of energy.