In the 1990s, a new industry was created in Australia. It produced nothing. But it…
Australian labour market – steady in March
The Australian Bureau of Statistics released the latest labour force data today (March 17, 2022) – Labour Force, Australia – for March 2022. The labour market steadied after the huge rebound last month as the Covid restrictions were substantially dismantled. Employment growth was modest. There are still 1.43 million Australian workers without work in one way or another (officially unemployed or underemployed). We are seeing the impact of flat population growth coming up against growing demand for workers and that is the reason the unemployment rate has fallen so quickly. The underlying (‘What-if’) unemployment rate is closer to 6.4 per cent rather than the official rate of 4 per cent.
The summary ABS Labour Force (seasonally adjusted) estimates for March 2022 are:
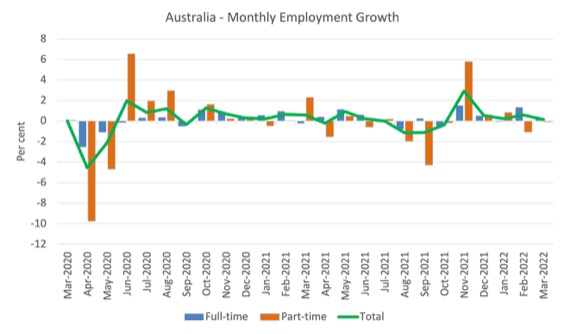
- Employment increased by 17,900 (0.1 per cent) – Full-time employment increased by 20,500 and part-time employment fell by 2,700.
- Unemployment fell by 12,100 to 551,300 persons.
- The official unemployment rate remained steady at 4 per cent.
- The participation rate was steady at 66.4 per cent.
- The employment-population ratio was steady at 63.8 per cent.
- Aggregate monthly hours worked fell 10 million hours (0.6 per cent).
- Underemployment decreased by 0.3 points to 6.3 per cent (a fall of 12.4 thousand). Overall there are 882.3 thousand underemployed workers. The total labour underutilisation rate (unemployment plus underemployment) fell by 0.3 points to 10.3 per cent. There were a total of 1433.5 thousand workers either unemployed or underemployed.
In its – Media Release – the ABS note that:
With employment increasing by 18,000 people and unemployment falling by 12,000, the unemployment rate decreased slightly in March, though remained at 4.0 per cent in rounded terms …
Employment increased for the fifth month in a row, by around 18,000 people (0.1 per cent) in March. It was around 220,000 people (1.7 per cent) higher than the pre-Delta period high of June 2021 …
With floods in New South Wales and Queensland, a higher than usual number of people reported working reduced hours due to bad weather in March. This was in addition to the high number of people away from work due to illness, reflecting further disruption from the Omicron variant,
After last month’s large rebound after the Covid restrictions were eased, things stabilised in March.
Employment increased by 17,900 in March 2022
1. Employment growth was very muted (after the big rebound in February) – to 0.1 per cent.
2. Full-time employment increased by 20,500 and part-time employment fell by 2,700.
3. Employment in Australia is 394.5 thousand (net) jobs (3 per cent) above the pre-pandemic level in February 2020.
The following graph shows the month by month growth in full-time (blue columns), part-time (grey columns) and total employment (green line) for the 24 months to March 2022 using seasonally adjusted data.
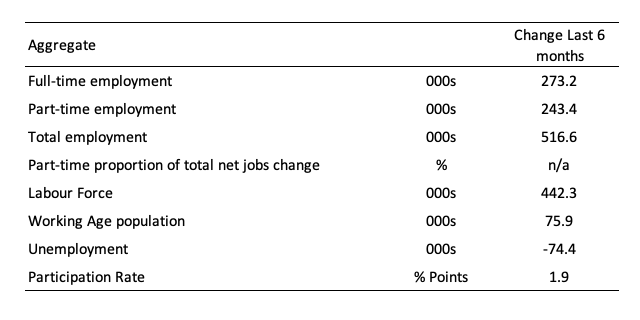
The following table provides an accounting summary of the labour market performance over the last six months to provide a longer perspective that cuts through the monthly variability and provides a better assessment of the trends.
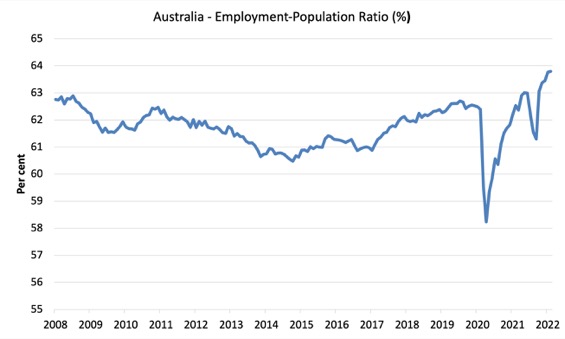
Given the variation in the labour force estimates, it is sometimes useful to examine the Employment-to-Population ratio (%) because the underlying population estimates (denominator) are less cyclical and subject to variation than the labour force estimates. This is an alternative measure of the robustness of activity to the unemployment rate, which is sensitive to those labour force swings.
The following graph shows the Employment-to-Population ratio, since March 2008 (the low-point unemployment rate of the last cycle).
It fell with the onset of the GFC, recovered under the boost provided by the fiscal stimulus packages but then went backwards again as the Federal government imposed fiscal austerity in a hare-brained attempt at achieving a fiscal surplus in 2012.
There are two forces working here – the denominator (population) is clearly providing favourable pressures due to the slower population growth as a result of the lack of immigration arising from the external border closures.
This is forcing employers to search harder for workers already in Australia rather than discriminate against the unemployed.
The numerator (employment) is clearly stronger as the restrictions ease.
The ratio was steady in March 2022.
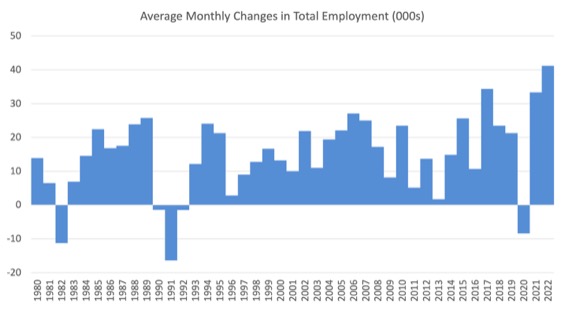
To put the current monthly performance into perspective, the following graph shows the average monthly employment change for the calendar years from 1980 to 2022 (to date).
1. The labour market weakened considerably over 2018 and that situation worsened in 2019.
2. The average employment change over 2020 was -8.4 thousand which rose to 33.3 thousand in 2021 as the lockdowns eased.
3. So far in 2022, the average monthly change is 41.2 thousand but that will drop significantly as the year unfolds.
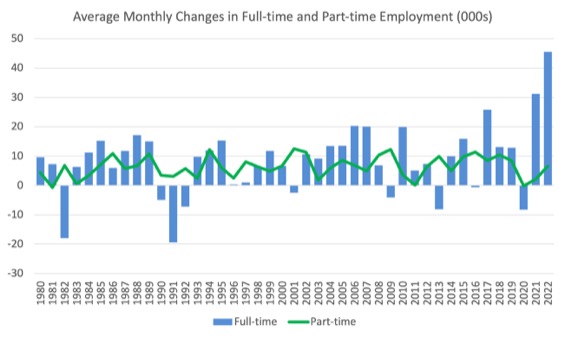
The following graph shows the average monthly changes in Full-time and Part-time employment (lower panel) in thousands since 1980.
The interesting result is that during recessions or slow-downs, it is full-time employment that takes the bulk of the adjustment. Even when full-time employment growth is negative, part-time employment usually continues to grow.
However, this crisis is different because much of the employment losses have been the result of lockdown and enforced business closures in sectors where part-time employment dominates.
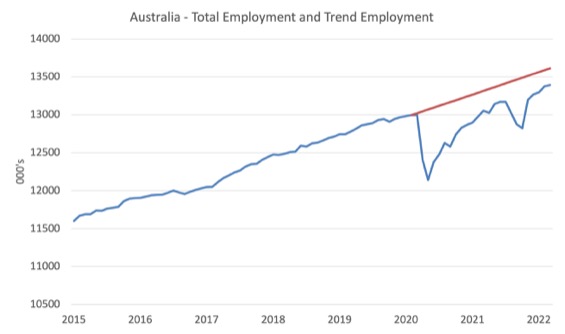
Actual and Trend Employment
The Australian labour market is now larger than it was in March 2020. But it is still a long way from where it would have been if it had have continued to expand at the previous trend.
The following graph shows total employment (blue line) and what employment would have been if it had continued to grow according to the average growth rate between 2015 and March 2020.
In March 2022, the gap increased by 7.4 thousand to 223.5 thousand jobs as a result of the slow employment growth.
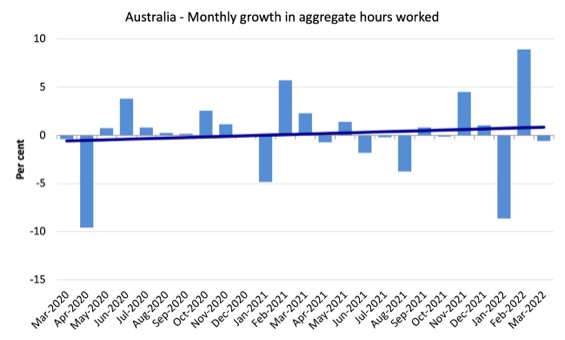
Hours worked fell by 10.2 million hours (-0.56 per cent) in March 2022
The decline was due to the floods in Queensland and NSW and more workers unable to work as a result of Covid sickness.
The following graph shows the monthly growth (in per cent) over the last 24 months.
The dark linear line is a simple regression trend of the monthly change (skewed by the February result).
The Population Slowdown – the ‘What-if’ unemployment analysis
The following graph shows Australia’s working age population (Over 15 year olds) from January 2015 to March 2022. The dotted line is the projected growth had the pre-pandemic trend continued.
The difference between the lines is the decline in the working age population due to the Covid restrictions.
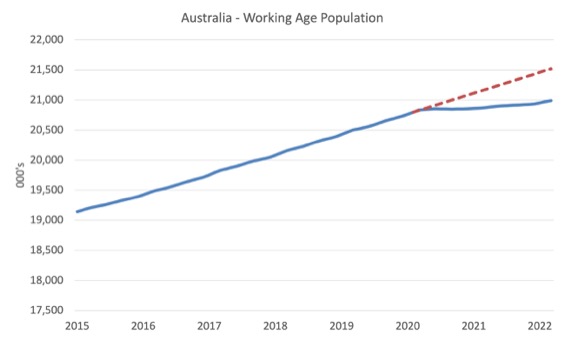
With the external border only just starting to open, net immigration is still very low.
This flattening out has forced employers to work harder to get workers and is one of the reasons unemployment has fallen quickly, given the circumstances.
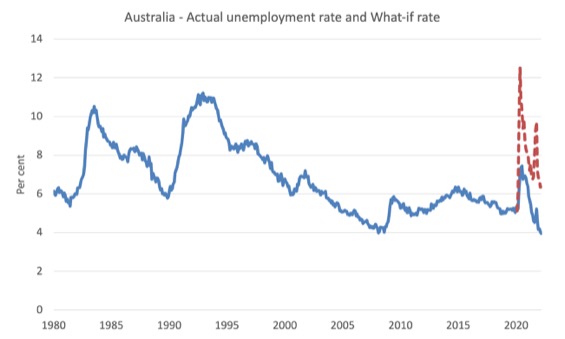
The following graph shows the evolution of the actual unemployment rate since January 1980 to March 2022 and the dotted line is the ‘What-if’ rate, which is calculated by assuming the most recent peak participation rate (recorded at March 2022 = 66.4 per cent), the extrapolated working age population (based on growth rate between 2015 and March 2020) and the actual employment since March 2020.
It shows what the unemployment rate would have been given the actual employment growth had the working age population trajectory followed the past trends.
In this blog post – External border closures in Australia reduced the unemployment rate by around 2.7 points (March 28, 2022), I provided detailed analysis of how I calculated the ‘What-if’ unemployment rate.
So instead of an unemployment rate of 4 per cent, the rate would have been 6.4 per cent in March 2022, given the employment performance since the pandemic.
This finding puts a rather different slant to what has been happening since the onset of the pandemic.
State and Territory Employment Trends
After lockdowns were lifted, the major floods on the East Coast and a growing wave of the new Omicron variant have combined to mute the labour market rebound.
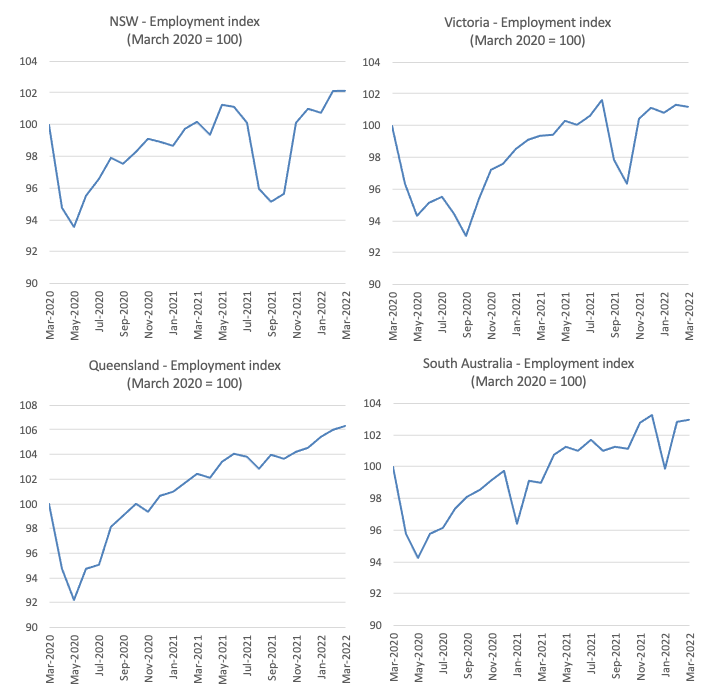
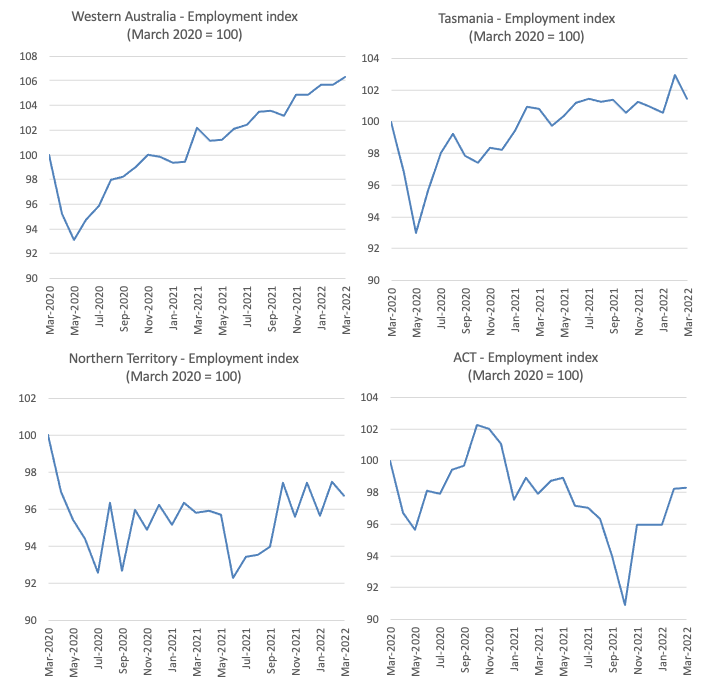
The following graphs show the employment evolution since March 2020 by state and territory.
NSW (102.1) and Victoria (101.2) are back to their March 2020 employment levels (index of 100).
Queensland (106), South Australia (102.9), Western Australia (106.3), Tasmania (101.4) are also above the pre-pandemic level.
But the territories – ACT (98.3) and NT (96.7) – are below.
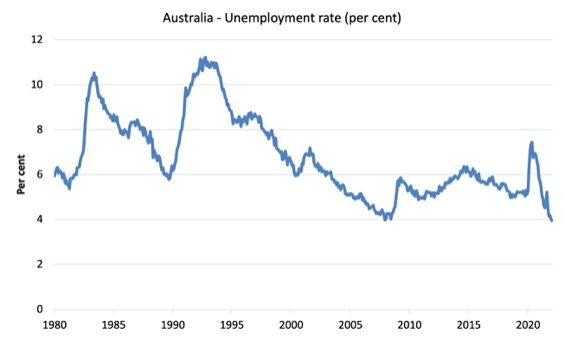
Unemployment fell by 12,100 to 551,300 persons in March 2022
The official unemployment rate remained steady at 4 per cent (but bear in mind the ‘What-if’ analysis above).
The following graph shows the national unemployment rate from March 1980 to March 2022. The longer time-series helps frame some perspective to what is happening at present.
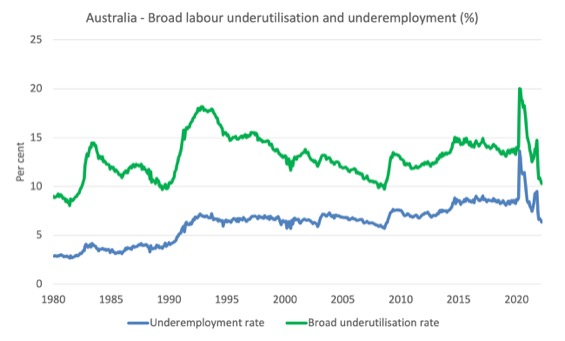
Broad labour underutilisation decreased by 0.3 points to 10.3 per cent in March 2022
The results for March 2022 are (seasonally adjusted):
1. Underemployment decreased by 0.3 points to 6.3 per cent (a fall of 32.9 thousand) – this is the result of a rise in full-time work.
2. Overall there are 882.3 thousand underemployed workers.
3. The total labour underutilisation rate (unemployment plus underemployment) fell by 0.3 points to 10.3 per cent.
4. There were a total of 1433.5 thousand workers either unemployed or underemployed.
The following graph plots the seasonally-adjusted underemployment rate in Australia from March 1980 to the March 2022 (blue line) and the broad underutilisation rate over the same period (green line).
The difference between the two lines is the unemployment rate.
The three cyclical peaks correspond to the 1982, 1991 recessions and the more recent downturn.
The other difference between now and the two earlier cycles is that the recovery triggered by the fiscal stimulus in 2008-09 did not persist and as soon as the ‘fiscal surplus’ fetish kicked in in 2012, things went backwards very quickly.
The two earlier peaks were sharp but steadily declined. The last peak fell away on the back of the stimulus but turned again when the stimulus was withdrawn.
Teenage labour market continues improving in March 2022
As the shortage of workers continues to impinge on employer choice, the gains for teenagers are particularly noticable. Employers are forced to take the available workers and their capacity to indulge in discriminatory behaviour and prejudice (‘they are too young’ or ‘too inexperienced’ etc) is dramatically reduced.
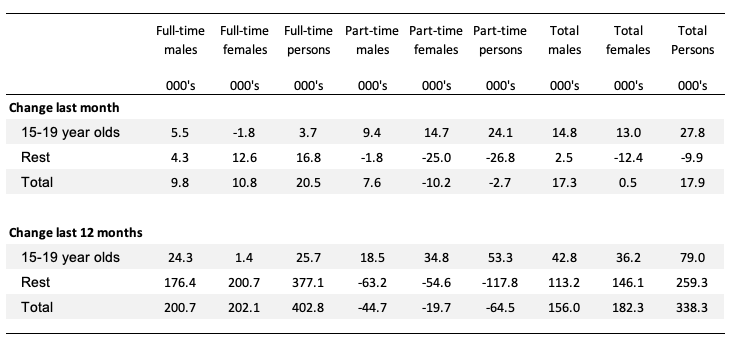
The following Table shows the distribution of net employment creation in the last month and the last 12 months by full-time/part-time status and age/gender category (15-19 year olds and the rest).
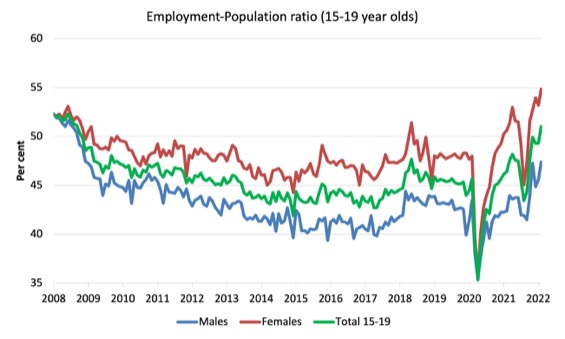
To put the teenage employment situation in a scale context (relative to their size in the population) the following graph shows the Employment-Population ratios for males, females and total 15-19 year olds since June 2008.
You can interpret this graph as depicting the loss of employment relative to the underlying population of each cohort. We would expect (at least) that this ratio should be constant if not rising somewhat (depending on school participation rates).
1. The male ratio has fallen by 4.9 percentage points since March 2008. It rose 1.8 points over the month. It is now 3.9 points above its level in March 2020.
2. The female ratio is 2.7 percentage points above the March 2008 level. It rose 1.6 points over the month. It is now 6.9 points above its level in March 2020.
3. The overall teenage employment-population ratio has fallen by 1.2 percentage points since March 2008. It rose 1.7 points over the month. It is now 5.4 points above its level in March 2020.
Conclusion
My standard monthly warning: we always have to be careful interpreting month to month movements given the way the Labour Force Survey is constructed and implemented.
My overall assessment is:
1. The labour market steadied after the huge rebound last month as the Covid restrictions were substantially dismantled.
2. Employment growth was modest.
3. There are still 1.43 million Australian workers without work in one way or another (officially unemployed or underemployed).
2. We are seeing the impact of flat population growth coming up against growing demand for workers and that is the reason the unemployment rate has fallen so quickly.
4. The underlying (‘What-if’) unemployment rate is closer to 6.4 per cent rather than the official rate of 4 per cent.
That is enough for today!
(c) Copyright 2022 William Mitchell. All Rights Reserved.
Bill for your attention.
Could be worthwhile doing a post on it. Considering what is happening in the world. Putting the bomb nation of ideas under the MMT lens.
Sergey Glazyev is a man living right in the eye of our current geopolitical and geo-economic hurricane. One of the most influential economists in the world, a member of the Russian Academy of Sciences, and a former adviser to the Kremlin from 2012 to 2019, for the past three years he has helmed Moscow’s uber strategic portfolio as Minister in Charge of Integration and Macroeconomics of the Eurasia Economic Union (EAEU).
Glazyev’s recent intellectual production has been nothing short of transformative, epitomized by his essay Sanctions and Sovereignty and an extensive discussion of the new, emerging geo-economic paradigm in an interview to a Russian business magazine.
The architect of what happens next and his ideas how to achieve it.
https://thesaker.is/exclusive-russian-geo-economics-tzar-sergey-glazyev-introduces-the-new-global-financial-system/
Question: Elvira Nabiullina has been reconfirmed as the head of the Russian Central Bank. What would you do differently, compared to her previous actions? What is the main guiding principle involved in your different approaches?
Glazyev: The difference between our approaches is very simple. Her policies are an orthodox implementation of IMF recommendations and dogmas of the Washington paradigm, while my recommendations are based on the scientific method and empirical evidence accumulated over the last hundred years in leading countries.
Does that mean he knows they have the interest rate thing backwards ?