Over the last several years, I have been indicating that I think we are in…
External border closures in Australia reduced the unemployment rate by around 2.7 points
The debate continues as to whether the population growth slowdown instigated by the Covid border restrictions imposed by the Federal government has been responsible for the rapid decline in the unemployment rate in Australia. The mainstream view is that migration is good for the economy and adds more in net terms to overall spending (and labour demand) than the extra workers add to labour supply, meaning that it does not put upward pressure on the unemployment rate. I have always contested that view – as a general statement. The reality is that depending on the stage of the cycle and the strength of labour demand, the rate at which new entrants enter the labour force, and the size of the unemployment pool at any point in time, immigration can undermine the employment prospects of local workers. Based on some reasonable estimates, if the external border had not been closed, the unemployment rate would be around 6.9 per cent now, rather than the official rate of 4.2 per cent. The rapidity of the recovery in the unemployment rate is due to the border closures and that should condition appropriate visa policies.
I have most recently examined this issue in the following blog posts:
1. Why flat wages growth in Australia tells us nothing about the impact of migration on the labour market (November 16, 2021).
2. Restricting population growth is good for local workers (June 22, 2021).
You can familiarise yourself with the political and economic debates about this topic from those posts.
Essentially, the capacity of local firms to access cheap foreign labour attenuates against upward pressure on wages, in both specific segments of the labour market and more generally, and also undermines the necessity for firms to offer on-the-job training to ensure local workers are equipped with the capacities to undertake the vacant job opportunities.
This argument is not intended to be the basis for an attack on migration. Rather it is a case for ensuring there are enough jobs, training and transition for school-to-work opportunities available for all.
Too often, governments have allowed short-term visas to foreign workers to be granted when the local labour is enduring mass unemployment and the governments have been cutting funding to local apprenticeships and vocational training institutions.
That sort of migration definitely damages the prospects of the more disadvantaged local workers.
Firms also have a choice in adjusting to changing labour market conditions:
1. They can use price adjustment.
2. They can use quantity adjustment.
3. Or a combination of both.
Firms typically react to changes in aggregate spending by initally adjusting only the quantity of output rather than the price and quantity.
Why?
First, firms use mark up pricing principles, whereby they add a profit mark up to their unit costs and face roughly constant unit costs over the output range within which they normally produce.
Typically, they maintain some excess capacity and can thus increase output relatively easily without further investment in productive capacity, which would take time. If they face insufficient capacity relative to demand, firms are likely to raise prices to ration demand which inevitably leads to the loss of customers to competitors.
Second, firms face various costs when adjusting prices and thus only periodically make such adjustments.
It has been said that firms use ‘catalogue pricing’, whereby they make their prices known to their prospective customers through advertising and other means and then are prepared to sell goods and services at those prices irrespective of demand (up to their full productive capacity).
At the end of the current catalogue period, they will then make any necessary adjustments to prices based on expected future demand and any recent and expected movements in unit costs.
When there is no excess capacity left to respond to nominal spending growth, then firms will shift to predominantly price adjustment as a way of rationing the spending growth.
With Australia’s external border still largely closed, immigration has shrunk to virtually zero and this has forced employers to work harder to get workers and is one of the reasons unemployment is falling quite quickly, given the circumstances.
This is a dominant quantity adjusting strategy.
Why so? At the onset of the pandemic, the labour market was already weak with a large pool of underutilised labour (14.1 per cent of the available labour resources were either unemployed or underemployed).
Which means that there was a massive pool of labour that local firms could draw on as the external borders shut and the pool of cheap imported labour dried up.
And, all they had to do was offer a job at existing wage rates, for this excess local labour to accept employment.
No wage bidding was necessary.
That is, firms quantity adjusted and covered the ‘shortage’ by accessing the local underutilised worker pool.
With more data now available since I last examined this issue, the following graphical analysis is instructive.
The Population Slowdown
The following graph shows Australia’s working age population (Over 15 year olds) from January 2015 to January 2022.
The red (dotted) line extrapolates the working age population from February 2020, based on the average monthly growth over the period January 2015 and February 2020.
It can be interpreted as showing what the working age population would have been had the pandemic not intervened.
The current gap (as at January 2022) betweeen the actual working age population and the extrapolated aggregate is 556 thousand workers. That is how many extra people of working age there would have been had the pandemic not intervened.
The flattening of the population growth has forced employers to work harder to get workers as economy activity increases after the lockdowns and other restrictions.
It is one of the reasons that employers are lobbying the federal government hard to make it easier for workers on foreign visas to come back – they know as well as I do that this will weaken the bargaining power of local workers, particularly the unemployed and underemployed.

We could say that based on current employment growth and the most recent peak participation rate, the unemployment rate would be 6.9 per cent if the working age population had have followed the extrapolated trajectory, rather than the current official rate of 4.2 per cent.
That is, the estimate of the impact of the border closures.
The Labour Force impact
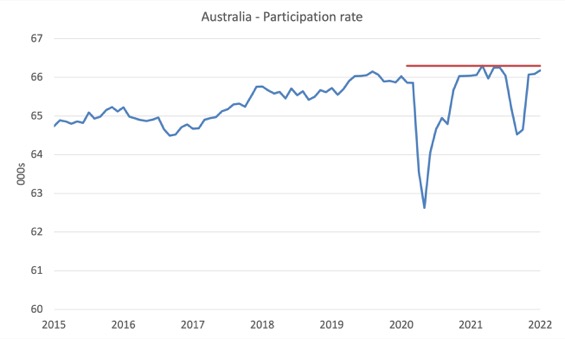
The first graph shows the participation rate from January 2015 to January 2022. The most recent peak (shown by the red horizontal line, which covers the period affected by the pandemic so far) was 66.3 per cent in March 2021 (before the Delta then Omicron waves hit)
In January 2022, the participation rate was 66.2 per cent.
So the pandemic has seen large swings in the participation rate driven by the restrictions, but overall, more people of working age are now in the official labour force than there were pre-pandemic.
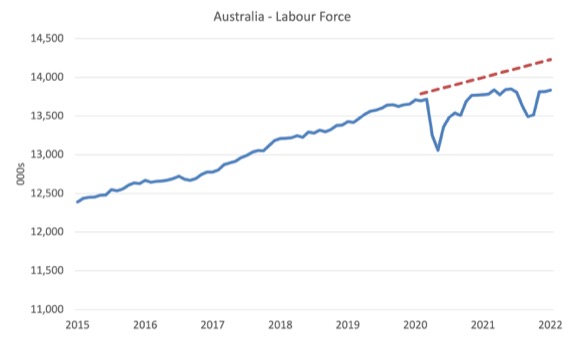
The next graph shows the labour force from January 2015 to January 2022. The labour force is calculated by the statisticians as the working age population times the participation rate.
So it is the number of people from the working age population that are either employed (that is, working more than one hour per week) or unemployed (available and actively seeking work).
The red (dotted) segment is the extrapolation based on the estimated working age population in the first graph times the peak participation rate (66.3 per cent recorded in March 2021).
It shows what the likely labour force trajectory would have been had the pandemic not reduced the growth of the working age population.
The following points can be made:
1. The claim by government that the economy has recovered do not reflect the reality that the labour market is now smaller than it would have been had the pandemic not intervened.
2. The gap between the current labour force and what it would have been if the pandemic had not intervened is 394.9 thousand persons. This is higher than the gap in the actual working age population and the extrapolated aggregate because the participation rate is now higher.
3. Total employment is 259.6 thousand more than it was at the start of the pandemic (February 2020) while the working age population has only risen by 107.6 thousand. And, almost all of those extra jobs have gone to local workers.
Employment trends
The question then is what would employment growth had to have been to simultaneously achieve the current 4.2 per cent unemployment rate, in an environment represented by the extrapolated working age population – that is, without the pandemic-induced border closures?
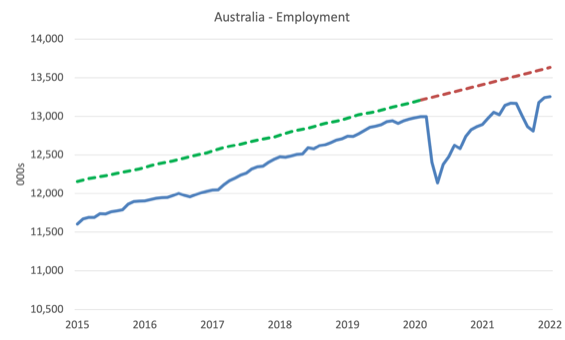
The next graph shows the actual trajectory of employment from January 2015 to January 2022. The two major Covid waves post-February 2020 are shown.
The red dotted line post-February 2020 is calculated by assuming the working age population followed the extrapolated path as in the first graph above, and the participation rate was 66.3 per cent (the March 2021 peak – noting again that in January 2022 it was 66.2 per cent), and sustaining a 4.2 per cent unemployment rate.
The green dotted line (pre-pandemic) shows what employment would have had to have been to sustain a 4.2 per cent unemployment rate. It is based on the actual working age population and a participation rate of 66.3 per cent.
So, it shows how far the required employment growth had been pre-pandemic if a goal of a 4.2 per cent unemployment rate was in place.
The following points can be made:
1. The gap between recorded employment in January 2022, which delivered a 4.2 per cent unemployment rate, and what the employment would have had to have been if the working age population growth had not been flattened by the border closures to achieve that same unemployment rate is 377.3 thousand jobs.
2. The actual growth in employment between February 2020 and January 2022 was 2 per cent.
3. The growth that would have been required over the same period to achieve a 4.2 per cent unemployment rate if the working age population had have grown along the extrapolated path (and participation was at 66.3 per cent) would have been 4.9 per cent or an average of 0.21 per cent per month.
4. Between March 1978 and February 2020, the average monthly employment growth has been 0.15 per cent per month.
5. Without the border closure, a 4.2 per cent unemployment rate would have been very difficult to achieve given historical average employment growth trends.
The ‘What-if’ unemployment analysis
The final graph shows the evolution of the actual unemployment rate since January 1980 to January 2022 and the dotted line is the ‘What-if’ rate, which is calculated by assuming the peak participation rate, the extrapolated working age population and the actual employment since February 2020.
It shows what the unemployment rate would have been given the actual employment growth had the working age population trajectory followed the past trends.
So instead of an unemployment rate of 4.2 per cent, the rate would have been 6.9 per cent in January 2022, given the employment performance since the pandemic.
This finding puts a rather different slant to what has been happening since the onset of the pandemic.

But it also shows that the pandemic restrictions on external borders has allowed the unemployment rate to fall much more quickly than in past downturns.
You can see that by just casually glancing at the trajectory of the unemployment rate after the peaks corresponding to the 1982 and 1991 recessions and the GFC slowdown.
During those episodes, the unemployment rate rose sharply but fell very slowly over several years once economic recovery was underway.
During the pandemic, the rise and fall was sharp and the low-point is yet to be reached.
Conclusion
This sort of analysis is rather tedious and time-consuming.
But it helps to substantiate the conclusions that the external border closures during the pandemic have benefitted local workers and the drive to increase the population growth again through schemes to attract cheap labour will worsen the outlook for local workers.
This sort of work is part of the life of being a working economist and ensures that statements one makes are based on evidence rather than just talking off the top of one’s head.
They are in contradistinction to crazy statements I saw overnight that the dilemma Russia will face with the sanctions will show Modern Monetary Theory (MMT) to be ‘tosh’ or some stupidity or kookiness like that. Some people seem to be obsessed about our work. Sheer idiocy.
That is enough for today!
(c) Copyright 2022 William Mitchell. All Rights Reserved.
Thank you very much for the time and effort you put in to enlighten us.
It reminds me of Newcastle University in the late Sixties, and the hostility directed towards Behavioural Economics.
I’m working my way through your Macroeconomics textbook. That was a real ‘find’ for me.
(And so was ‘Compared to What’ by Les Mcann).
Thanks again, Ian Mackie.
Hi Bill, I keep hearing economy is booming, more people are in work etc. its nice to see someone we can trust to put in the tedious work.
On sanctions, Russia and MMT how do they all fit, if at all. I can’t say I am so surprised at people knocking down MMT, its almost like they have to at as things go on.
I read today about the UK energy minister talking about why we need nuclear (because we can’t afford gas”. I would really like to sit down with one of these ministers and talk about European Pressurised Reactors and Small Modular Reactors.
So for the rant. Thank you for writing everyday. I look forward to Wednesday’s music suggestion.
Hi Bill,
Thank you for your ever-insightful analysis and writing.
Given the recent developments with Russia, I think I write on behalf of many readers in asking your thoughts on the sanctions and impact on the Russian economy.
We’d really value your thoughts on the matter!
As I understand labour force stats, temporary residents aren’t included.
We had 600,000 + temporary residents leave Australia during the pandemic and I suspect quite a few also had working rights ie students etc .
I have assumed that most of the improvement in unemployment was due to that, does this what if scenario include temporary residents?
Thanks for following up on this Bill, I only just saw it linked from today’s blog. This confirms my suspicions that a significant chunk of the labour market effects weren’t merely from the stimulus but from the border closures – despite what many economists try to make out. I just read earlier today that there are expectations that opening borders will ease conditions for employers… despite economists always banging a drum that mass immigration isn’t bad for incumbent workers.
I will watch with interest over the next couple of years to see if the return of immigration stalls continued improvements the labour market recovery.
I’ve been giving this immigration impact issue some more thought Bill, and I am wondering if the rigour of estimating the labour market impacts could be further enhanced if we broke down the analysis into a state by state comparison. The border closures and working-age population effects would presumably have had an asymmetrical effect on state labour markets, as Melbourne and Sydney generally received the bulk of international arrivals. So the border closures would’ve had the most impact on their labour markets. Meaning we should expect to see unemployment falling faster in those cities than elsewhere in the country. I suppose this would be further complicated by the fact that both cities were locked down the most, and also WA went even further with its own hard internal borders. Maybe such an analysis is too difficult to untangle with so much noise and lack of data granularity.