Today (June 3, 2026), the Australian Bureau of Statistics (ABS) released the latest - Australian…
Australian National Accounts – strong growth but unbalanced and fragile
The Australian Bureau of Statistics released the latest March-quarter 2018 National Accounts data yesterday (June 6, 2018). The results were very interesting and shows how vulnerable the Australian economy is despite the relatively strong growth that was recorded. Total growth for the quarter was a healthy 1 per cent which led to an annual growth rate of 3.1 per cent. That is close to our long-term trends. The standout contributor was exports. The National Accounts data indicates that the Australian economy continues to ride the terms of trade cycle. There was a sharp boost in our terms of trade in the March-quarter 2018, which drove export revenue up sharply. At the same time, household consumption expenditure continued to moderate as high levels of debt and flat wages growth impact. Domestic demand was weaker as a result. The boost to exports is volatile while the moderation in consumption is now structural and this means that the current overall growth trajectory is fairly fragile despite the stronger growth in the March-quarter overall. I expect household consumption expenditure to remain subdued while the path that exports will take is much more uncertain. Overall, this is not a balanced growth outcome.
The main features of the National Accounts release for the March-quarter 2018 were (seasonally adjusted):
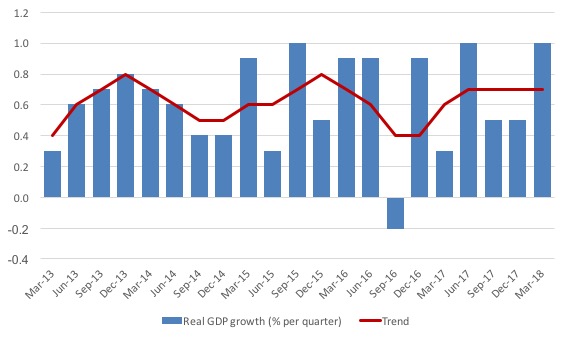
- Real GDP increased by 1 per cent for the quarter – a strong result. The annual growth rate was 3.1 per cent which is approaching the pre-GFC trend.
- The main positive contributors to real GDP growth were Exports of goods and services – contributing half of the overall quarterly result. General government consumption expenditure contributed 0.3 points).
- The main negative contributing factor was public investment.
- The public sector overall (consumption and investment) added 0.2 points to growth – with public consumption spending (0.3 points) and capital formation (-0.1 points).
- Australia’s Terms of Trade (seasonally adjusted) rose by 3.3 per cent in the quarter but fell by 2.6 per cent over the 12 month period.
- Real net national disposable income, which is a broader measure of change in national economic well-being rose by 1.9 per cent for the quarter and 2.5 per cent for the 12 months to the March-quarter 2018, which means that Australians are better off (on average) than they were at that point 12 months ago.
- The Household saving ratio (from disposable income) fell to 2.1 per cent, well below the levels that were observed following the GFC.
Overall growth picture – relatively robust but narrowly based
The ABS – Press Release – said that:
The Australian economy grew 1.0 per cent in seasonally adjusted chain volume terms in the March quarter 2018 led by growth in exports of mining commodities … Growth in exports accounted for half the growth in GDP, and reflected strength in exports of mining commodities …
Household consumption grew by 0.3 per cent driven by rises in non-discretionary items and grew 2.9% through the year. The household savings ratio fell to 2.1 per cent and was at its lowest rate since December 2007.
So the volatile exports sector drove growth along with public sector consumption spending (see more below), while the largest component of aggregate spending – household consumption expenditure remained weak as flat wages growth and record levels of debt take their toll.
This is a rather precarious situation.
According to the ABS, the contribution of household consumption expenditure was mainly “driven by rises in non-discretionary components such as insurance and other financial services (0.7%), food (0.5%), and electricity, gas and other fuels (2.3%).”
So households are being squeezed by privatised energy providers, health insurance companies and banksters.
The other growth contributor was public spending and “State and local government consumption rose 1.4%, while national government consumption increased by 1.7%.” So recurrent public expenditure was much stronger than household consumption.
The ABS said that: “Total gross fixed capital formation contributed 0.1 percentage points to GDP growth during the quarter”, which is a rather weak outcome.
The graph the quarterly growth over the last five years (with the red line being the ABS moving average trend). The trend growth has been flat since the June-quarter 2017 and it remains to be seen whether the spike in quarterly growth for March will set a new upward trend.
Analysis of Expenditure Components
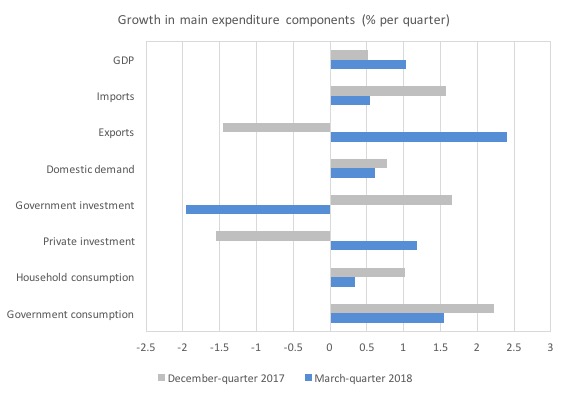
The following graph shows the quarterly percentage growth for the major expenditure components in real terms for the December-quarter 2017 (grey bars) and the March-quarter 2018 (blue bars).
The large swing in growth in export spending is notable.
Public consumption expenditure fell from 2.2 per cent in the December-quarter to 1.6 per cent in March but was still a solid contributor to overall growth.
The large swing in public sector capital investment expenditure is clear and subtracted from growth.
Domestic demand growth declined slightly to 0.6 per cent in the March-quarter 2018, reflecting the modest growth in household consumption spending (down to 0.3 per cent from 1 per cent).
Private investment expenditure growth rebounded to 1.2 per cent after falling by 1.5 per cent in the December-quarter 2017.
Contributions to growth
What components of expenditure added to and subtracted from real GDP growth in the March-quarter 2018?
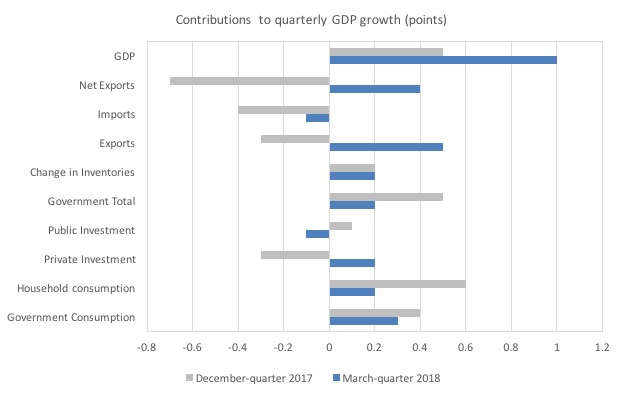
The following bar graph shows the contributions to real GDP growth (in percentage points) for the main expenditure categories. It compares the March-quarter 2018 contributions (blue bars) with the December-quarter 2017 (gray bars).
The reversal of net exports (driven by a very strong contribution from exports) in the March-quarter 2018 is the item of note.
It contributed half the quarterly growth in overall GDP.
The moderation in the contribution of household consumption – down to 0.2 from 0.6 – is also notable. This is at the same time the household saving ratio fell, meaning that households are being squeezed by flat income growth and rising energy and health costs.
The reversal in the contribution of private investment expenditure is also an improvement.
Material well-being improves in March-quarter 2018
The ABS tell us that:
A broader measure of change in national economic well-being is Real net national disposable income. This measure adjusts the volume measure of GDP for the Terms of trade effect, Real net incomes from overseas and Consumption of fixed capital.
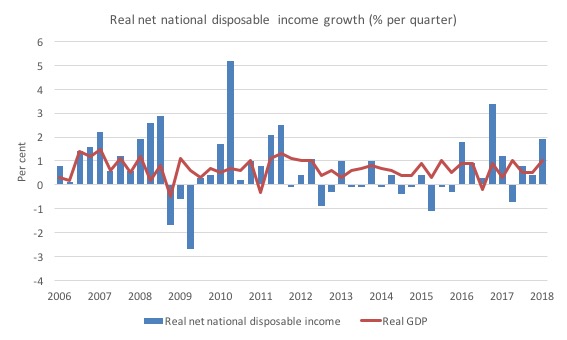
While real GDP growth (that is, total output produced in volume terms) grew by 1 per cent in the March-quarter 2018, real net national disposable income growth was a strong 1.9 per cent (up from 0.4 per cent).
Over the 12 months to March 2017, Real net national disposable income grew by 2.5 per cent, which means that Australians were better off in the March-quarter 2018 in income terms than they were twelve months prior.
The following graph shows the evolution of the quarterly growth rates for the two series since the March-quarter 2006.
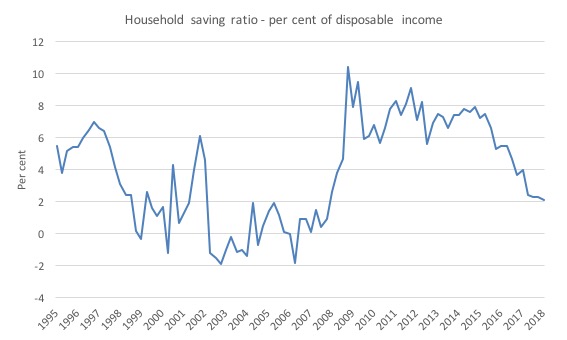
Household saving ratio fell to 2.1 per cent
The squeeze on wages in Australia is manifesting in two ways. Rising indebtedness and a falling saving out of disposable income. Household consumption has been driven in recent quarters by credit and saving withdrawals although the growth in employee compensation in the March-quarter may alter that.
The household saving ratio fell in the March-quarter 2018 at the same time that household consumption expenditure moderated.
Both outcomes are consistent with a weakening household situation.
The following graph shows the household saving ratio (% of disposable income) from the March-quarter 1995 to the current period.
Over the last 12 months the household saving ratio has fallen from 4.0 per cent (March-quarter 2016) to 2.1 per cent (March-quarter 2018).
The decline in the Household saving ratio from its 2011 levels has been associated with a renewed rise in household indebtedness – back to record levels. It was also the period when the federal government started to impose fiscal austerity.
After the GFC hit, the household sector sought to reduce the precariousness in its balance sheet exposed by the GFC.
Prior to the crisis, households maintained very robust spending (including housing) by accumulating record levels of debt. As the crisis hit, it was only because the central bank reduced interest rates quickly, that there were not mass bankruptcies.
In June 2012, the ratio was 11.6 per cent. Since the March-quarter 2013, it has been steadily falling as the squeze on wages has intensified.
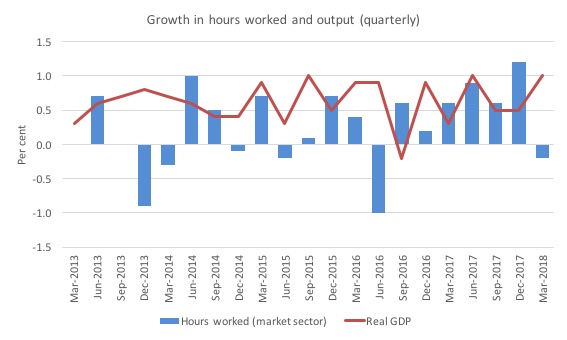
Real GDP growth and hours worked
The following graph presents quarterly growth rates in real GDP and hours worked using the National Accounts data for the last five years to the March-quarter 2018.
You can see the major dislocation between the two measures that appeared in the middle of 2011 persisted throughout 2013 and reasserted itself in early 2016.
From then until the most recent quarter, the two series moved more or less together.
However, in the March-quarter 2018, real GDP growth and hours worked moved in opposite directions – hours down sharply and growth strongly upwards.
The March-quarter data shows that GDP per hour worked (productivity of labour) rose by a strong 1.4 per cent in the March-quarter 2018, which is no surprise given that total hours worked fell by 0.4 per cent while real GDP rose by 1 per cent.
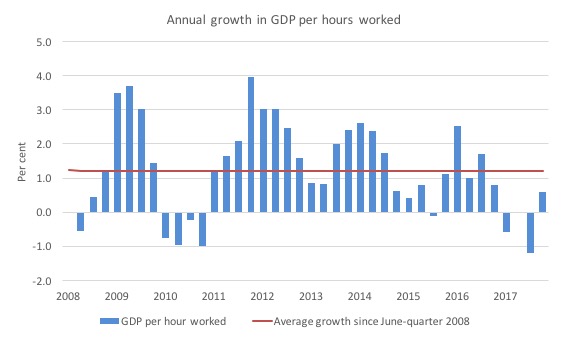
To see the above graph from a different perspective, the next graph shows the annual growth in GDP per hour worked (labour productivity) from the June-quarter 2008 quarter to the March-quarter 2018. The horizontal red line is the average annual growth since June-quarter 2008.
The relatively strong growth in labour productivity in 2012 and the mostly above average growth in 2013 and 2014 helps explain why employment growth was lagging given the real GDP growth. Growth in labour productivity means that for each output level less labour is required.
In the March-quarter 2018, annual labour productivity growth was 0.6 per cent and reversed the previous four consecutive quarters of negative growth.
Stronger productivity growth means that output growth has to be stronger to keep the unemployment rate constant.
Conclusion
Remember that the National Accounts data is three months old – a rear-vision view of what has passed and to use it to predict trends is difficult.
Coming up with assessments of where the economy is heading requires analysis of the more recent data – such as labour force surveys and the like.
But the National Accounts data indicates that the Australian economy continues to ride the terms of trade cycle. There was a sharp boost in our terms of trade in the March-quarter 2018, which drove export revenue up sharply.
At the same time, household consumption expenditure continued to moderate as high levels of debt and flat wages growth impact.
Domestic demand was weaker as a result.
The boost to exports is volatile while the moderation in consumption is now structural and this means that the current overall growth trajectory is fairly fragile despite the stronger growth in the March-quarter overall.
I expect household consumption expenditure to remain subdued while the path that exports will take is much more uncertain.
Overall, this is not a balanced growth outcome.
That is enough for today!
(c) Copyright 2018 William Mitchell. All Rights Reserved.
Please provide guide or link to data or charts over 2008-2018 which show split of Real net national disposable income growth per quarter between;
a) businesses, i.e. companies&corporations&charities
b) natural persons, i.e. individual incomes.
c) any other income receiving entities
Dear Peter (at 2018/09/09 at 11:19 am)
My blog is not a request for data service. Sorry.
You can find the data at the ABS WWW site.
best wishes
bill