Today (June 3, 2026), the Australian Bureau of Statistics (ABS) released the latest - Australian…
Australian national accounts – growth slowdown continues
The Australian Bureau of Statistics released the latest December-quarter 2017 National Accounts data today (December 6, 2017). It showed several things that defy the hype in the media. First, overall real GDP growth was just 0.4 per cent for the quarter – 1.6 percent annualised – miserable. Even the actual annual rate of 2.4 per cent is well below past trends. Private capital formation was negative. Net exports were negative. Growth is being sustained by household consumption on the back of record levels of household debt and government spending (mostly local and state level investment). Without the contribution of government spending, overall growth would have been negative in the December-quarter. And this is a government that is trying to cut its deficit. This ‘rear vision’ account of where the economy was in the last three months of 2017 is thus not very good reading. Real GDP growth has fallen from 0.8 per cent in the June-quarter, to 0.6 per cent in the September-quarter to 0.4 per cent in the December-quarter. That is a trend I suspected would emerge. What is obvious to me is that private investment is flagging after showing some signs of recovery and a stronger fiscal contribution is necessary to ensure that household consumption scales more proportionately with growth in incomes rather than debt. than is evident in the current data. The external sector continues to make a negative contribution to growth with exports falling. There is no big Post Mining Boom-Export Boom happening folks. The one positive was that growth in compensation of employees was above 1 per cent for the quarter and 4.8 per cent for the year. We will see whether that materialises into a trend. As I concluded last quarter, the overall assessment is that growth is positive but slowing. And, it remains unbalanced and uncertain.
The main features of the National Accounts release for the December-quarter 2017 were (seasonally adjusted):
- Real GDP increased by 0.4 per cent. The annual growth rate was 2.4 per cent and remains below the rate that is required to keep unemployment from rising given usual trends in productivity and labour force growth.
- The main positive contributors to real GDP growth was household consumption (0.6 percentage points) and General government (0.3 points).
- The main negative contributing factors were Private Capital formation investment (-0.5 percentage points) and Net exports (-0.4 percentage points). Exports alone subtracted 0.4 points of growth.
- The public sector overall (consumption and investment) added 0.3 points to growth – with public consumption spending (0.1 points) and capital formation (0.2 points).
- Australia’s Terms of Trade (seasonally adjusted) rose by 0.1 per cent in the quarter but fell by 1 per cent over the 12 month period.
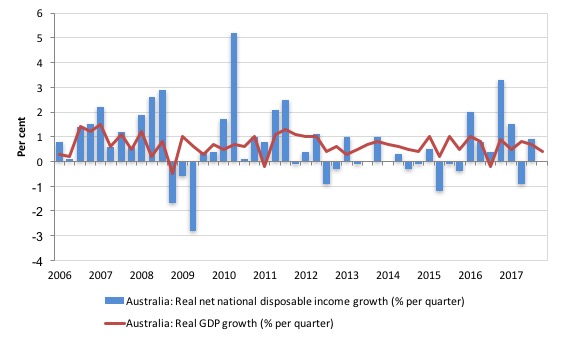
- Real net national disposable income, which is a broader measure of change in national economic well-being was static for the quarter and rose by just 1.5 per cent for the 12 months to the December-quarter 2017, which means that Australians are slightly better off (on average) than they were at that point 12 months ago but unchanged in the last three months of 2017.
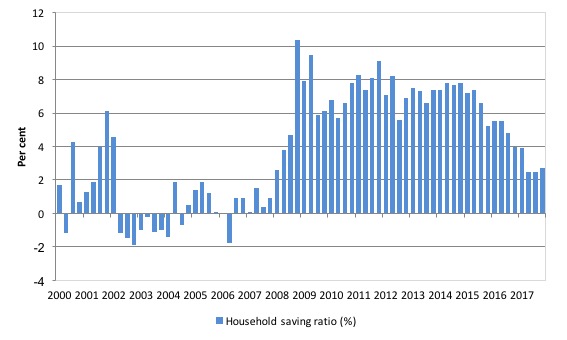
- The Household saving ratio (from disposable income) rose from 2.5 to 2.7 per cent but remains well below the levels we saw just after the GFC.
Overall growth picture – slowing underway
The ABS told us yesterday (March 6, 2018) in the data release – Balance of Payments and International Investment Position, Australia, Dec 2017 – that:
Increased goods imports, flat goods exports and a widening net primary income deficit were the main contributors to the current account deficit increase in the December quarter 2017 …
In volume terms, exports fell and imports rose this quarter, and as a result international trade is expected to detract 0.5 percentage points from growth in the December quarter 2017 Gross Domestic Product.
So after all the hype about the once-in-a-hundred years mining boom, the external sector is still draining growth and exports
Rural goods fell by a staggering 9.7 per cent in real terms and capital goods imports felll by 5.8 per cent in real terms. Non-rural goods (mining ores, coal etc) fell in real terms by 0.3 per cent.
So no boom is going to come from the export sector any time soon.
Australia continues to experience an unstable growth outlook.
According to the ABS, the contribution of household consumption expenditure was mainly “driven by rises in health (3.4%), hotels, cafes and restaurants (2.9%) and recreation and culture (2.0%)”.
So we are paying more to be sick and partying a bit more!
The other growth contributor was public spending and “Government final consumption expenditure increased 1.7%” (“State and local government consumption grew 0.7%, while national government consumption increased by 3.1%.”).
The ABS note that “Public investment increased 2.9% during the quarter driven by state and local general government (1.9%). This increase was due to an asset transfer from the private sector.” At this stage, we don’t know what that transfer involved.
On the other hand, “Private investment decreased 2.2% and was driven by non-dwelling construction (-8.0%) and to a lesser extent dwellings, which fell 1.3%.”
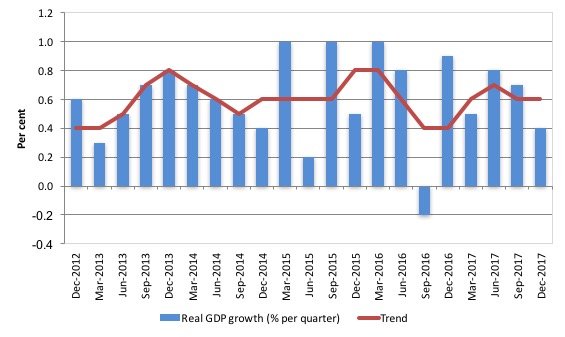
The graph the quarterly growth over the last five years (with the red line being the ABS moving average trend). The trend growth is now flat and quarterly growth is slowing.
Analysis of Expenditure Components
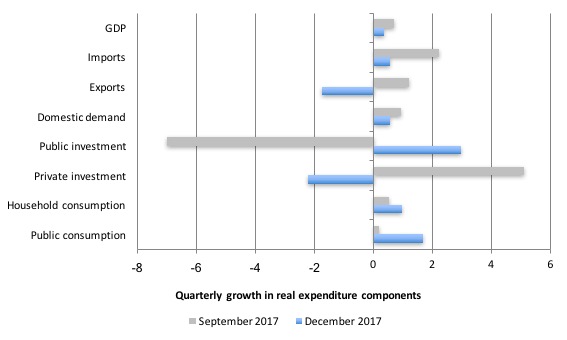
The following graph shows the quarterly percentage growth for the major expenditure components in real terms for the December-quarter 2017 (gray bars) and the December-quarter 2017 (blue bars).
The large swing in public sector capital investment expenditure is clear and significant for the overall growth result. Public investment tends to be lumpy – something big gets purchased which lasts for a long time.
The growth in public investment reflects the scaling up of large State government projects in Melbourne and Sydney and an “asset transfers from the private sector” – we will wait to see what that was.
Domestic demand growth declined slightly to 0.56 per cent in the December-quarter 2017, reflecting the 2.2 per cent drop in Private investment expenditure.
Household consumption growth reversed the slowdown in the September-quarter and rose sharply to 0.96 per cent (up from 0.53 per cent in the September-quarter). The saving ratio rose slightly, which may signify that the credit-binge that has been driving consumption growth in recent quarters is coming to an end as employee compensation has finally started to rise.
Private investment growth was negative (2.23 per cent).
Exports volumes fell by 1.75 per cent (despite rising prices) and import growth was weaker (0.55 per cent).
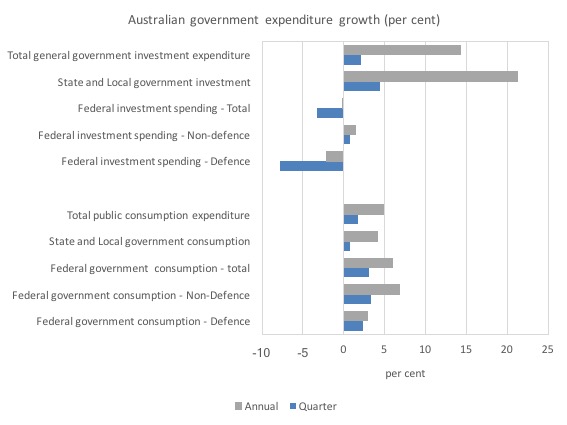
The following graph shows the profile of public consumption and investment expenditure at the different levels of government.
It is clear that public sector investment expenditure has been very strong over the last year, particularly at the state and local government level (large projects such as the Metro expansion in Melbourne, Westconnex in Sydney).
The Federal government investment was negative for the quarter and the year.
Contributions to growth
What components of expenditure added to and subtracted from real GDP growth in the December-quarter 2017?
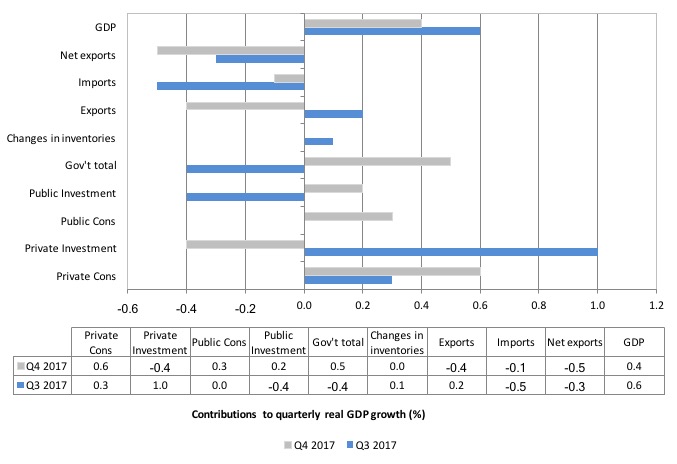
The following bar graph shows the contributions to real GDP growth (in percentage points) for the main expenditure categories. It compares the December-quarter 2017 contributions (grey bars) with the June-quarter 2017 (blue bars).
Net exports continued to subtract from growth in the December-quarter 2017, as export volumes fell.
Private household consumption contributed 0.6 percentage points to growth (up from a revised 0.3 points) and the saving ratio rose slightly.
The public consumption contribution rose to 0.3 points while public investment (capital formation) added 0.2 percentage points to growth.
The overall contribution of the government sector to growth was thus 0.5 percentage points. Without that contribution overall growth would have been negative.
Material well-being static in December quarter
The ABS tell us that:
A broader measure of change in national economic well-being is Real net national disposable income. This measure adjusts the volume measure of GDP for the Terms of trade effect, Real net incomes from overseas and Consumption of fixed capital.
While real GDP growth (that is, total output produced in volume terms) grew by 0.4 per cent in the December-quarter 2017, real net national disposable income growth was zero.
Over the 12 months to December 2017, Real net national disposable income grew by just 1.5 per cent, which means that Australians were better off in the December-quarter 2017 in income terms than they were twelve months prior.
The following graph shows the evolution of the quarterly growth rates for the two series since the December-quarter 2006.
Household saving ratio rose modestly to 2.7 per cent
The squeeze on wages in Australia is manifesting in two ways. Rising indebtedness and a falling saving out of disposable income. Household consumption has been driven in recent quarters by credit and saving withdrawals although the growth in employee compensation in the December-quarter may alter that.
The following graph shows the household saving ratio (% of disposable income) from 2000 to the current period.
Over the last 12 months the household saving ratio has fallen from 4.0 per cent (December-quarter 2016) to 2.7 per cent (December-quarter 2018).
The decline in the Household saving ratio from its 2011 levels has been associated with a renewed rise in household indebtedness – back to record levels. It was also the period when the federal government started to turn on the austerity wheel.
After the GFC hit, the household sector sought to reduce the precariousness in its balance sheet exposed by the GFC.
Prior to the crisis, households maintained very robust spending (including housing) by accumulating record levels of debt. As the crisis hit, it was only because the central bank reduced interest rates quickly, that there were not mass bankruptcies.
In June 2012, the ratio was 11.6 per cent. Since the December-quarter 2013, it has been steadily falling as the squeze on wages has intensified.
While the recent trend has been downwards, it is unlikely that households will return to the very low and negative saving ratios at the height of the credit binge given that the household sector is now carrying record levels of debt.
Perhaps the recovery in employee compensation signalled in this data release will allow the saving ratio to stabilise at a higher level and allow some reduction in household indebtedness to slowly occur. I am not be confident of that yet though.
Real GDP growth and hours worked
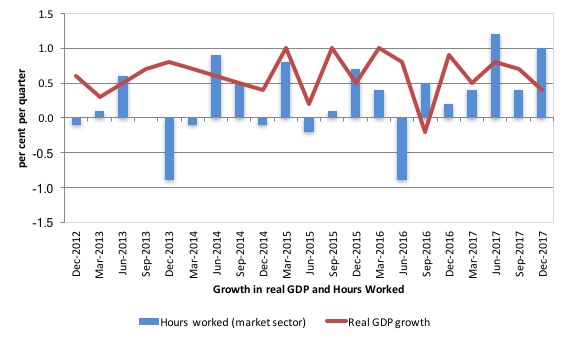
The following graph presents quarterly growth rates in real GDP and hours worked using the National Accounts data for the last five years to the December-quarter 2017.
You can see the major dislocation between the two measures that appeared in the middle of 2011 persisted throughout 2013 and reasserted itself in early 2016.
In the December-quarter 2017, real GDP growth and hours worked moved in opposite directions – hours up sharply and growth down.
Today’s data shows that GDP per hour worked (productivity of labour) fell by 0.8 per cent in the December-quarter 2017, which is no surprise given that total hours worked rose by 1.0 per cent while real GDP rose by 0.4 per cent.
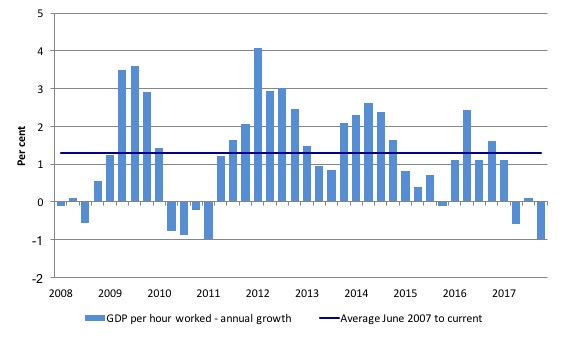
To see the above graph from a different perspective, the next graph shows the annual growth in GDP per hour worked (labour productivity) from the June-quarter 2008 quarter to the December-quarter 2017. The horizontal blue line is the average annual growth since December-quarter 2007.
The relatively strong growth in labour productivity in 2012 and the mostly above average growth in 2013 and 2014 helps explain why employment growth had been lagging given the real GDP growth. Growth in labour productivity means that for each output level less labour is required.
In the December-quarter 2017, annual labour productivity growth was minus 1.0 per cent and marked four consecutive quarters of negative growth. This will mean the relatively slower annual real GDP growth rate will probably not push unemployment up as much as it would had productivity growth been close to that average.
Conclusion
Remember that the National Accounts data is three months old – a rear-vision view of what has passed and to use it to predict trends is difficult.
Coming up with assessments of where the economy is heading requires analysis of the more recent data – such as labour force surveys and the like.
But today’s National Accounts data indicates that slowdown in the Australian economy that started in the June-quarter 2017 continued up until the end of the year.
The fact that growth would have been negative but for the contribution of the public spending tells us two things.
1. Government spending is good for the economy (if growth is desirable).
2. This is no time for austerity given the weak private investment and the on-going negative trade contribution.
Overall, this is not a balanced growth outcome. The outlook is very uncertain given the lumpiness of the public spending.
That is enough for today!
(c) Copyright 2018 William Mitchell. All Rights Reserved.
Dear Bill,
I am interested in doing sector-balance analysis on a regular basis for my country. It is very easy to
get data for the government sector as well as the external sector. But how to get data for the private sector (S-I)? You could get some data on personal savings(households net disposable income not consumed). Investment data should be accessible from GDP stats. But where do you get savings-data from the corporate sector? Net profits after tax or net cash balance from operations(ex finance)? I am not sure how to get congruent data! Tips?
Many thanks for your work!
Dear Thorleif (at 2018/03/07 at 5:48)
The way data is presented within the standard National Accounts framework makes it nearly impossible to get accurate versions of the three balances – the (S-I) being the troublesome one as you hint.
The way I do it (which is standard) is to use the Balance of Payments and the Fiscal data, which is clean and accurate (as much as it can be) and then derive the private domestic balance using the accounting constraint.
That is the only way you get a reliable result.
best wishes
bill
Answer to Bill;
Yes, foreign savings you get from Balance of Payments and then I have to derive the residual private savings(domestic) out of government fiscal stats using the GDP-equation( (GNP – C – T)).
Still kind of strange that governments don´t collect/publish “hard data” on domestic savings(on a regular basis)! So all comments by economists(in the press etc) about savings are individually derived(error-factor!). Could be very confusing also when commentators are using different terminology. In Sweden i.e budget-surpluses are law-constrained over a business-cycle(+1%) and is called “savings” for the future! 🙂 (Current account 2016 +4,5% of GNP(trade balance +2,2%), down from +8% 2007(before GFC) but up from negative(1984-) before Sweden´s own GFC 1992 before devaluing the Krona 30% after having the currency pegged.
Dear Thorleif (at 2018/03/07 at 7:40 pm)
Use the sectoral balances equation to derive (S-I).
So (S-I) = (G-T) + (X-M)
If the deficit is 2 per cent and the current account surplus is 1 per cent, then for that observation (S-I) will equal +2 + 1 = 3 per cent saving overall.
And so on.
best wishes
bill
Liberal Party in Sweden has now again started talks about demanding adoption of the Euro in 2019. Halleluja! There is a agenda in the press not to acknowledge that the EU-elites is marching towards a fiscal union. People in general does not understand this. As once Prodi stated: There will come a crises when we can consolidate(change the Treaty i.e). The euro was that mean. They call it democracy!
Thank you Bill.
The sectorial balance equation works fine but as I said I wanted to drill deeper into the savings data.
//best wishes
Bill
Could you recheck this please
“The overall contribution of the government sector to growth was thus minus 0.5 percentage points. Without that contribution overall growth would have been negative.”
Then the graph shows +0.5% … or I could be just reading it wrong
Cheers
Mark; You are right! Without +0,5 growth by government during Q4 2017 overall GDP was negative(-0,1).
Guess Bill mixed his mind accidentally with the Q3 numbers! Both graph and table show +0,5 and the aggregate numbers adds up.
cheers
Oh dear oh dear! I thought the Scandinavians were much too sensible to abandon currency sovereignty. This was my fear if the UK had voted to stay in the EU; that we would one day face insuperable pressure to join the Eurozone. (Even now it is not 100% certain that we will leave the EU; there are certainly powerful forces at work trying to oppose it, and Brexit is being (mis)-handled by an idiot government).
Mike Ellwood:
My response too(oh dear!). It´s been silent about the euro since the GFC and the “euro-moment” in government bonds 2010-2012. The neoliberals were all quite when “efficient market hypothesis”(among others)fell apart incl Bernanke´s “promise” about a housing-crisis.
Now Sweden have had a pretty long period of decent growth and relatively low unemployment. During the last years we have also seen overheating sectors lacking competent workers(last seen 1990 before our own GFC). The biggest party the Socialdemocrats(S 26,8% latest poll) rules together with the Left(V 8,2%) and the Greens(MP 3,8%). No euro-talks there at all. Election is coming up this year in autum.
Liberal Party(L 4,8% poll) is small and are in danger of falling below the 4%-barrier(=no seats). The other neo-liberal party is the Center(C) right party(9,9%) which are in favour of open borders, free migration and low-income jobs(Ayn Rand-type environment). I think they could be positive to the euro in the near future but elections comes up and a minority-government again is not really wanted by the people(The Sweden Democrats(SD 17,8%))the right wing party(anti-migration) is left out from any government-koalition(called nazis by our PM) by all parties up to date(M could be a collaborater though).
Our original neo-liberal/conservative party Moderaterna(M 22,6%) have said no to the euro for many years before the GFC. Swedish business-sector has a big influence on M(but also traditionally on S) and I would be surprised if they would start talking euro if they join a new government. But who knows!
Yes, media and establishment are very, very keen to put both Trump and May in a negative context, always. Here in Sweden they take every chance to focus on their personal shortcomings rather than what they represent(why election results were what they are). It is about an elite who now tries to get rid of Trump as fast as possible. No other president(voters behind) have been handled this way before.
Hello,
I saw the interesting discussion between Bill and Thorleif about calculating S-I and finding data. This is a problem I have faced as well.
One thing I look at is the level of private credit creation as a proxy, loans to the private sector is the category. This is the private sector dissaving/deficit and can also be used as a doublecheck on S-I.
In some countries, the rate is negative which shows the stock of private debt coming down. Portugal and Italy are examples. In most, it is growing.
The total of loans is the stock and the difference from one time period to another is the flow.
Being a novice I wondered how valid this approach was?
I enjoyed your Finland presentation.
Thanks
Hi anyone,
some time ago I read something written by Bill regarding how around 2000(i think) the commonwealth govt instituted some laws or similar preventing the govt from being able to ‘print money’ without matching it $ for $ with selling bonds, or using words which I remember, they said that it is in the best interests if all govt spending is ‘market sourced’…
can anyone remember this and point me to the source?
cheers
Alan;
Being a novice myself nowadays I agree you can study private debt stock as a kind of proxy for how a country saves or not or rather the growth of dissavings and it´s risks. But only as a very broad measurement if debt-growth is very high, i.e above “normal” levels and with low personal savings-ratios. Don´t forget bankloans create deposits and every new debt is matched by an asset. One man´s debt is another man´s savings. So no net savings is accumulated on an aggregated level. Real new financial assets can only be created by new bankreserves by the government(by crediting bankaccounts) seeing a sovereign nation as an entity.
The easiest way by far is first to study the current account and government budgetbalance and then relate to private debt-growth(private balance-sheets)and income(GDP and net personal disposable income).
As I wrote above savings in Sweden is high but also private sector debt. Swedish centralbank are using QE and a negative funds rate to; a)match ECB monetary-policy(de facto pegging Krona to Euro), b) depreciate the krona against (other) currencies to boost export(GDP)and traditionally help the X-industry, c) depreciate the Krona to make import more expensive and hopefully raise inflation to target(and as per now above target), d) negative or extreme low rates shall also boost consumtion and investments(higher growth)! One problem with this policy could be that government bonds(savings in the private sector) have been slowly disappearing(Sweden also runs a positive budgetbalance and wants to amortize it´s debt!!) from the market(sits on CB´s BS). QE are in fact crowding out safe interestbearing assets to more risky ones incl stocks(could be an objective!). At the same time price on safe goverment bonds are driven to the roof(negative rates on bank-accounts for larger depositors). Banks i.e are keeping it´s (bank)reserves in the centralbank or in GB´s. In Sweden cb deposit-rates are negative compared to the US were excess-reserves(from earlier QE) returns almost the funds-/repo-rate(FED wants a positive target-rate).
Historically a bank kept reserves (money in a safevalve and deposits att cb) to service customer withdrawal and bankruns(crises) or by law. In a digital world that has changed. Still banks needs reserves though and the only riskfree ones are still a CB-deposit(low or no(neg)interest) or GB´s(interestbearing).
Take one of Sweden´s biggest and most expanding lending-banks, SHB, Handelsbanken. Stockholders capital(equity) was 2016 5% of grossbalance(riskleverage 20 times). The bank had placed 2,3 times their equity in riskfree assets(government money). 2/3-rd was in cb-deposits which had a negative return because of negative cb target-rate. Think risk and how society in Europe have moved on the economic leverage-ladder(in search of efficiency and return)since the 70s. Markets and marketvaluation is the central theme. Overvalued markets(assets) are always a high risk which i.e often correlates to high debt growth over shorter or longer periods. Imagine what can happen if there are no more GB´s? Private sector excl banks can not place their money at the cb. Pensionfunds, the biggest moneyplayer of all nowadays incl in GB´s, have to negotiate with banks on time-deposits! And how about collateral? Interbank-lending(repo-market) is driven by high quality securities. Without GB´s lending will probably be curbed etc.
To answer your question about lending I would say the following in general; No growth without lending. Income(flow to service credit) must match lending-growth. Banks must be carefully regulated not least because they know they will(to-big-to-fail) be saved by the government(or in worse case the taxpayers). Lending follows the business-cycle. As banks today are not utilities they no longer favour general debt-amortizations(banks are active traders and market-analyzers)by their borrowers. If banks are wrong on markets, for whatever reason(like greed), this can cause havoc in the real economy due to collateral-damage(banks getting risk-averse and overindebted customers stops consuming/investing). One must know that in a very low-interest-rate environment both parties have motives to borrow/lend even more(income-related). Interest-spreads(margin) are much smaller during i.e Zirp(incl competition-pressure) which for banks means they need larger volumes for the same nominal return. And as profits grows together with falling interest-rates the banks owners demands higher returns on their equity. When banks balance-sheets expands in this scenario they will/can face a smaller by smaller ratio between equity and total assets/debts. Thats why it is extra important to regulate banks on a development basis. They lend to creditworthy borrowers but if market-collateral “unexpectably” break down to much and fast they have to have enough reserves. And banks wants returns on these reserves. If thats not the case banks may take to large risks.
Sorry if I went a little far in how I see borrowing and saving. I even wrote in self-interest to reflect over what´s driving our own “housing-bubble”. Due to the rate-increases in the US the swedish Riksbank has announced they will “keep rates well below inflation for many years to come”. The Krona is being sold of cource. But they also told us they will raise their inflation-target(lowering the Krona). “Everyone” can be happy! No one believes they succeed by them selfes 🙂 . It will be interesting to see how a normal(longer) recession looks like. Continuing deflation-pressure or stagflation-risks due to increasing lack of demand(price-raising insted of lowering?)?
Greetings!
Is this a healthy market or just a return from an unsound one?
https://d33wjekvz3zs1a.cloudfront.net/wp-content/uploads/2018/03/Interbank-Lending.jpg
Post: March 9; 22.27 Interbank lending chart above
Heard some folks calling the trend a falling liquidity issue but the following chart link should tell us falling interbank-loans is a mirror-image of the FED monetary base(4 Trillion). Plenty of QE-liquidity!
Excess-reserves are interest-bearing. Different interest-decomposition below excess-level?
https://fred.stlouisfed.org/series/BASE
US credit-growth have also been in a falling trend since 2016.
http://moslereconomics.com/2018/01/16/bank-lending-review-us-dementia-signs/
Is this a classical recession-precurser! Trade-deficit also seems expanding. Current account forecast is also more negative 2018 than 2017. Budget-deficit is planned to shrink somewhat 2018 compare to 2017.
https://www.statista.com/statistics/216940/forecast-of-us-budget-balance/
Conclusion: Falling net financial assets into 2018 and together with shrinking credit-demand the economy should get softer.
Hello Thorlief,
Here are some sectoral balance calcs for Sweden.
year Gov Ext private
2016 -0.9 4.4 3.5
The number for private is as per Bill’s advice and as Wynne Godley wrote in his book.
Another interesting figure is credit creation which is 3.97 of GDP. No doubt people going into big debt to afford accommodation.
What the figures say is that your government is internally devaluing your economy with austerity while the owners of exporting businesses take home big profits from the current account surplus.
Sorry the numbers are a bit old I will update them soon. I get them from tradingeconomics dot com who get them off the government.
Thanks
Alan
Hello Thorlief,
I have relatively up to date numbers for the USA as it is the tail that wags the economic dog; a forecast for 2018 too.
year Gov Ext Private
2016 3.20, -2.60, 0.60
2017 3.50, -2.42, 1.08
2018 4.29, -2.40, 1.89
The Trump budget put some more money back into the private sector and will likely let the economy stagger on for another 18 months or so.
As you say credit creation is flat to decreasing but still positive and may even pick up thanks the gov spending.
I keep a big spreadsheet with 63 countries on it and the USA is 44th in terms of the private sector balance being positive and net saving.
Hello Alan;
Thank you for your stats. Your Sweden stats is the same figures as I noted above. Sweden is doing well thanks to it´s external positive balance incl net export. I agree with your asumtions!
When it comes to the US maybe my figures missed the latest tax-cuts by Trump(=larger deficit instead of smaller 2018). If that is prolonging the ongoing economic strengthening I have no opinion.
May I ask were you see a growing tendency of a negative private sector balance? Greece would be a candidate of course(7 years of depression with no prospect of a return to long term growth with the euro).
Hello Thorleif,
Yes, for the USA I added not just the tax cuts but also the debt ceiling deal that put more money on the table as well. Just a forecast though. Yes, more money in the private sector can only help.
Send me your email address and I will send you a screenshot of my table and you can see the sectoral balances for 64 countries.
Lots of good ones and lots of bads ones too.
Alan;
When I am telling you Sweden is doing allright you should also know we have one since long time(>20 years) expected crisis in our welfare-utility sector and basic infrastructures due to underinvestments and privatizations(inflation but also over-supply problem in school-sector). Taxes are as you probably know high here but personnel in schools, police and healthcare have been leaving due to low wages and bad working-conditions. Even justice have not enough personnel. At the same time immigration is putting severe pressure on those sectors incl housing. No one in the government understands that money is debt and that you can´t amortize money itself(law against budget-deficits). Inflation have been falling since 1991. We have had longer periods of deflation comparing to many EU-states. Sweden is the second poorest country i Europe when measured median wealth(ex. former Sovjetunion-states) according to Credit Suisse. Immigration/refugees is of cource one source which is creating social tensions. Population has grown 12% in just 13 years and is to continue at the same speed. A longer recession in Sweden could become a greater problem than people here really understands. Let´s hope the US and Asia continues to strengthen now. Swedish centralbank is, as always, trying to inflate income to match overvalued stocks and real-estate. Unfortunately government aggregate demand can only help when surpluses are at disposal. For 2018(election year) we are at least seeing stimulus.
Yes Alan, I would greatly appreciate your data concerning sectoral-balances. Super!
goadvent@gmail.com
Best wishes
Alan;
Trump´s tax-reform included a reduction of the corporate tax level from 35 to 21%. But has the Trump tax-holiday(14%?)on corporate offshore funds(2,4 Trillion) also passed the congress? If so the dollar is supposed to get a big boost. Dollar has now a monthly buy-signal(February piercing pattern) at the 200 EMA level at 90,56(Dxc1).