Today (June 3, 2026), the Australian Bureau of Statistics (ABS) released the latest - Australian…
Australian national accounts – growth well below trend continues
The – December-quarter 2014 National Accounts data – released by the Australian Bureau of Statistics today confirms that the Australian economy was stuck in a weak growth state in the last three months of 2014. Real GDP growth grew by by a miserable 0.5 per cent in the December-quarter 2014. The annual growth rate of 2.5 per cent is being held up by the strong March-quarter 2014 result (1.1 per cent growth), which was clearly atypical. An growth rate of around 2 per cent is a more reasonable estimate of where Australia began 2015. With fiscal austerity set to worsen this year, today’s date paints a fairly gloomy picture for the Australian economy for the remainder of this year. Now is not the time for fiscal retrenchment. The government needs to stimulate the economy to boost income and employment growth and not squeeze households and lead them into more debt.
The main features of the National Accounts release for the December-quarter 2014 were (seasonally adjusted):
- Real GDP increased by 0.4 per cent after recording a 0.3 per cent increase in the September-quarter.
- The main positive contributors to expenditure were Net exports (0.7 percentage points) and Final consumption expenditure (06 percentage points).
- The main negative factors were the decline in Inventories (-0.6 percentage points).
- Our Terms of Trade (seasonally adjusted) fell by 1.7 per cent in the quarter and over the last 12 months they have fallen by a substantial 10.8 per cent. So, the hoped for second-phase of the Mining boom after the initial building of infrastructure is not happening – export volumes are barely up but prices are well down. The net export boost to growth has largely come from the declining imports due to the slow national income growth.
- Real net national disposable income, which is a broader measure of change in national economic well-being rose by 0.4 per cent for the quarter and by 0.5 per cent for the 12 months to the December-quarter 2014, which means that Australians are barely better off (on average than in 2013).
Overall growth picture – now very subdued
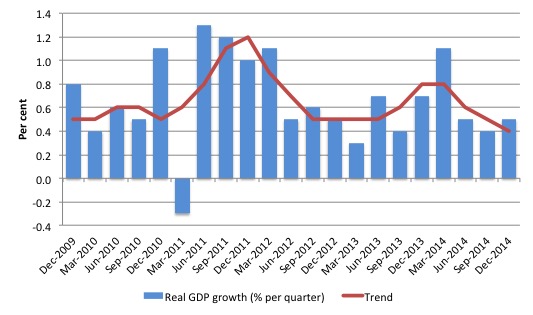
The following graph shows the quarterly percentage growth in real GDP over the last five years to the December-quarter 2014 (blue columns) and the ABS trend series (red line) superimposed. After the decline in trend growth was arrested by the fiscal stimulus in 2008-09 the decline in government support saw the dip in trend growth in 2010.
Initially, the growth in private investment associated with the record terms of trade and the resulting mining boom helped drive the new rise in trend growth and that appears to have ended towards the end of 2013, notwithstanding the strong net exports in the March-quarter 2014.
The mining boom was thought to be in two stages. First, the investment boom as new productive infrastructure was being constructed (railways, ports, loaders, new sites etc). Second, the export boom that would result from the enlarged productive capacity. The second stage relied on continued growth in China to boost volumes and the prices remaining stable (at elevated levels).
The problem is that China is now slowing a little but more troubling for the economy as a whole is that there is now a serious glut of mineral exports to China (iron ore etc) and the excess supply is driving prices down significantly.
Australia’s terms of trade have fallen sharply (10.8 per cent) in the last year.
Further, while the fiscal austerity built into the May 2014 Budget Statement is being moderated by the hostile Senate, which has rejected many of the proposed cutbacks, the fact is that there is now some significant drag coming from the public cutbacks as evidenced by the negative contribution of public capital formation (see below).
Contributions to growth
What components of expenditure added to and subtracted from real GDP growth in the December-quarter 2014?
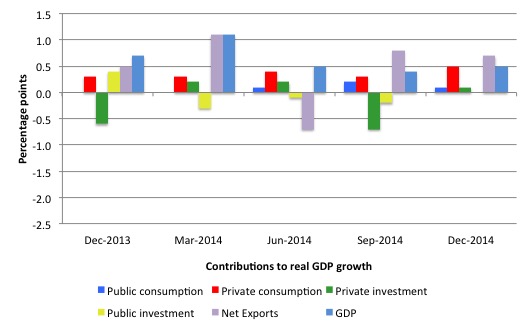
The following bar graph shows the contributions to real GDP growth (in percentage points) for the main expenditure categories. It compares the December-quarter 2014 contributions (grey bars) with the September-quarter 2014 (blue bars).
The strongest contributor to growth in the December-quarter 2014 was net exports. But caution is needed in interpreting this result.
The contribution to growth in the December-quarter (0.7 percentage points) is the combination of a rise in real exports (contributing 0.2 percentage points) in the December-quarter 2014 and a decline in imports (contributing 0.5 percentage points). The latter impact reflects the declining growth rate overall driven largely by declining private investment growth.
The overall contribution of private investment on growth was barely positive (0.1 percentage points), which confirms that the investment cycle associated with the mining boom is over.
Public investment provided no boost to growth in the December-quarter 2014. There was a modest growth contribution from public consumption spending (0.1 points).
Thus the overall contribution of the government to growth is barely supporting growth (0.1 percentage points).
The contribution of Private consumption in the December-quarter was 0.5 percentage points.
The overall assessment is that the Australian economy is now growing well below trend and with terms of trade expected to fall further and the fiscal position expected to become tighter, the outlook is for weaker growth still.
This is especially so given the contributions from private domestic expenditure are very modest indeed as households maintain their cautious approach and the relatively high saving ratio and investment flattens out and the increasing fiscal drag coming from the public sector.

The next graph shows the contributions to real GDP growth of the major expenditure aggregates since December-quarter 2013 (in percentage points). The total real GDP growth (in per cent) is also included as a reference.
Real GDP growth positive but real net national disposable income negative
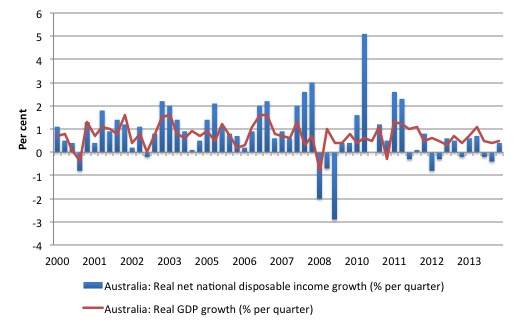
While real GDP growth (that is, total output produced in volume terms) remains positive albeit declining, real net national disposable income growth has been criss-crossing the zero line for the last three or so years.
It was negative in the previous two quarters, which prompted commentators to declare Australia in a national income recession.
In the December-quarter 2014, it was barely positive.
The following graph shows the evolution of the quarterly growth rates for the two series since the March-quarter 2000.
The ABS tell us that:
A broader measure of change in national economic well-being is Real net national disposable income. This measure adjusts the volume measure of GDP for the Terms of trade effect, Real net incomes from overseas and Consumption of fixed capital.
This subdued state is the result of the slower real GDP growth and the declining export prices manifesting in the significant decline over the last 12 months in Australia’s terms of trade.
In other words, we are exporting volume but getting less for it, which means our capacity (in real terms) to purchase imports has declined per unit of export.
It means that Australians overall are poorer even though we are still producing more than 6 months ago and exporting increasing volumes of real goods and services to the rest of the world.
This discrepancy is one reason why an export-led growth strategy will not necessarily increase the standard of living of domestic residents, even if it exports grow.
Household saving ratio falls to 9 per cent
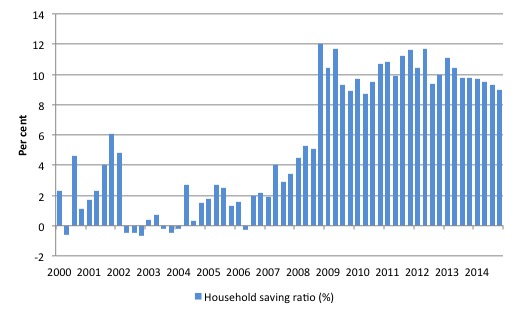
The following graph shows the household saving ratio (% of disposable income) from 2000 to the current period. The household sector is now behaving very differently since the GFC rendered its balance sheet very precarious.
Prior to the crisis, households maintained very robust spending (including housing) by accumulating record levels of debt. As the crisis hit, it was only because the central bank reduced interest rates quickly, that there were not mass bankruptcies.
The household saving ratio was 9 per cent of disposable household income in the December-quarter 2014 and down from the 9.3 per cent in the previous quarter.
It is now steadily falling, which suggests that household consumption is maintaining its growth by a reduction in saving and a rise in credit access – both worrying trends.
While the recent trend is downwards, as the slowing growth squeezes real incomes, it is unlikely that households will return to the very low and negative saving ratios at the height of the credit binge given that the household sector is now carrying record levels of debt.
This also means that government surpluses which were associated with the credit binge, and only were made possible by the unsustainable credit binge are untenable in this new (old) climate. The Government needs to learn about these macroeconomic connections. It will learn the hard way once net exports weakens.
Real GDP growth and hours worked
One of the puzzles over the last several years or so has been the sharp dislocation between what is happening in the labour market and what the National Accounts data has been telling us.
Employment growth and hours worked has been virtually flat over the period while annual real GDP growth has been around 2 to 2.5 per cent.
Today’s data shows that real GDP growth has remained subdued on the back of lower productivity growth and increased hours of work.
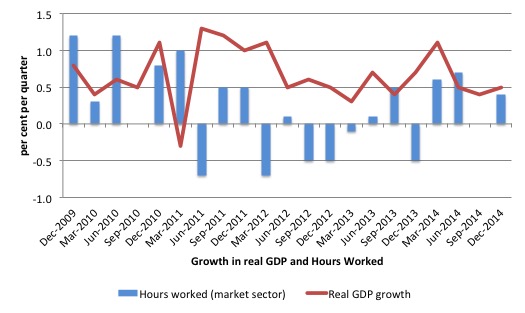
The following graph presents quarterly growth rates in trend GDP and hours worked using the National Accounts data for the last five years to the December-quarter 2014.
You can see the major dislocation between the two measures that appeared in the middle of 2011 persisted throughout 2013 but is less evident now.
Just in case you think the labour force data is suspect, the hours worked computed from that data is very similar to that computed from the National Accounts.
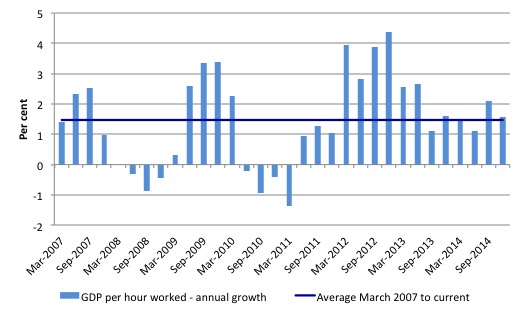
To see the above graph from a different perspective, the next graph shows the annual growth in GDP per hour worked (so a measure of labour productivity) from the March-quarter 2007 quarter to the December-quarter 2014. The horizontal blue line is the average annual growth since March-quarter 2007.
The relatively strong growth in labour productivity in 2012 and the mostly above average growth in 2013 and 2014 helps explain why employment growth has been lagging given the real GDP growth. Growth in labour productivity means that for each output level less labour is required.
In the December-quarter 2104, annualised labour productivity growth was 1.6 per cent (around the recent average). With labour force growth around 1.4 per cent, real GDP has to growth by at least 3 per cent before the unemployment rate will start to fall.
The modest growth reported in the December-quarter 2014, helps to explain why unemployment has been rising. Unless there is a major upwards shift in the growth trajectory, unemployment will continue to rise over the next several months.
Wage share declines in the December-quarter 2014
The wage share in national income fell in the December-quarter by 0.1 percentage points to 53.3 per cent. The profit share rose by the same percentage amount.
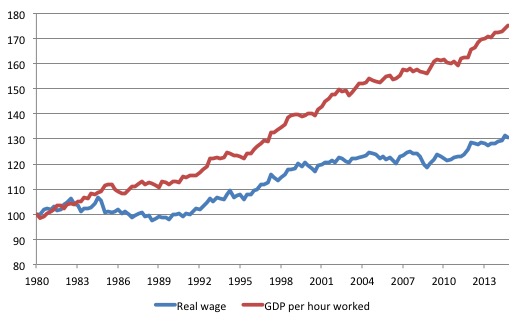
The following graph shows the movement in GDP per hour worked and the Average Real Wage per worker in index number form from December-quarter 1980 to the current quarter.
Productivity growth was 1.6 per cent over the 12 months to December 2014, whereas real wages grew by 1.8 per cent, which means that the wage share rose slightly over the year.
However, in the December-quarter 2014, real wages fell by 0.5 per cent, while productivity growth was 0.6 per cent, hence the wage share fell in that quarter.
But the trend in the wage share has clear been for the gap to widen, which indicates that capital (profits) have been gaining an increasing share of real GDP (national income) at the expense of the workers. Similar trends have been reported in other advanced OECD nations.
While neo-liberal commentators claim this is due to globalisation, the reality is that it has been driven by attacks on trade unions, increased casualisation and persistently high unemployment and underemployment. These factors have combined to make it difficult for workers to gain real wages growth. Globalisation is only one part of the story.
The next graph shows the outcomes in terms of movements in the wage share in national income (%) and the profit share (%) from the December-quarter 1959 to the current quarter.
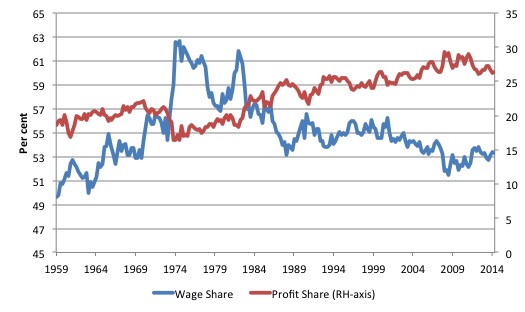
As I have noted in the past, the deregulation in the labour markets not only increased job instability and created persistently high unemployment, but also led to large shifts in national income from wages to profits. Similar trends have been reported in other advanced OECD nations.
First, in most nations, the wage share in national income has fallen significantly over the past 35 years. Second, in the Anglo nations, ‘a sharp polarisation of personal income distribution has occurred’, with the top percentile and decile of the personal income distribution substantially increasing their total shares. The excessive executive pay deals that emerged in this period were one manifestation of the munificence gained at the expense of lower income workers.
Until the early 1980s, real wages and labour productivity typically moved together. However, as the attacks on the capacity of workers to secure wage increases intensified, a gap between wages and productivity opened and widened. This widening gap manifested as a rising profit share: in 1975, the Australian wage share was around 62.5 per cent of national income to be distributed to the factors of production. In the current-quarter it was around 53.4 per cent.
Australian governments aided this redistribution in a number of ways, through privatisation, outsourcing, harsh industrial relations legislation aimed at reducing union power, National Competition Policy and so on.
These movements in national income shares are also tied into the financial crisis. Imbued with the now-discredited ‘efficient markets’ hypothesis promoted by the University of Chicago economists, policy makers bowed to pressures from the financial sector.
They introduced widespread financial deregulation and reduced their oversight of the banking sector. This led to a massive expansion of the financial sector, and also set the stage for the transformation of banks from safe deposit havens to global speculators carrying increasing (and ultimately unknown) risks. The massive redistribution of the balance between national income and profits provided the banks and hedge funds with the gambling chips to fuel the rapid expansion of the ‘global financial casino’.
The capitalist dilemma was that real wages typically had to grow in line with productivity, to ensure that the goods produced were sold. So how does economic growth sustain itself when labour productivity growth outstrips the growth in the real wage? This was particularly significant in the context of the increasing fiscal drag coming from public surpluses, which squeezed private purchasing power in many nations during the 1990s and beyond.
The neo-liberal period found a new way to solve the dilemma. The ‘solution’ was so-called ‘financial engineering’, which pushed ever-increasing debt onto households and firms. The credit expansion sustained the workers’ purchasing power, but also delivered an interest bonus to capital, while real wages growth continued to be suppressed. Households, in particular, were enticed by lower interest rates and the vehement marketing strategies of the financial engineers. It seemed too good to be true and it was.
The result was that Australian households now hold record levels of debt. The debt to disposable income ratio stood at 70.3 per cent in March 1996; by the September-quarter 2014, it had risen to a staggering 152.8 per cent.
Governments, their central banks and so-called financial industry experts played down any sense of alarm during the pre-crisis period, claiming that wealth was growing along with the debt. When the debt bubble burst, significant proportions of the ‘wealth’ vanished, leaving many borrowers with massive debts but few assets.
To restore a sustainable growth footing, there has to be a dramatic shift in the distribution of national income – towards workers. Real wages have to grow more or less in line with productivity, which will require legislative changes and higher government spending to reduce unemployment so there is more pressure on firms to pass on the productivity gains.
Conclusion
Today’s National Accounts data indicates that economic growth remained well below trend in the last three months of 2014, which explains why unemployment has been rising over the last 12 months
The main contributor, net exports was dominated by a decline in imports, which reflects the poor domestic income growth rates. There is no export boom going on to complement the previous strong investment associated with the mining boom.
The government sector is barely contributing to growth which means they are deliberately contributing to the rise in unemployment.
With demand fairly flat there is little incentive for private firms to increase the investment ratio. Private investment is extremely subdued at present.
Remember that the National Accounts tells us what was happening in 3-6 months ago. The most recent evidence is mixed but we know that export prices continue to fall and China continues to slow. Both of those facts would suggest that today’s data is a reasonable projection of the future.
That is enough for today!
(c) Copyright 2015 Bill Mitchell. All Rights Reserved.
I think everyone would agree that the Aussie economy needs some stimulation. Neo-liberals are, of course, thinking more in terms of reducing interest rates, but they are concerned about the effect on house prices so they are holding back – for now.
It only seems to be a matter of time, though, before Aussie interest rates become so low that they can’t go any lower. Like the USA and UK.
According to MMT that’s a good thing. So, should we be arguing for a fiscal stimulus or for that reduction in interest rates? Or maybe a combination of both?
Low interest rates and a high immigration rate are keeping the housing bubble inflated. All the better for the rentier class.
But all bubbles burst and always with disastrous consequences but not necessarily for those responsible for their creation and maintenance.
And so we lurch from one crisis to the next with ever shorter intervals between. Could it be that we are approaching the Limits To Growth?
One wouldn’t think so if one was silly enough to believe the prognostications of most of the experts aka economists.
“The main contributor, net exports was dominated by a decline in imports”
If there is constant decline in imports across the world, then who is providing the demand that is leading to the export surpluses?
Is it all the USA?
“before Aussie interest rates become so low that they can’t go any lower”
They can always go lower. The new keynesians have convinced themselves now that interest rates can go very negative and are merrily pursuing that policy.
If things recover they will of course be convinced the recovery is due to their astute management of the economy rather than the simple effluxion of time.
effluxion of time isn’t “simple” Neil, its profound – it’s during that period that economies re-structure and adapt; determining whether a nation’s GDP grows and prospers or shrinks and declines.
Irrespective of fiscal expansion or contraction which can be pursued ad nauseam, it is the ingenuity of an economy’s people that determines its future place in the world.
“effluxion of time isn’t “simple” Neil, its profound – it’s during that period that economies re-structure and adapt”
What does that mean? I’ve been hearing that since high school. Australia needs structural adjustments, Australia needs to be more competitve, Australia needs to “fix” its twin deficit.
Of course the wealth of nations is determined by its people. Fiscal expansion allows that to happen by putting purchasing power in their hands, fiscal contraction does not.
You know the difference between pseudo science and real science? Real science defines their terms and digs down to the granular level. Pseudo science uses vague terms which can be adjusted on the fly to mean anything.
Neil,
UK interest rates are at 0.5% so, yes they could fall to 0.25% or even 0% but that would mean it would make sense to keep money in a safe rather than putting it in the bank. Even at 0.5% many bank accounts don’t pay any interest. Negative interest rates would be a real challenge for most savers! I can’t see that being accepted.
UK interest rates have steadily fallen since they reached 17% under the Thatcher government. Reductions from that high level have been the main economic tool for stimulating the economy. Surely that ‘monetarist’ approach has reached the end of the line now and all Governments will have to switch to fiscal policy instead. They may not like it, and will no doubt fiddle about with more QE, but what’s the alternative?
Gogs,
“it is the ingenuity of an economy’s people that determines its future place in the world.”
This is a very reactionary argument. Even racist. It would imply that economies are successful because the people in that economy are special and therefore successful, rather than the people are successful, at least in part because the economy is successful. Is there something special about particular nationalities?
If young people leave school, that is if they have had any schooling, with no hope of finding a job, and therefore have no hope of acquiring any money or necessary experience in the workplace to perhaps start their own business, what chance have they of ever being successful or to pass their knowledge along to others?
There has to be a co-incidence of opportunity, and ability, for that “future place in the world” to happen. We see this all the time in Australia. People often arrive with no money and little previous experience of paid employment. But, because their opportunities here are better they’ll be able to use their skills and abilities in ways they never could in their home countries.
Time encapsulates the process by which ingenuity is converted into success; that’s all the reference was meant to convey. It just happens to be what all governments aspire to.
Racism is not a subject I pursue. I leave that to other people’s imagination.
petermartin2001,
If your comments were intended to strike a piercing blow, they succeeded.
An economy covers a very wide range of activities; one that I am involved in is the National Health Service (NHS). Some of my multi-cultural colleagues have, like your example, arrived from poorer areas and are both benefitting from increased opportunities; and exploiting their ingenuity to help the country prosper.
They are nevertheless making this contribution from inside a non-profit organisation. There was no suggestion in my earlier reference to solely capitalistic rewards. And certainly any reference you make to racism is at variance with my experience. Ingenuity is a universal attribute which I openly applaud and encourage.
Cogs,
If I’ve misunderstood your remarks then I apologise. Maybe you were just making the point that its people who create the wealth not the economy itself. But just to take your full quote:
“Irrespective of fiscal expansion or contraction which can be pursued ad nauseam, it is the ingenuity of an economy’s people that determines its future place in the world.”
I’d just make the point that this is what the Germans are saying about the Greeks. They are saying to them stop calling for fiscal expansion and instead do what we do. Be ingenious like us. Work harder like us. Pay your taxes like us. The implication is very much that they succeed because they are a superior race. After all if they can succeed using the Euro why can’t everyone else?