Over the last several years, I have been indicating that I think we are in…
“There is plenty of stimulus” – but I am struggling to see it
“The economy is not weak enough that there needs to be more fiscal stimulus … there’s plenty of stimulus from the Reserve bank with record low interest rates” (Source). That comment came from an Australian private sector investment bank economist. It is an extraordinary comment to make and still claim status as a professional economist. What is the measure of a weak economy? Rising unemployment and underemployment, now well above 15 per cent? Negative real net national disposable income for two consecutive quarters? Real GDP growth barely a 1/3 of it previous trend rate? Because that is the reality in Australia right now and it is getting worse. Further, the RBA has cut the short-term interest rate 14 times since October 2011 and has held the rate at 2.5 per cent (a record low) since September 2013. The unemployment rate has risen by 1.1 per cent since October 2011 and 0.5 per cent since September 2013. When will these clowns in the financial markets finally realise that monetary policy is an ineffective tool for increasing aggregate demand?
The bank economists are now claiming that the National Accounts estimates of very weak growth are wrong and the economy is actually growing faster than the estimates.
They are fixated on their belief that the record low interest rates must stimulate aggregate spending and therefore economic growth.
The reality is something quite different.
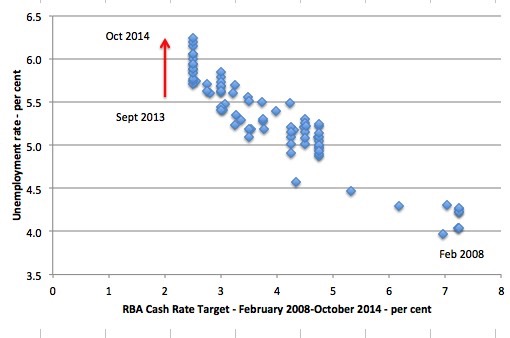
Here is a graph showing the RBA cash rate target on the horizontal axis since February 1978 (the high point of the last cycle) and October 2104. The monthly interest data is available from the RBA – Interest Rates and Yields – Money Market – Monthly – F1.1.
The vertical axis depicts the national unemployment.
While I am fully aware that ‘eye-balling’ cross plots does not tell you much about bi-directional causality, given the multitude of offsetting and other factors that might be at play, they give you a pretty good ‘fool’s test’. If monetary policy was so effective then why has unemployment risen at a time of extended record low interest rates?
Where is this “plenty of stimulus” that the bank economist waxes lyrical about.
An economy that is in stimulus mode doesn’t observe a systematic rise in unemployment while participation rates are falling.
A growing economy might experience a rise in unemployment if the participation rate rises as job opportunities increase. Then the labour force growth rate can outstrip the employment growth rate and you get a temporary rise in the unemployment rate until the participation rate adjusts. Then you see systematic falls in the unemployment rate as the stronger employment growth eats into the idle labour pool.
Exactly the opposite is happening in Australia. Employment growth has been bobbing around zero for more than two years now as non-government spending weakens and government austerity starts to bite.
I repeat: where is the “plenty of stimulus”? That claim is pure nonsense.
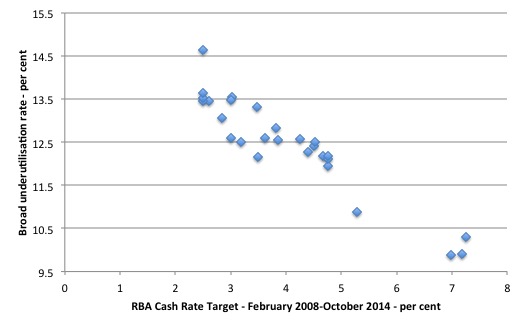
The second graph shows the relationship between the cash rate target and the Broad measure of labour underutilisation provided by the ABS, which is the sum of the official unemployment rate and the underemployment rate (part-time workers who desire more hours of work but because the labour market is weak cannot find the extra hours).
It is the same message.
Both unemployment and underemployment have risen over the period of record low interest rates. If we also consider the drop in labour force participation rates over the same period then the situation is worse.
The main types of expenditure that are conjectured to be sensitive to interest rate movements are spending on consumer durables, investment in dwellings and invest
Household expenditure on furnishings and household equipment has grown on average 1.3 per cent per quarter over the last year, while spending growth on motor vehicles has been zero on average.
Over the year to September-quarter 2014, private gross fixed capital formation was down 2.8 per cent (dwellings investment up but non-dwelling construction and machinery and equipment down).
It is hard to argue the case that overall non-government spending is highly responsive to low interest rates. If that was true, Japan should have been booming, the Eurozone should have been booming and the US should have been booming.
The reality is that the central bank can lower interest rates, but consumers will not borrow and firms will not invest if there is a risk of rising unemployment and flat sales. Both conditions apply to Australia at present.
Another denial piece came out today from the Fairfax economics commentator Ross Gittins – Economy: Not good but not disastrous.
He concludes that:
It’s not clear the economy has slowed to the snail’s pace a literal reading of the latest national accounts suggests. As for the talk of a “technical income recession”, it’s just silly.
But if we’ve learnt anything by now, it’s that it’s folly to take the quarterly national accounts too literally.
The data shows that for the middle 6 months of this year, Australian production has progressively slowed but the real net national disposable income that we derive from that production has fallen throughout that six month period.
The reason? Our terms of trade have significantly fallen over the last year – by 8.9 per cent. I don’t think that information is very inaccurate. It is confirmed by other data series.
There is nothing “silly” about pointing out that a declining growth rate accompanied by a nation that is losing real income has been evident for 6 months.
If a nation is becoming poorer, isn’t that a reflection of failed economic policy, especially when the announced policy strategy of the Federal government is to cut its own net spending, which it knows in the current climate will further damage growth?
Gittins also thinks that because the estimates were below what was “expected” then the published data for the September quarter must be wrong (and underestimating growth by at least 1 per cent per annum.
I don’t buy that line at all. Who formed these expectations? The bank economists? Their forecasts are almost always considerably wrong. Reflect back on the opening conclusion. They think that because interest rates are low, growth must be higher than it is. So just because the actual estimates tricked them is no reason to distrust the estimates.
The official forecasts also have a poor record.
Gittins also bases his claim on the fact that:
The initial estimate for growth in any quarter will be revised – up and down – up to a dozen times before the bureau is satisfied it has got it pretty right.
It is true that the national accounts data is revised up and down as more complete information comes in to the ABS (or any central statistical agency).
In actual fact, if you consult the revisions table of the National Accounts publication (Table 46) – EXPENDITURE ON GDP, Chain volume measures(a)-Revisions to percentage changes(b) – you will see that the revisions have all been in a downward direction for the last 6 quarters (with no change for two quarters).
It is also true that they provide a rear-mirror view of where the economy has been rather than where it is now, given the data is published three months after it ‘happened’.
So one has to construct the narrative of what the historical data (3 months ago) might mean for where the economy is heading and where it might be today. If the estimates of growth were so wrong for the September quarter (which is the implication of Gittins claim) then more recent data should be indicating that.
It doesn’t. Take the monthly labour force data. As noted above, the unemployment rate has been systematically rising over the last year or so, as has underemployment, and the participation is well below the most recent peak in November 2010.
As I show in my last labour force analysis – Australia Labour Force – weak and no signs of improvement – when we factor in the plunge in participation rates as the employment growth rate came to a stop – the
Notwithstanding the decline in participation (and the rise in hidden unemployment – probably more than 2 per cent extra) – there are now at least 1,050.1 thousand persons underemployed. Overall, there are 1.822.2 million workers either unemployed or underemployed. That means the broad labour underutilisation rate is at 14.5 per cent and rising.
If hidden unemployment is added to the broad ABS figure the best-case (conservative) scenario would see a underutilisation rate well above 17 per cent at present.
However, the unemployment rate would have been 8 per cent in October 2014 rather than the official estimate of 6.2 per cent if the participation had not fallen below its November 2010 peak of 65.9 per cent.
These indicators are rising rather than showing signs of improvement. It is true they are lagging indicators – which means they do not fall first in a recovery. But that doesn’t alter the fact that the economy is weak and getting weaker.
Here is a rule of thumb that you can use to make some of your own estimates of what is likely to happen in the coming year.
The trend rate of real GDP growth doesn’t relate to the labour market in any direct way. The late Arthur Okun is famous (among other things) for estimating the relationship that links the percentage deviation in real GDP growth from potential to the percentage change in the unemployment rate – the so-called Okun’s Law.
The algebra underlying this law can be manipulated to estimate the evolution of the unemployment rate based on real output forecasts.
From Okun, we can relate the major output and labour-force aggregates to form expectations about changes in the aggregate unemployment rate based on output growth rates. A series of accounting identities underpins Okun’s Law and helps us, in part, to understand why unemployment rates have risen.
Take the following output accounting statement:
(1) Y = LP*(1-UR)LH
where Y is real GDP, LP is labour productivity in persons (that is, real output per unit of labour), H is the average number of hours worked per period, UR is the aggregate unemployment rate, and L is the labour-force. So (1-UR) is the employment rate, by definition.
Equation (1) just tells us the obvious – that total output produced in a period is equal to total labour input [(1-UR)LH] times the amount of output each unit of labour input produces (LP).
Using some simple calculus you can convert Equation (1) into an approximate dynamic equation expressing percentage growth rates, which in turn, provides a simple benchmark to estimate, for given labour-force and labour productivity growth rates, the increase in output required to achieve a desired unemployment rate.
Accordingly, with small letters indicating percentage growth rates and assuming that the average number of hours worked per period is more or less constant, we get:
(2) y = lp + (1 – ur) + lf
Re-arranging Equation (2) to express it in a way that allows us to achieve our aim (re-arranging just means taking and adding things to both sides of the equation):
(3) ur = 1 + lp + lf – y
Equation (3) provides the approximate rule of thumb – if the unemployment rate is to remain constant, the rate of real output growth must equal the rate of growth in the labour-force plus the growth rate in labour productivity.
It is an approximate relationship because cyclical movements in labour productivity (changes in hoarding) and the labour-force participation rates can modify the relationships in the short-run. But it provides reasonable estimates of what happens when real output changes.
The sum of labour force and productivity growth rates is referred to as the required real GDP growth rate – required to keep the unemployment rate constant.
Remember that labour productivity growth (real GDP per person employed) reduces the need for labour for a given real GDP growth rate while labour force growth adds workers that have to be accommodated for by the real GDP growth (for a given productivity growth rate).
So in the example, the required real GDP growth rate is 3.5 per cent per annum and if policy only aspires to keep real GDP growth at its trend growth rate of 3 per cent annum, then the output gap that emerges is 0.5 per cent per annum.
The unemployment rate will rise by this much (give or take) and reflects the fact that real output growth is not strong enough to both absorb the new entrants into the labour market and offset the employment losses arising from labour productivity growth.
Labour force growth has averaged around 1.6 per cent per annum since February 2009 – the period after the last cycle peaked. That is a bit lower than the average in the period before the crisis but with growth subdued I don’t expect the participation rate to rise any time soon in any substantial way.
Last week, the – National Accounts release – estimated that “Market sector Gross value added (GVA) per hour worked (in trend terms) rose … 1.9% through the year” to September 2014.
Taken together, it means that real GDP growth has to be at least 3.5 per cent per annum for the unemployment rate to remain constant.
Given that the current annualised real GDP growth rate is 2.7 per cent (September 2013 to September 2014), we would expect the unemployment rate to have risen around 0.8 per cent or so (given that variations in hours interferes with any exact interpretation of this rule of thumb).
In fact, the unemployment rose from 5.7 per cent in September 2013 to 6.2 per cent in September 2014. Closer scrutiny shows the labour force growth between September 2013 and 2014 was only 1.3 per cent on average. Which combined with the productivity growth of around 1.9 per cent gives a required real GDP growth rate of 3.2 per cent.
The rule of thumb is therefore pretty reasonable. Required rate (3.2) – actual rate (2.7) = 0.5 per cent = the actual rise in the unemployment rate.
But being a rule of thumb it really should only be used for understanding tendencies and the rough magnitude of those tendencies.
If we annualise the last two quarters of real GDP growth, then we would get a annual growth rate of Should the current national accounts estimates remain poor, we would see an annual growth rate of 1.6 per cent.
If that reflects the true direction of the national economy, then we would expect the unemployment rate over the next year to rise by around 2.8 per cent or in that ball park given the current medium-term average annual labour force growth and the current estimates of labour productivity growth.
We will have to wait and see.
As Ross Gittins says:
The way we’ll be able to tell whether the economy really has slowed to a crawl is by watching the rate at which unemployment rises in coming months. At the 2.5 per cent a year speed, it’s worsening at a rate averaging 0.1 percentage points a quarter. If that average rises, we’ll know things are much worse than they were.
I think Gittins has underestimated the sum of the labour force and productivity growth rates by around 0.3 per cent per annum in total.
But I agree with his conclusions that if the unemployment rate starts to accelerate then “things are much worse than they were”.
But equally, a rate of growth of 2.5 per cent will still see the unemployment rate rise to around 7 to 7.5 per cent by the end of 2015, which in itself is disastrous, given it means the underemployment rate and the hidden unemployment rate will also be rising.
Conclusion
Even if Gittins is right and the economy is growing at 2.5 per cent (rather than much slower as depicted by last week’s national accounts estimates), it signifies a massive policy failure.
Given the record low interest rates, it also justifies the conclusion that monetary policy is an ineffective tool.
The swings in the unemployment rate in recent years (since the crisis) have been driven by shifts in fiscal policy. When the government was in stimulus mode, the unemployment rate fell quickly, and then the opposite has been the case since 2012.
That is enough for today!
(c) Copyright 2014 Bill Mitchell. All Rights Reserved.
There are lies,damned lies and then there is economics.
Bank economists never seem to understand that liquidity (meaning the conjunction of accessible and spendable money plus other high quality liquid assets) necessarily increases whenever a central government engages in deficit spending, while on the other hand an expansionary monetary policy is primarily concerned with buying one financial asset (Treasury securities) and replacing it with another financial asset (reserves and credit money) in an attempt to exert downward pressure on interest rates. And that for at least this reason, fiscal expansion will always be far superior to monetary expansion (if indeed the latter works at all) as a mechanism for increasing aggregate demand.
Bill,
I agree that “monetary policy is an ineffective tool for increasing aggregate demand”. However I’m not too thrilled by what might be called “pure fiscal policy” either: by that I mean having government borrow and spend. My preferred option is a combination of the two, i.e. have government print money and spend it, and/or cut taxes.
Keynes favored that, as does Adair Turner, Simon Jenkins, Positive Money and others. How about an article on that subject?
Ralph have you ever studied economics and if so did you keep the receipt because I think we may just have grounds for getting you a refund.
Well I am most certainly confused.
If the treasury must have its reserve balance in the black at the end of each day like the banks do, does that literally mean the government has to issue and sell bonds BEFORE spending if they lack the funds in their reserve account to do so?
I feel this is a huge piece of the puzzle which is missing (at least from my own understanding), and I cannot find a single place on the internet which addresses it.
From a social credit perspective this full employment thingie is complete nonsense.
The Irish example proves this.
The real unemployment rate in Ireland up to the 1950s was perhaps north of 1 million.
The Marxists maintain women were made free by work during the 60s & 70s but this is not the case.
Ireland before that time had little to no access to capital.
Agrarianism was the only option as all capital was centered in London and its mini me Dublin.:-)
The 1960s came late to Ireland in the 1970s
On condition people accepted the rules of capitalism within the satanic mill they were given pointless work to overproduce goods.
Bill clearly represents the gross and destructive dynamics of super capitalism.
A materialist nightmare world of massive and pointless overproduction.
He does not give people the option of freedom but forces people to worship in another church.
Please let us not mix up cause and effect.
In a industrial setting purchasing power is everything.
It is clear that employment for employment sake is reducing capital for real end use consumption.
The UK entering close to full employment with reducing wages is a classic example of this.
Imagine how much resources are burned on the daily commute to jobs which have no purpose then to provide cash flow for banks who can then lend on the strength of this cash flow.
Bill is caught within a classic Anglo entropy loop.
Who cares about national accounts ?????
Its people that matter.
Give me 10 acres of rock and bog on the western seaboard.
A 200 unit a week ration of tokens and I can do so much more then within the confines of a satanic mill overproducing goods that the state subsequently socializes on the masses via the various methods of tax / inflation / extraction via the control of natural utilities…
@Jeff,
I think it does. The Treasury looks to the future to anticipate the money they will spend, and the tax receipts they will receive. If the accumulated disbursements and receipts result in a deficit, their balacne in their account at the FR will decline. If the predictions show that the account will drop below a safe threshold, then the Treasury will issue bonds to the non-government sector, and take in cash. The Treasury will add the cash to their account.
If laws permitted, the Treasury could simply wait until their account is below zero before they issue bonds, and instead run a negative balance. Since the Federal Reserve can create money at will, there is no operational issue if they choose to do so, because all these transactions that I described are simply electronic accounting transactions. They are simply changing entries on an electronic ledger. And if you can create money at will, of what relevance does it matter if you run a positive or negative account balance?
Hope this helped. A fascinating topic.
Joel
Jeff, it is my understanding (like Joel S’s) that, yes, if the balance of the Treasury account (and other sources such as T&L accounts in the US) were insufficient for the amount of spending planned, and this occurred in a country where the Treasury is prohibited from borrowing directly from the central bank (CB), then the Treasury would need to issue securities prior to spending. But consider what would need to happen first, before the Treasury auction could take place.
The CB would need to anticipate the effect of the Treasury auction on reserve balances and take steps to ensure that any depletion of reserve accounts as a result of primary dealers purchasing newly issued treasuries would not cause the short-term interest rate to deviate dramatically from its target level.
So, the first step, before the Treasury issued treasuries, and before primary dealers purchased the treasuries, would be for the CB to do a reserve add. The CB would purchase second-hand treasuries from the primary dealers (PDs) on condition that the PDs undertook to buy them back later. The CB would pay by adding to the reserve accounts of the PDs’ banks and directing the banks to credit the PDs’ accounts. In other words, the first step is for the CB to create government money in the form of reserves.
If the procedures are analyzed in terms of the consolidated government sector (including both Treasury and monetary authority), then it follows that government creates the money necessary to spend prior to issuing debt, since the initial reserve add necessary to maintain the target rate of interest will be closely related to the extent of the debt issuance.
Notice, also, that the initial step in which the CB purchases second-hand treasuries from PDs is only possible if treasuries have previously been issued by the Treasury. If they had never been issued before, PDs would be in no position to sell second-hand treasuries to the CB. If the Treasury were still prohibited (pointlessly) from borrowing directly from the CB, then the CB would have to add reserves to the reserve accounts of the PDs’ banks (create government money) as a loan by taking something else owned by PDs as collateral.
In the US case there are six basic steps in the process (see Wray, http://neweconomicperspectives.org/2011/12/mmp-blog-28-government-spending-with.html ).
It IS fascinating, but I am still not satisfied. If bond yields are low, and the government wants to deficit spend (which seems to be the norm now), how is it that a lack of willing bond buyers is never a roadblock to deficit spending? In reality we never see this situation occur, yet mainstream economics tells us this situation will drive bond yields up, but it never does (see Japan).
How is it that governments can
a) Deficit spend regardless of the market demand for bonds, and
b) Keep bond yields low
without letting their reserve balance fall below zero, or forcing the central bank to soak up the unpurchased bonds?
Mainstream economics provides no answer to this, and so far, despite the improved clarity of MMT, I haven’t yet seen how this set of common circumstances are achieved at an operational level.
Personally, I would have thought this to be the single most important matter to the MMT message, and yet it eludes us. Why?
To make it clearer, maybe I’ve just gone wrong somewhere. Can someone point out if any of these statements is not correct?
A) Governments must issue bonds if their reserve account balance would become negative (at least under current political arrangements)
B) Market demand does NOT determine Federal Treasury Bond yields
C) The Central bank can not, and does not purchase Treasury Bonds directly at point of creation.
D) Fiscal balance is NOT determined by market demand for federal treasury bonds.
How can this be?
Thanks Peterc, that’s MUCH better.
Dear Ralph (at 2014/12/08 at 23:32)
You must have been chasing ghosts – I have written several blogs about the topic – for example, https://billmitchell.org/blog/?p=26300. I devoted a whole chapter in my Euro book on the idea.
best wishes
bill
Poor Ralph has been rubbished for what he said but it seems to me that in general it could (mostly) be consistent with MMT depending on how you interpret it.
The idea of the government printing money and spending it seems to be to be what MMT recommends when a stimulus is needed, and the usual statement is that this is limited only by the danger of inflation. However, printing money here does not mean QE, i.e. the printed money is not used to buy back bonds. The idea expressed by Ralph that government borrowing is not good, or at least not necessary, I thought was what MMT said. I understand that it is agreed though that cutting taxes, as suggested by Ralph, is not such an effective way of providing stimulus.
It seems to me that the complicated accounting arrangement that the government has with the central bank is both a symptom and cause of the general confusion about government debt.
“The idea of the government printing money and spending it seems to be to be what MMT recommends when a stimulus is needed”
No. It’s the piss poor interpretation of MMT being regurgitated by the likes of Ralph Musgrave and oither non-economists in the blogosphere.
John Herman,
What you’ve described above is QE, in which I’m not telling you anything you don’t already know.
But it only “works” when the cash rate is at the lower bound, and where the central bank only needs to offer the institutions a few bips on their excess reserves to get the banks interested. Not applicable to Australia. Yet.
You probably know that too, but I just wanted to complete the picture.
What Bill’s talking about is a further lowering of the cash rate, that he alone out of 25 leading economists predicted in a poll earlier this year.
Alan Dunn,
Re your thick headed insult, if I’m an idiot for suggesting the “print and spend” option, then presumably others who suggest the same (Keynes, Adair Turner, MMTers (as pointed out by Tonyw above)) are also idiots. I’m sure everyone’s looking forward to Alan Dunn the genius demolishing the above mentioned twits.
Bill,
Sorry: didn’t know you’d written something on this topic.
Tonyw,
I quite agree: i.e. MMTers always SEEM TO advocate “print and spend” though they never seem to be very explicit about the point.
Listen lads , with the likes of draghi managing a inflation and smaghi calling for. Inflation – do you think you should question the objectives of the above ????
Inflation is a increase in costs.
It is not a good thing , inflation at 2 % without a increase in the amount of company chips has totally destroyed European society.
Once everyone has a reasonable income and debt contracts are made null and void deflation will increase the standard of living in a spectacular fashion.
Maybe just a little off topic but I’m still trying to understand this MMT stuff. From what I’ve gleaned from reading this blog is that the money supply should be expanded to the max until a certain inflation level is reached. OK I get that. However, doesn’t the current system employed by the RBA do that anyway ? As far as I know, the RBA is continually managing the size of the money supply to achieve a target band of 2 to 3% via interest rate settings. How does MMT differentiate itself from current practices ?
Thanks for the blog. Certainly different.
crocodile,
As I understand it, MMT sees employment (investing in absolutely every person who want to produce) as the economic goal, and inflation as the yardstick as to how successful that investment is. It is not about expanding the money supply per se, it is about getting all those who wish to work into some sort of valuable and fulfilling job.
If private investors are investing heavily in capital and not enough in labour, then we introduce massive costs onto society. Unemployment (particularly long-term) results in depression, skills erosion, loss of productive output, increased crime, increased welfare spending, decreased taxation, and I’m sure the list goes on. Democratic societies benefit greatly from having all of the available labour pool put to efficient use, and if private investment fails to provide adequate employment, it is MMT’s prescription that we as a society will find important tasks and set the involuntarily unemployed to work, and for reasonable compensation.
Banks create out of thin air money for deficit spending, not the Fed.
Once money is no longer backed by a commodity (gold) bank loans no longer have to be drawn from deposits to make the money lent legitimate. (Formerly banks could only lend legitimate money already in their possesion, their customer’s deposits backed by gold).
So deficit spending is not going to draw down the current money supply. It is going to increase it.
Since banks create money out of thin air (fiat money)
GDP(i+1) = GDP(i) +[X+G+I+ L] – [M+T+S+ P]
where terms are usual, while L is bank loans and P payback of loans, not normally considered in
formulas for GDP.
GDP here is equal to money in circulation.
Dear Stanley Mulaik (at 2016/10/12 at 10:45 am)
Your GDP equation is incorrect. GDP is the total flow of spending. L and P are not measures of spending flows.
Further GDP(i) is irrelevant to GDP(i+1) because flows exhaust in the period they are measured.
There are other issues but we will leave it at that.
best wishes
bill