I am travelling today to Tokyo and have little time to write here. But with…
Australian national accounts – growth plummets as policy fails
In September, I wrote of the 2nd-quarter national accounts data that the economy was weak and getting weaker. The – September-quarter 2014 data released by the Australian Bureau of Statistics today confirms that prognosis. Weak is an understatement. Real GDP growth grew by by a miserable 0.3 per cent a further drop on the 0.5 per cent in the June-quarter 2013. The annualised growth rate of 2.7 per cent is being held up by the strong in late 2013 but something around 1.2 to 1.8 per cent per annum looking forward is a more realistic assessment of where the economy is at present. Despite a substantial fall in the terms of trade, net exports contributed 0.8 percentage points to growth while consumption contributed 0.4 points. A major decline in private and public investment shaved off 0.7 percentage points. Fiscal austerity is set to worsen, which means that the data paints a fairly gloomy picture for the Australian economy for the next year at least.
The main features of the National Accounts release for the September-quarter 2014 were (seasonally adjusted):
- Real GDP increased by 0.3 per cent after recording a 0.5 per cent increase in the June-quarter.
- The main positive contributors to expenditure were Net exports (0.8 percentage points) and Final consumption expenditure (0.4 percentage points).
- The main negative factors were Private gross fixed capital formation (-0.5 percentage points) and Public gross fixed capital formation (-0.2 percentage points).
- Our Terms of Trade (seasonally adjusted) fell dramatically by 3.5 per cent in the quarter and over the last 12 months they have fallen by a substantial 8.9 per cent. So, the hoped for second-phase of the Mining boom after the initial building of infrastructure is not happening – export volumes are up but prices are well down.
- Real net national disposable income, which is a broader measure of change in national economic well-being fell by 0.3 per cent for the quarter but rose by 0.8 per cent for the 12 months to the September-quarter 2014, which means that Australians are better off (on average than in 2013) but that well-being is now being eroded.
Overall growth picture – now in decline
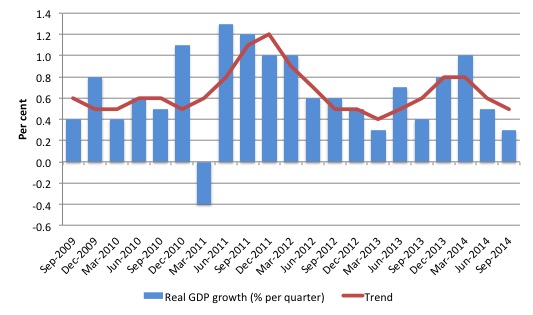
The following graph shows the quarterly percentage growth in real GDP over the last five years to the September-quarter 2014 (blue columns) and the ABS trend series (red line) superimposed. After the decline in trend growth was arrested by the fiscal stimulus in 2008-09 the decline in government support saw the dip in trend growth in 2010.
Initially, the growth in private investment associated with the record terms of trade and the resulting mining boom helped drive the new rise in trend growth and that appears to have ended towards the end of 2013, notwithstanding the strong net exports in the March-quarter 2014.
The mining boom was thought to be in two stages. First, the investment boom as new productive infrastructure was being constructed (railways, ports, loaders, new sites etc). Second, the export boom that would result from the enlarged productive capacity. The second stage relied on continued growth in China to boost volumes and the prices remaining stable (at elevated levels).
The problem is that China is now slowing a little but more troubling for the economy as a whole is that there is now a serious glut of mineral exports to China (iron ore etc) and the excess supply is driving prices down significantly.
Further, while the fiscal austerity built into the May 2014 Budget Statement is being moderated by the hostile Senate, which has rejected many of the proposed cutbacks, the fact is that there is now some significant drag coming from the public cutbacks as evidenced by the negative contribution of public capital formation (see below).
Contributions to growth
What components of expenditure added to and subtracted from real GDP growth in the September-quarter 2014?
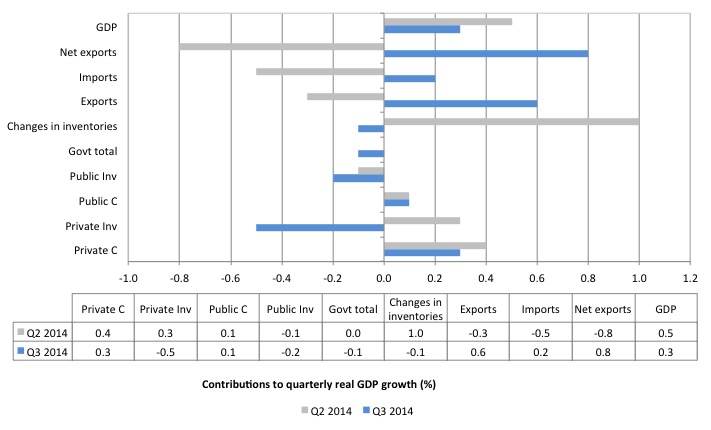
The following bar graph shows the contributions to real GDP growth (in percentage points) for the main expenditure categories. It compares the September-quarter 2014 contributions (blue bars) with the June-quarter 2014 (gray bars).
The staggering result is that the massive swing in the net exports. The contribution to growth in the September-quarter (0.8 percentage points) is the combination of a rise in real exports (2.8 per cent) in the September-quarter 2014 and a decline in imports (0.9 per cent). The latter impact reflects the declining growth rate overall driven largely by falling private investment.as the terms of trade have fallen sharply.
The overall contribution of private investment on growth was negative (-0.5 percentage points), which confirms that the investment cycle associated with the mining boom is over.
There was a further contraction in public investment, which continues to drag growth down (-0.2 percentage points). The small growth contribution from public consumption spending (0.1 points) was not sufficient to offset the decline in public capital formation.
Thus the overall contribution of the government to growth is negative (-0.1 percentage points) and fiscal austerity is thus damaging growth and helping to drive up unemployment.
The contribution of Private consumption declined in the September-quarter to 0.3 percentage points.
The overall assessment is that the Australian economy is now growing well below trend and with terms of trade expected to fall further and the fiscal position expected to become tighter, the outlook is for weaker growth still.
This is especially so given the contributions from private domestic expenditure are very modest indeed as households maintain their cautious approach and the relatively high saving ratio and investment flattens out and the increasing fiscal drag coming from the public sector.
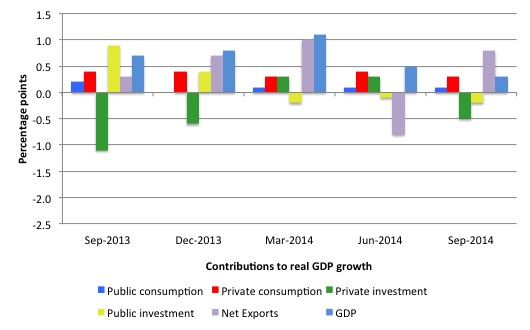
The next graph shows the contributions to real GDP growth of the major expenditure aggregates since September-quarter 2013 (in percentage points). The total real GDP growth (in per cent) is also included as a reference.
Real GDP growth positive but real net national disposable income negative
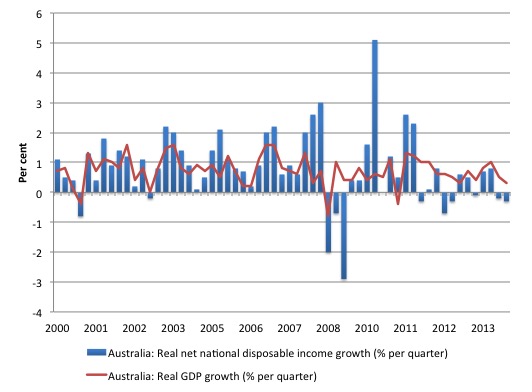
While real GDP growth (that is, total output produced in volume terms) remains positive albeit declining, real net national disposable income growth has been negative for the last two quarters, prompting commentators to declare Australia in a national income recession.
The following graph shows the evolution of the quarterly growth rates for the two series since the March-quarter 2000.
The ABS tell us that:
A broader measure of change in national economic well-being is Real net national disposable income. This measure adjusts the volume measure of GDP for the Terms of trade effect, Real net incomes from overseas and Consumption of fixed capital.
While the declining is the result of the declining export prices manifesting in the significant decline over the last 12 months in Australia’s terms of trade.
In other words, we are exporting volume but getting less for it, which means our capacity (in real terms) to purchase imports has declined per unit of export.
It means that Australians overall are poorer even though we are still producing more than 6 months ago and exporting increasing volumes of real goods and services to the rest of the world.
This discrepancy is one reason why an export-led growth strategy will not necessarily increase the standard of living of domestic residents, even if it exports grow.
Household saving ratio falls to 9.3 per cent
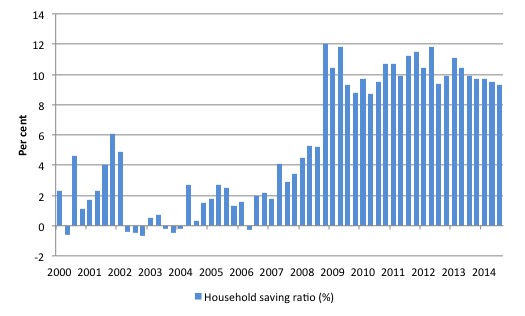
The following graph shows the household saving ratio (% of disposable income) from 2000 to the current period. The household sector is now behaving very differently since the GFC rendered its balance sheet very precarious.
Prior to the crisis, households maintained very robust spending (including housing) by accumulating record levels of debt. As the crisis hit, it was only because the central bank reduced interest rates quickly, that there were not mass bankruptcies.
The household saving ratio was 9.3 per cent of disposable household income in the September-quarter 2014 and down from the 9.5 per cent in the previous quarter.
While the recent trend is downwards, as the slowing growth squeezes real incomes, it is unlikely that households will return to the very low and negative saving ratios at the height of the credit binge given that the household sector is now carrying record levels of debt.
This also means that government surpluses which were associated with the credit binge, and only were made possible by the unsustainable credit binge are untenable in this new (old) climate. The Government needs to learn about these macroeconomic connections. It will learn the hard way once net exports weakens.
Real GDP growth and hours worked
One of the puzzles over the last several years or so has been the sharp dislocation between what is happening in the labour market and what the National Accounts data has been telling us.
Employment growth and hours worked has been virtually flat over the period while annual real GDP growth has been around 2.4 to 2.6 per cent.
Today’s data shows that real GDP growth has fallen on the back of lower productivity growth and increased hours of work.
This suggests that next week’s labour force data will not show a big hit to employment growth from the declining real GDP growth. But there is nothing good about productivity growth being barely above the zero line.
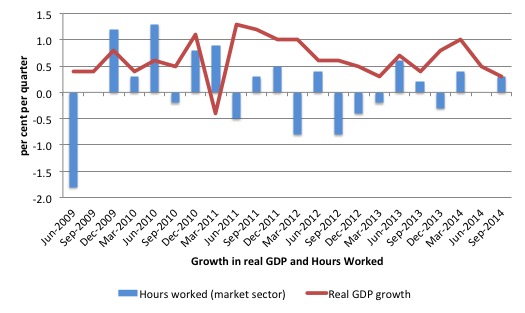
The following graph presents quarterly growth rates in trend GDP and hours worked using the National Accounts data for the last five years to the September-quarter 2014.
You can see the major dislocation between the two measures that appeared in the middle of 2011 persisted throughout 2013 but is less evident now.
Just in case you think the labour force data is suspect, the hours worked computed from that data is very similar to that computed from the National Accounts.
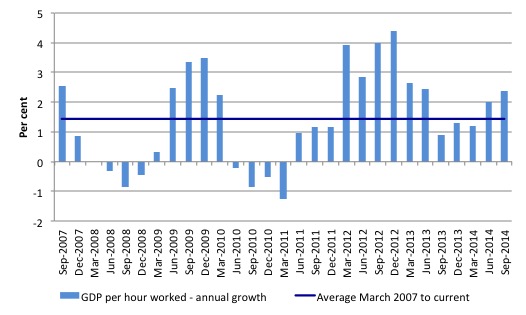
To see the above graph from a different perspective, the next graph shows the annual growth in GDP per hour worked (so a measure of labour productivity) from the September-quarter 2007 quarter to the September-quarter 2014. The horizontal blue line is the average annual growth since September-quarter 2007.
The relatively strong growth in labour productivity in 2012 and the mostly above average growth in 2013 and 2014 helps explain why employment growth has been lagging given the real GDP growth. Growth in labour productivity means that for each output level less labour is required.
Labour productivity growth has accelerated over the last three quarters, which is why jobs growth is so modest (and zig-zagging around the negative line).
With annual labour productivity growth currently at 2.4 per cent (well above recent averages), and labour force growth around 1 to 1.4 per cent, real GDP has to growth by around 3.4 to 3.8 per cent before unemployment starts to fall. Today’s growth decline suggests that unemployment is still likely to rise over the next several months.
Wage share rises a little
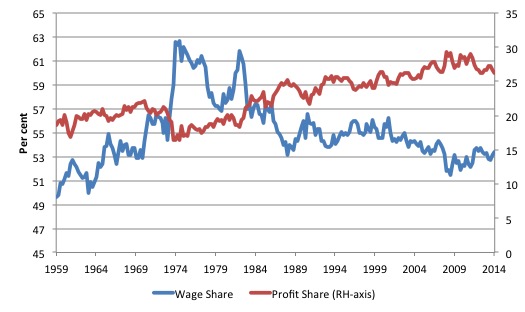
The wage share in national income rose in the September-quarter to 53.4 per cent, up by 0.3 percentage points.
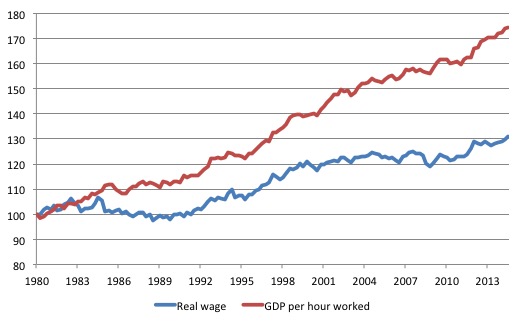
The following graph shows the movement in GDP per hour worked and the Average Real Wage per worker in index number form from September-quarter 1980 to the current quarter.
Productivity growth was 2.4 per cent over the last 12 months, whereas real wages grew by only 2.1 per cent. In the current quarter, real wages growth was 0.9 per cent, while productivity growth was 0.3 per cent, hence the rise in the wage share on the back of declining productivity growth.
But the trend in the wage share has clear been for the gap to widen, which indicates that capital (profits) have been gaining an increasing share of real GDP (national income) at the expense of the workers. Similar trends have been reported in other advanced OECD nations.
While neo-liberal commentators claim this is due to globalisation, the reality is that it has been driven by attacks on trade unions, increased casualisation and persistently high unemployment and underemployment. These factors have combined to make it difficult for workers to gain real wages growth. Globalisation is only one part of the story.
The next graph shows the outcomes in terms of movements in the wage share in national income (%) and the profit share (%) from the September-quarter 1959 to the current quarter.
As I have noted in the past, the deregulation in the labour markets not only increased job instability and created persistently high unemployment, but also led to large shifts in national income from wages to profits. Similar trends have been reported in other advanced OECD nations.
First, in most nations, the wage share in national income has fallen significantly over the past 35 years. Second, in the Anglo nations, ‘a sharp polarisation of personal income distribution has occurred’, with the top percentile and decile of the personal income distribution substantially increasing their total shares. The excessive executive pay deals that emerged in this period were one manifestation of the munificence gained at the expense of lower income workers.
Until the early 1980s, real wages and labour productivity typically moved together. However, as the attacks on the capacity of workers to secure wage increases intensified, a gap between wages and productivity opened and widened. This widening gap manifested as a rising profit share: in 1975, the Australian wage share was around 62.5 per cent of national income to be distributed to the factors of production. In the current-quarter it was around 53.4 per cent.
Australian governments aided this redistribution in a number of ways, through privatisation, outsourcing, harsh industrial relations legislation aimed at reducing union power, National Competition Policy and so on.
These movements in national income shares are also tied into the financial crisis. Imbued with the now-discredited ‘efficient markets’ hypothesis promoted by the University of Chicago economists, policy makers bowed to pressures from the financial sector.
They introduced widespread financial deregulation and reduced their oversight of the banking sector. This led to a massive expansion of the financial sector, and also set the stage for the transformation of banks from safe deposit havens to global speculators carrying increasing (and ultimately unknown) risks. The massive redistribution of the balance between national income and profits provided the banks and hedge funds with the gambling chips to fuel the rapid expansion of the ‘global financial casino’.
The capitalist dilemma was that real wages typically had to grow in line with productivity, to ensure that the goods produced were sold. So how does economic growth sustain itself when labour productivity growth outstrips the growth in the real wage? This was particularly significant in the context of the increasing fiscal drag coming from public surpluses, which squeezed private purchasing power in many nations during the 1990s and beyond.
The neoliberal period found a new way to solve the dilemma. The ‘solution’ was so-called ‘financial engineering’, which pushed ever-increasing debt onto households and firms. The credit expansion sustained the workers’ purchasing power, but also delivered an interest bonus to capital, while real wages growth continued to be suppressed. Households, in particular, were enticed by lower interest rates and the vehement marketing strategies of the financial engineers. It seemed too good to be true and it was.
The result was that Australian households now hold record levels of debt. The debt to disposable income ratio stood at 69.1 per cent in March 1996; by the June-quarter 2014, it had risen to a staggering 151.4 per cent.
Governments, their central banks and so-called financial industry experts played down any sense of alarm during the pre-crisis period, claiming that wealth was growing along with the debt. When the debt bubble burst, significant proportions of the ‘wealth’ vanished, leaving many borrowers with massive debts but few assets.
To restore a sustainable growth footing, there has to be a dramatic shift in the distribution of national income – towards workers. Real wages have to grow more or less in line with productivity, which will require legislative changes and higher government spending to reduce unemployment so there is more pressure on firms to pass on the productivity gains.
Conclusion
Today’s National Accounts data indicates that economic growth is slowing and is now well below trend.
The sharp decline in private and public investment is now dragging down growth and private consumption spending is weakening. Net exports are not likely to be as strong as evidenced in the September-quarter 2014, which means that the outlook is bleak unless there is a dramatic change in government policy.
The government sector is also draining growth now and causing unemployment to rise.
With demand fairly flat there is little incentive for private firms to increase the investment ratio.
Remember that the National Accounts tells us what was happening in 3-6 months ago. The most recent evidence is mixed but we know that export prices continue to fall and China continues to slow. Both of those facts would suggest that today’s data is a reasonable projection of the future.
But only a fool would be optimistic for the future.
That is enough for today!
(c) Copyright 2014 Bill Mitchell. All Rights Reserved.
Bill,
Re the graph GDP per hour worked – real wage. I see the reference to increased casualization, globalization etc but with capital productivity in long run decline surely this must have a significant effect as well. I wonder how closely the two would track of labour productivity was replaced with multi-factor.
Thanks
It is unfortunate that even MMT economists are fixated on growth which is the mantra of the very stupid and greedy people who are destroying Australia.
A lot depends on how growth is defined but we should be aiming for a steady state economy and society which is focused on conservation of the environment and of resources.
At present the establishment is focused on selling off the farm and wrecking the country. How dumb is that ?
Dear Podargus (at 2014/12/04 at 5:17)
MMT economists are not fixated on growth per se. They do, however, recognise that to avoid social exclusion employment is important. With a growing population, economic growth is essential to ensure there are jobs for all those who desire to work. There is no way around that.
So my aim is to:
1. Redefine what we mean by meaningful work.
2. Redirect economic growth (change its composition) to sustainable activities.
Much of that will require a larger public sector role rather than a smaller one. A steady state, by the way, does not mean zero growth. It means sustainable growth.
Are you going to decide which people stop having children? Even old nations like Europe are still seeing population growth. And how are we to deal with the nations that are much poorer than us who have rapid population growth?
best wishes
bill
Treasurer Joe Hockey was on ABC radio this morning.
He thinks the government runs like a household and yet last I checked I wasn’t a monopolist supplier of currency and able to force citizens to require that currency by charging them taxes.
Joe also assures us that the best way forward is to increase non-government debt by seeking a suplus budget -regardless of the private sectors current desire to save and a massive current account deficit.
Well done to anyone that voted for this clown.
To be fair to politicians in general, they aren’t supposed to be experts in their portfolio area. Normally, they would take frank and fearless advice from public servants in their department. Unfortunately, not only has the department been purged of those not drinking the neo-liberal Kool-Aid, but I suspect this mob only takes advice from the IPA and their financiers. As long as neo-liberal mumbo-jumbo dominates the economics landscape, this will continue to happen.