Today (January 22, 2026), the Australian Bureau of Statistics (ABS) released the latest labour force…
The opportunities for the unemployed in Australia are deteriorating
I have very little time today given other commitments. In recent months the Australian labour market has deteriorated quite noticeably and the Government has been forced to revise its estimates of the unemployment rate up to 6.25 per cent from 5.75 per cent in 2014. It is currently at 5.7 per cent and rising and before the GFC it reached a low-point value of 4 per cent. Underemployment is also rising as is hidden unemployment as the participation rate falls due to lack of employment opportunities. Further, in the last 6 months around 84 per cent of the net jobs created have been part-time. For the first time in several federal elections, unemployment and the paucity of job openings has become an election issue. Today, I used the little free time I had available to update my gross flows database to see if we could discern these trends as changing transition probabilities. In this blog I analyse the flows between full-time and part-time employment as well as movements between non-participation and employment to finish off the story. This blog is thus just an exploration of the data and an exercise to keep my databases current and for me to know what they are saying. The empirical side of my working life!
For earlier blogs on Australian gross flows – including an earlier sample going back to 1980 – please read – What can the gross flows tell us? and – More gross flows – movements between employment.
As a refresher, gross flows analysis allows us to trace flows of workers between different labour market states (full-time employment; part-time employment; unemployment; and non-participation) between months. So we can see the size of the flows in and out of the labour force more easily and into the respective labour force states (employment and unemployment).
The various inflows and outflows between the labour force categories are expressed by the ABS in 000s of persons. But a useful alternative presentation is to compute transition probabilities, which are the probabilities that workers make changes in their labour market state from one month to the next.
For example, computing transition probabilities from the gross flows data allows us to answer the question: Is an unemployed person more likely to enter full-time employment next period or transition into employment via part-time employment? Or, does part-time work provide a greater chance of full-time work (the so-called stepping stone hypothesis that the neo-liberals love and use to justify trashing the job security of workers).
As a matter of interpretation, if a transition probability for the shift between full-time employment to unemployment is 0.05, we say that a worker who is currently employed full-time has a 5 per cent chance of becoming unemployed in the next month. If this probability fell to 0.01 then we would say that the labour market is improving (only a 1 per cent chance of making this transition).
The following table shows the schematic way in which gross flows data is arranged each month – sometimes called a Gross Flows Matrix. Here FT refers to full-time employment, PT to part-time employment, U to unemployment and N to Not-in-the-labour force. The subscripts t and t-1 refer to the current month and the previous month, respectively.
For example, the element FT to FT tells you how many people who were in full-time employment in the previous month (t-1) are in full-time employment in the current month (t). Similarly the element FT to U tells you how many people who were in full-time employment in the previous month (t-1) are now unemployed in the current month (t). And so on. This allows you to trace all inflows and outflows from a given state during the month in question.
The transition probabilities are computed by dividing the flow element in the matrix by the initial state. For example, if you want the probability of a worker remaining unemployed between the two months you would divide the flow (U to U) by the initial stock of unemployment, Ut-1. If you wanted to compute the probability that a worker would make the transition from full-time employment to unemployment you would divide the flow (FT to U) by the initial stock of full-time employment, FTt-1. And so on. So for the 4 states we can compute 16 transition probabilities reflecting the inflows and outflows from each of the combinations.
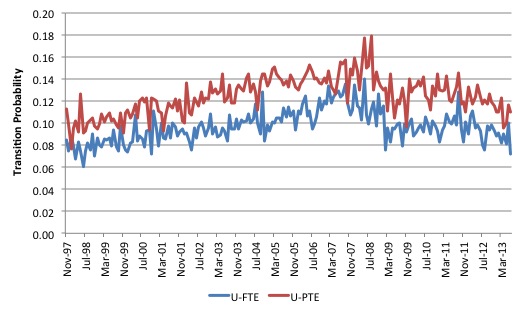
The first graph shows the transition probabilities since November 1997 for an unemployment person. U-FTE is the chance a person who is unemployed last month will enter full-time employment. U-PTE is the chance they will enter part-time employment.
Prior to downturn, which began in February 2008 (the low-point unemployment rate month in the last cycle) the probability of finding work increased for both part-time and full-time, although over this period unemployment workers were more likely to transit into part-time work than full-time work.
The increasing trend to precarious, poorly-paid and casusalised work which produced a rise in underemployment from the early 1990s is consistent with this data.
After the initial downturn, the fiscal stimulus saw the probabilities start to improve for both U-FTE and U-PTE, although as expected the recovery was mostly defined by improved chances of the unemployed gaining part-time work.
However, with the withdrawal of the fiscal stimulus and the sharp contraction in the public contribution to final demand in 2011 and 2012, combined with the end of the investment boom associated with the terms of trade boom in mining, the prospects for the unemployed have deteriorated.
The transition probability of an unemployed worker entering full-time employment is now below the low levels of 2009.
Overall, an unemployed worker has more chance of getting a part-time job (11 per cent) than a full-time job (7.2 per cent).
What about the transitions between employment states?
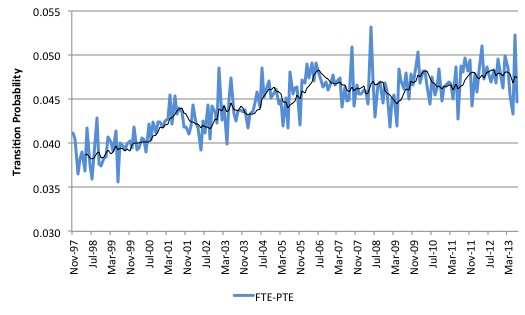
The first graph shows the transition probability of a full-time worker becoming part-time in the next period. The black line is a 6-month moving average. The trend is clearly upwards overall.
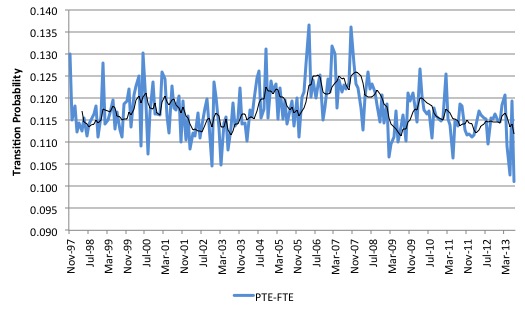
The next graph is the transition probability of a part-time worker becoming full-time in the next period. The black line is a 6-month moving average.
The trend in the last few years is downwards and overall the chances of a part-time worker making these transitions is lower in an average month than it was in the late 1990s.
The cyclical nature of this probability suggests that it is the state of the business cycle that determines the transition rather than anything intrinsically related to the status of part-time work.
I draw that distinction because it reflects on the so-called stepping stone hypothesis. The mainstream argument posits that:
1. Casual (part-time) employment provides work experience which enhances human capital formation while unemployment leads to skill atrophy.
2. Casually employed workers signal their ability and willingness to accept work by accepting casual employment.
3. (Casual) employment enlarges the social network of job seekers, which in turn, provides valuable linkages to a wider knowledge of job vacancies.
These so-called advantages are then used to justify the claim that job seekers have a higher probability of gaining a non-casual job if they are first in casual employment rather than from a state of unemployment.
I have done quite a bit of research on this topic with a colleague from James Cook University (Dr Riccardo Welters). Some of this text today is taken from joint work that Riccardo and I have done. We have sought to investigate the proposition that casual work acts as a stepping stone to more secure work.
Some of the mainstream research used to substantiate the stepping stone argument does not exclude students who combine school/study and casual work. This biases the results in favour of the stepping stone argument. Why? Because students who engage in casual work to support them while studying and then upon graduation enter a professional occupation are not representative examples.
The sucessful transition from casual work to full-time work has nothing to do with the casual work experience. The casual work has nothing much to do with the skills they subsequently garner in their professional capacity which requires only a university qualification for entry. Further, the casual employment undertaken typically bears no relationship to the industry or occupation that they enter after finishing their studies.
So in research studies, one must always exclude this cohort.
Some conclusions we have reached:
First, we consider the predictions from Dual Labour Market theory – or Segmented Labour Market theory to be a reasonable description of the structure of labour markets in most countries.
SLM theory argues that the labour market is segmented into two separate labour markets each with different processes for allocation and reward. These segments resist transitions from each other.
The most basic demarcation is between the Primary Labour Market (PLM) and the Secondary Labour Market (SLM). PLM workers are typically employed in a tight internal labour market structure which provides for career advancement and tend to search for jobs within the firm while already employed. The jobs are secure and relatively well-paid.
The SLM is characterised by low-paid, insecure “dead-end” jobs which have high turnover rates. The jobs do not have well-defined career ladders and offer very little training for higher productivity.
While the PLM worker searches for new ways in which to climb the career ladder, the SLM worker usually searches to avoid being sacked.
Given the lack of mobility between the “segments”, a SLM worker will typically not make the transition into the PLM. Workers thus become “trapped” in poor jobs with spells of unemployment intervening periods of low paid work.
Our research shows that casually employed workers find it harder to transit to non-casual employment in Australia if they start their working life in the secondary labour market – that is, if they are working in low skill occupations.
Second, we have found that casually employed workers find it easier to move into non-casual employment if they are employed in large firms rather than small firms. The reason is that the large firms provide exposure to a broader and deeper social network.
Third, the longer a person is in casual employment the harder it gets to exit that state. This is called “duration dependence” in the literature. The evidence suggests that any period beyond three years triggers this constraint and traps the worker into a circle of precarious casual work with intervening periods of joblessness.
An important part of this research is that the transition probabilities are not exclusively defined by the individual characteristics of the worker, which is usually assumed by the mainstream paradigm.
That is, they consider individuals make choices to invest in skills and then their destiny is in their own hands. The evidence clearly rejects that idea and indicates that “environmental” factors – which are beyond a worker’s control are important.
Please read my blog – Casual work traps workers into low-pay and precarious jobs – for more discussion on this point.
The behaviour of the PTE-FTE transition probability is consistent with this research.
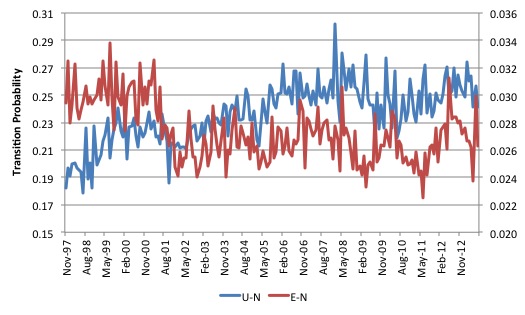
The final graph today shows the probabilities of an employed person (E) moving to not-in-the-labour-force (N) and an unemployed person (U) moving to not-in-the-labour-force (N).
The participation rate in Australia has fallen sharply since November 2010 and the data suggests that the unemployed are now more likely to exit that state and move into non-participation than they were before the crisis. That probability is increasing.
The E-N probability is also higher than pre-crisis but much lower in absolute terms compared to the U-N probability.
They are now much more likely to exit the labour force (into non-participation) (2.4 per cent) than gain employment (1.8 per cent).
Conclusion
The Gross Flows data is fairly tricky to deal with and I often note anomalies in it relative to the standard Labour Force data. I have done work in how the flows data compares to the stock data in the past and I might revisit that sometime given the volatility in the current data set.
But what can be gleaned from the data is that the labour market is deteriorating and unemployed workers have less opportunities to enter employment (particularly full-time employment).
They are now much more likely to exit the labour force (into non-participation) (2.4 per cent) than gain employment (1.8 per cent).
Not a good situation.
That is enough for today!
(c) Copyright 2013 Bill Mitchell. All Rights Reserved.


This Post Has 0 Comments