I am travelling today to Tokyo and have little time to write here. But with…
Australian economy falls of a cliff – at least for now
Today, the Australian winter officially begins yet where I am the sun is shining. Not so for the Australian economy though. The Australian Bureau of Statistics released the National Accounts data for the March 2011 quarter which shows that in the first three months of this year the Australian economy contracted by a staggering 1.2 per cent. The result has been dismissed by the Government and many of the commentators as a “one-off” result driven by the extraordinary weather events (floods and cyclones) earlier in 2011. There is some truth in that statement. But overall once we net out the likely effects of the natural disasters the data suggests that the Australian economy is growing modestly – but not strong enough to eat into the pool of idle labour. We have to appreciate that this is a rear-view mirror of what the economy was doing 3 months ago. The contemporary data (flat credit demand, construction, retail sales, employment growth) tells us that the current performance of the Australian economy is very weak. With the contribution from government now negative and the household sector saving ratio rising sharply we are increasingly dependent on the external sector for on-going growth. The fact is that with China introducing contractionary policies there is still some uncertainty ahead on that front notwithstanding the evidence today (terms of trade) that demand for our exports remains strong.
In my blog covering the December 2010 quarter National Accounts data I noted that the outlook was not optimistic as the fiscal stimulus was being withdrawn and private spending was still very subdued. I also noted that the external sector was still draining growth despite the almost boundless rhetoric that we were in a “once-in-a-hundred-year” mining boom. Today’s data release doesn’t change my assessment very much at all.
Yesterday (May 31, 2011) the ABS released its Balance of Payments and International Investment Position for March 2011 which showed:
- The seasonally adjusted current account deficit rising by $A2,356m (29%) in the March quarter 2011.
- In seasonally adjusted real terms, the deficit on goods and services rose $A7,781m in the March quarter 2011.
The ABS said that this result “is expected to detract 2.4 percentage points from growth in the March quarter 2011 volume measure of GDP”. That is, real GDP growth will be reduced by 2.4 points.
And so it did. Today’s National Accounts data showed that the sharp contraction in our external performance led to a very significant drop in real GDP growth in the March 2011 quarter.
How much of that has been due to the natural disasters (floods then cyclone) is the topic of debate. The Government, which has just brought in a harsh austerity budget, claiming the economy is about to burst at the seams, is clearly advancing the line that this dramatic collapse in growth is temporary and that by the second or third quarter we will be once again booming.
The data tells a different story. The economy began slowing well before the floods in January. The September and December 2010 quarters clearly showed signs that as the fiscal stimulus was being withdrawn aggregate demand was softening.
The main features of today’s National Accounts release for the March 2011 quarter were (seasonally adjusted):
- Real GDP decreased by 1.2 per cent (after rising by 0.8 per cent in the December quarter and 0.1 per cent in th e September 2010 quarter.
- The main positive contributors to expenditure on GDP were private gross fixed capital formation with some positive contribution from private consumption.
- The main main negative factors impacting on spending were net exports (-2.4 percentage points) and inventories (-0.5 percentage points).
- Net exports as noted anove collapsed in the March quarter and reduced real GDP growth by a staggering 2.4 percentage points. Exports fell by 8.7 per cent in the March quarter.
- Real gross domestic income was flat.
The Australian Bureau of Statistics Media Release noted that:
Latest ABS figures show that GDP, in seasonally adjusted volume terms, declined 1.2% in the March quarter 2011. This is the largest quarterly fall in GDP since the March quarter 1991.
Flooding which began in late December 2010 combined with cyclones in both Queensland and Western Australian have had a significant impact on the March quarter activity.
It is clear that external demand (as indicated by our booming terms of trade) remains robust and the collapse in exports is supply-related – that is, the floods stopping production and interrupting the capacity to get minerals etc onto ships. But even before the floods, net exports were a negative influence, record terms of trade notwithstanding.
Nobody really gets carried away with a single quarter’s data and there was some positive growth in the non export components on spending but a 1.2 per cent contraction is severe in anyone’s language.
But my overall reading of the many strands of information and data that is currently available is that while the severity of this contraction will be a one-off event the Australian economy is still very weak and is struggling to restore its growth trajectory following the crisis.
The withdrawal of the fiscal stimulus and the tightening of monetary policy has been premature in my view. I have held that view for several quarters now and I think the data is bearing that view out.
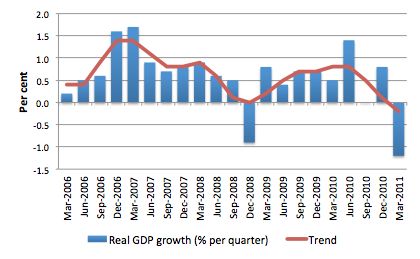
If you examine the next graph which shows quarterly growth since March 2006 you will see that the economy recorded zero growth in the September quarter and was sluggish before that. The growth trend has been consistently downward since the middle of 2010.
So while weather has played a large part in this quarter, private spending generally has been relatively weak for many quarters. I will come back to that point later.
The following graph shows the quarterly percentage growth in real GDP from March 2006 to March 2011 (blue columns) and the ABS trend series (red line) superimposed. Trend real GDP growth started to level off in September 2009 and has been pointing downwards since June 2010. The average for both trend and actual real GDP quarterly growth over the last year is 0.3 per cent. So today’s figures indicate that over the last year the Australian economy grew by 1 per cent only which is more than 3 times below long-term trend growth and not sufficient to sustain strong employment growth.
It is no wonder that employment growth was negative last month.
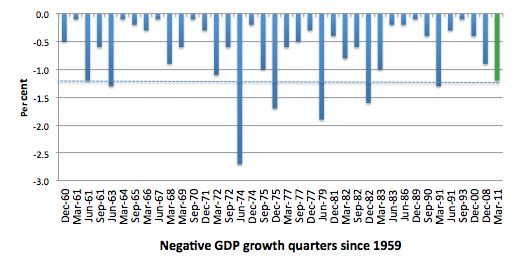
To put the quarterly GDP retreat into perspective I graphed all the negative growth quarters since National Accounts data began (in their current form) in September 1959. The dotted horizontal line is at -1.2 per cent to make it easier to track across.
It is clear that this contraction is severe and has only been dwarfed by the very bad downturns in June 1974, June 1979 and December 1982. Even the severe 1991-92 recession did not produce quarterly contractions much worse that now.
So what components of expenditure added to and subtracted from real GDP growth in the March 2011 quarter?
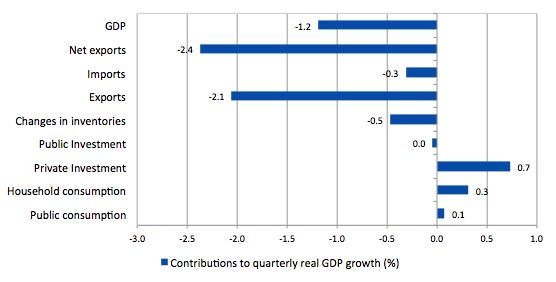
The following graph shows the percentage contributions to real GDP growth in the March 2011 quarter by aggregate spending type. GDP growth contracted by 1.2 per cent in the March quarter.
The two stand-out items are the collapse of net exports (with exports contracting by 2.1 percentage points and imports dragging local demand down by a further 0.3 percentage points and the reversal of the inventory cycle. Last quarter inventory building added 0.8 percentage points but it is clear that that cycle is over and inventory accumulation was a negative force in the March quarter taking 0.5 percentage points off growth.
The rapid fall in exports has been largely accounted for by the bad weather that our coal and agricultural areas endured earlier in the year. But when you dig down a bit you see that there is a general weakness in the external contribution which I will come back to soon.
The strongest positive contribution came from private investment which contributed a strong 0.7 percentage points to economic activity (up from zero in the December quarter).
This is a major reversal on the last three quarters where the contribution of private capital formation has been declining. The result in the March quarter is in line with the ABS forward looking investment data. The problem is that capacity formation has to be used and that requires support from the other expenditure components in subsequent quarters.
Public investment, however, is now a contractionary force as the fiscal stimulus unwinds.
Private consumption added 0.3 percentage points (up from 0.2 percentage points in December quarter) and this contribution, which is fairly modest, has been relatively stable over the last year. The retail sector has not been strong in the March quarter.
Public consumption fell from 0.2 percentage points in December to 0.1 points in March 2011. Again, barely any stimulus is now coming from the government sector.
Overall, the public contribution is falling as the government unwinds its fiscal stimulus in pursuit of a budget surplus. If the Federal government continues down this path (and the May Budget suggested it intends to accelerate the austerity drive) then the economy will be burdened by fiscal drag.
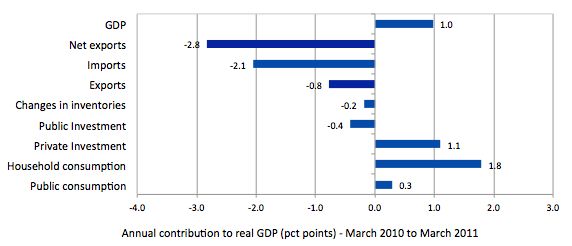
The following graph shows the contribution to real GDP growth over the last year (four-quarters to March 2011) by expenditure components.
The contribution of government consumption and investment to real growth over the last year was negative (0.1 percentage points) after reaching a high of a 2 percentage points contribution between September 2009 and September 2010. This reflects the withdrawal of the fiscal stimulus.
The stimulus however will also be somewhat responsible for the contribution of private household consumption – 1.8 percentage points in the year to March 2011.
Private investment was the next strongest contributor to growth over the last year which is in line with the major mining projects being undertaken. It added 0.7 percentage points to growth over the last year.
Private consumption added 0.3 percentage points over the last year to real GDP growth which is a relatively modest contribution.
The two negative contributors were inventory building (-0.2 percentage points) and net exports (-2.8 points). The external sector has not added to growth in this period and even if we took out the current 2.4 percentage point negative effect of the export collapse in the March 2011 quarter we would still be experiencing a negative contribution from the external sector.
Is the contraction temporary?
As noted in the introductory comments, the Government and media are claiming that this downturn is temporary and induced by the severe floods and cyclone that hit Northern Australia in the early part of this year. To what extent is that proposition true and if we try to net that estimated effect out what happens?
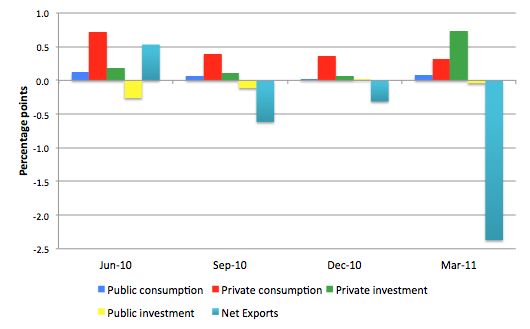
The following graph shows the contributions of the main aggregate expenditure components for each of the quarters (June, September and December 2010 and March 2011) over the last year.
Yes, I am still taming the iMac colour scheme!
The collapse of net exports in the March quarter clearly stands out and “intervention analysis” would look for likely suspects even though net exports had been weak (negative factor) in the previous two quarters.
The obvious candidate is the hostile weather (floods and cyclones) that the nation endured in the early part of 2011.
To see what sort of impact the weather might have made I abstracted entirely from the external sector performance in the March 2011 quarter. I averaged the first three quarters of the year to March 2011 (June to December 2010) and assumed that the external sector would repeat that performance in the March quarter.
Under these assumptions, exports would have contributed 1.77 percentage points but imports would have drained demand by 2.30 percentage points meaning that the contribution of net exports over the last year would have been -0.53 points. If all the other contributions to real GDP growth were unchanged (a very simplistic assumption) then annual real GDP growth would have been 2.1 per cent rather than 1 per cent.
Considering the March 2011 quarter alone, the revised contribution of net exports would have been -0.13 percentage points (instead of -2.4 percentage points) and real GDP growth would have been 0.5 per cent rather than -1.2 per cent.
So if the external sector had have performed on “average” in the March quarter we would have still had real GDP growth that was well below trend.
The weather definitely was a negative factor (by this reckoning of the order of 0.7 percentage points) but the Australian economy is still not performing near its past trend rates of growth.
That is why there is 12 per cent labour underutilisation (unemployment plus underemployment) at present.
Household saving ratio
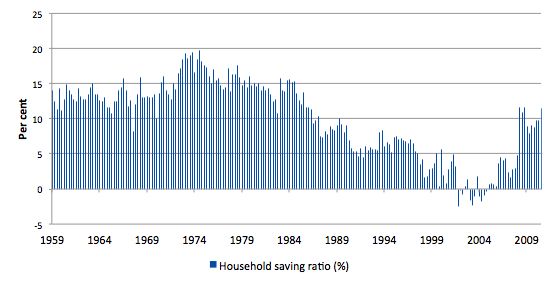
In the past I have provided a graph showing the household saving ratio (% of disposable income) from 2000 to the current period. I thought today that I would provide a graph from the time the current era of National Accounts data began (September 1959).
The reason is to help readers understand the comments I make about “typical” and “atypical” behaviour among the macroeconomic aggregates.
I have often said that the period in the late 1990s up until the crisis when the government was running surpluses and the household sector was accumulating record levels of debt which allowed it to indulge in a consumption binge were atypical. The credit-binge underpinned relatively strong growth, which in turn allowed the government to run the surpluses (revenue growth was so strong) over this period.
But the behaviour was very odd by historical standards. The problem now is that the conservatives (who are really neo-liberals rather than traditional tories) have reconstructed history as if the budget surpluses are normal.
The following graph shows how atypical the period of the budget surpluses were (from 1996 to 2007). As households increasingly went into the red and were dis-saving the household saving ratio became negative. As a result of the risk now carried by the record levels of indebtedness and the uncertain nature of the economy at present (threat of unemployment is still high), households are resuming their historically typical behaviour and consumption is more subdued as a result.
The household saving ratio rose to 11.5 per cent of disposable household income in the March quarter after steadying at around 9.7 per cent for several quarters.
For the economy to continue to grow strongly while households are maintaining rising levels of saving (from disposable income), public spending, private investment and/or net exports has to increase. The problem is that the contribution from net exports remains negative (as explained above).
So we are relying on private investment spending and that is flukey at best. Clearly, growth is insufficient to really make a dent in the entrenched labour underutilisation.
In my view, net public spending should rise (and the Government abandon its surplus ambitions) to ensure that nominal aggregate demand growth is sufficient to “ratify” the household saving intentions and support stronger real growth.
The private sector has to reduce the overhang of debt left from the last credit binge. That process has to be supported by a growth in net exports or public spending. Neither expenditure component is helping right now.
The continuation of budget deficits, however, should not be seen as some weakness or profligacy. During the long period of post WW2 growth, the federal government ran continuous deficits as a response to the saving desires of the private domestic sector.
Conclusion
Today’s result is difficult to be definitive about. Clearly, it is an appalling result. But it is so contaminated by the floods and cyclone that we will have to wait until the June quarter 2011 to more clearly see what the underlying growth rate of the economy is. We have to be careful because today’s data is a rear-vision mirror view of where the economy was 3 months or so ago.
I do agree that the negative growth is a “one-off” which reflects the severity of the weather-events in the earlier part of 2011. But it is also true that the data tells a different story. The economy began slowing well before the floods in January. The September and December 2010 quarters clearly showed signs that as the fiscal stimulus was being withdrawn aggregate demand was softening.
Even a reasonable adjustment for the “weather” impact leaves real GDP growth floundering along at well below the longer-term trend and not sufficient to generate the rate of employment growth that is necessary to eat into the huge pool of idle labour left over from the sharp downturn in 2008.
The data is clearly not signalling an economy that is about to move to full employment very quickly.
The brighter news from the March quarter data was the strength of private investment. But overall we are still seeing fairly modest private sector spending growth.
Further, even though exports took a huge “weather hit” the fact is that net exports have not been making a positive contribution to growth over the last several quarters and any rise in export income is likely to be nullified by rising imports.
While our terms of trade are strong this has not translated into an improved or even positive contribution from the external sector.
You can have the biggest export boom in history but if imports outstrip the exports the benefits go to other nations who are exporting to us. Whichever way you want to spin the story – when net exports are negative the external sector is dragging on real growth – “once-in-a-hundred-year mining boom” notwithstanding.
That point seems to have been lost on the majority of commentators in Australia at present. Local employment depends on local spending. If the spending we get from abroad (exports) marches straight out of the country again it does not stimulate growth locally.
That is enough for today!
My back of envelope calculations using Excel also got around -0.5 points for net exports and that is pretty much the long term trend for the better part of two years.
I love getting this data coming up with a conclusion and seeing your work verify it. I think we need to see NX add 4% to real GDP in the next quarter to negate any recessionary effects.
Strong terms of trade mean the tendency to import is increased, putting pressure on domestic industry.
Just one of those coincidences that bad weather in the UK has given rise to a similar though milder pattern.
Again, the UK Tories have been hollowed out, infected and riddled with neo-liberalism and don’t seem to realise, so it’s not surprising that Orange Book Cleggist Liberals are in bed with ‘liberal’ Tories.
where are imports coming from? how does this relate to the weak US and QEx
Why do you regard private investment spending as so flukey?
Whereas in my view that would actually be counterproductive while the Reserve Bank maintains its hawkish stance on interest rates, and would be unnecessary if the Reserve Bank switches to a more sensible policy.
If Australia’s a net importer at the moment, does that mean the high Aussie dollar’s entirely down to the carry trade?
Aiden “If Australia’s a net importer at the moment, does that mean the high Aussie dollar’s entirely down to the carry trade?”
It seems curious that both Brazil and Australia have very strong currencies (in purchasing parity terms), both have large positive interest rates and both are the major iron ore exporters and in both cases have suffering manufacturing sectors. Why are they both choosing such high interest rates? Brazil is scared of inflation but would taxing the iron ore windfall be a better way to moderate inflation? The high interest rates just make imports cheap and do not affect iron ore exports much because you can’t outsource geology if no where else in the world is remotely similar to those two countries.
stone, pretty much all commodities exporters are facing the same problem, sort of a mild dutch disease. Do you think taxing those exports will eliminate the problem?
“Why do you regard private investment spending as so flukey?”
I don’t think it will continue apace (outside the resource sector) unless private spending makes a sustained pick up.
My home town of Gladstone is about to become the focal point of a new LNG boom. The preliminary stages of a number of gas plant constructions are beginning now. Construction of the first plant alone will require around 7000 workers. The forecasts are that our permanent population will double within 10 years to become a major provincial city. In order to take advantage of this, strong investment intentions are building (the public notice signs are up for a housing development submitted for approval that will be the size of a small town – AND just down the road from me, shattering my semi-rural peace and quiet!).
But this and other proposals all hinge on the assumption that there will be a huge and sustained boom in demand for housing, goods and services. I think many people are overestimating the effect of the LNG boom on Gladstone.
I had a long conversation with a mate who now works for LNG in the preliminaries and he basically confirmed most of my thoughts about the situation, himself having been approached by one of the big bosses who asked him, as a local how did he think other locals felt about the situation. This boom will not be like any other that this industrial town has experienced over the years. Traditionally, a major construction construction project would last 4-5 years and construction workers would flood the town. The married men would bring their families and the towns semi-permanent population would swell. They needed to buy or at least rent houses and to then fill them with all manner of goods. The semi-permanent residency of large numbers of workers and their families created strong local demand for goods and services.
But this situation will now change. There is a new kid on the block – the FIFO (fly in/ fly out worker) and the workforce will consist mainly of these. Few locals will be needed. FIFO’s reside permanently in other parts of the country (Perth, Brisbane, Sydney etc). They do not need houses for their families since they do not bring them, they live in workers camps and rental accomodation. They do not require anything like the level of local goods and services that a more settled workforce does. They have home and families on the other side of the country – they will fly in, work their shift and then fly home again, taking most of their money with them.
If much of the income generated simply bypasses the town, where is the ongoing demand needed to support the investment currently gearing up going to come from? If significant amounts of money from the projects do not enter our local economy, why would huge numbers of secondary jobs be created? After all, they can only be sustained if there is ongoing demand. Something of a “gold rush mentality” is prevailing here at present – I think some of the forecasts are wildly optimistic.
Long story short – private investment is good but if, for whatever reason(s), private consumption spending fails to grow to match it, it will probably end up withering on the vine.
Does anybody know what is how and how much iron ore production is currently taxed in Australia? I’d appreciate any link.
MamMoth,
do you mean the state royalties on iron ore? Google stuff about WA increasing royalties because stories I read had the numbers. From memory lump and fines were taxed at different rates and what WA was actually proposed was to rise one so both were the same.
Mike, I googled but couldn’t find what I’m looking for. I read something about WA raising its taxes which will reduce the income from taxes at the national level… I know the former is about 7%, the latter about 30% but I don’t know if these percentages apply to income, or profits, or whatever, and if there are additional corporate taxes that also apply to iron ore production.