Over the last several years, I have been indicating that I think we are in…
Trump’s “best is yet to come” and the data reality are diverging – for the worse!
I haven’t provided detailed commentary on the US labour market for a while now. To some extent the month-to-month changes are not that interesting but after a lapse, discernible trends can be detected. The US President is about to give a national address today in the context of declining poll popularity and a series of negative trends emerging. His constant narrative that everything is great and America has never been so soundly governed (by him!) is finally starting to come up against the reality of data, which has been masked a little by the government shutdown, which meant that key statistics were not published in a timely manner or are being published late. The labour market data has been so affected and the most recent release by the US Bureau of Labor Statistics (BLS) last Tuesday (December 16 , 2025) – Employment Situation Summary – November 2025 – shows a deteriorating situation and negates the political bombast coming from the President and his cronies.
Overview for November 2025 (seasonally adjusted):
- Payroll employment increased by 64,000) (up from -105,000 last month).
- Total labour force survey employment rose by 96 thousand net (0.06 per cent). The monthly change and growth rates for the Labour Force survey data used the observations for November 2025 and September 2025, given the missing observation for October 2025.
- The labour force rose by 323 thousand net (0.19 per cent).
- The participation rate rose 0.1 point at 62.5 per cent.
- Total measured unemployment rose by 228 thousand to 7,831 thousand.
- The official unemployment rate rose 0.2 points to 4.6 per cent.
- The broad labour underutilisation measure (U6) rose 0.7 points to 8.7 per cent.
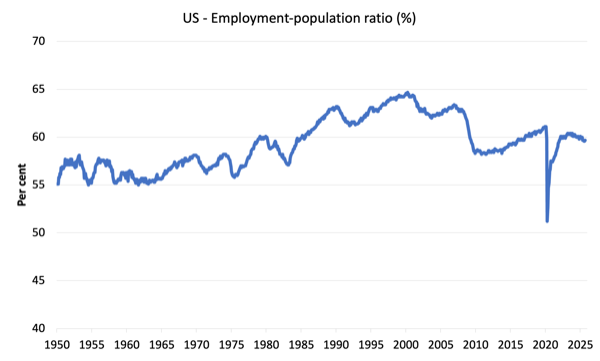
- The employment-population ratio fell 0.1 point to 59.6 per cent (well below the June 2020 peak of 61.2).
Impact of government shutdown on the data
One of things that bug econometricians and statistical researchers (like me) is a discontinuity in the available time series. COVID-19 created a massive break and is making research much more difficult (essentially one has to ‘dummy out’ several quarters of data (that is, a statistical technique that allows one to ignore those observations in a much longer time series.
The recent government shutdown in the US is another example of this problem.
The BLS did not collect “household survey estimates for October 2025” and in November, the BLS was a week later than their “typical reference week” in resuming data collection.
From a statistical perspective, these interruptions played havoc with various aspects of the estimation process (for example, the weighting process to move from sample to population estimates).
The workarounds and the lower November response rate means that the BLS is less certain about their estimates for this release (“slightly higher than usual standard errors”).
Further, despite what some commentators might have you believe, the BLS makes it clear that:
It is not possible to precisely quantify the effect of the federal government shutdown on household survey estimates for November.
For the payroll data derived from the establishment survey, the BLS just extended the time period for the responses and was still able to publish two separate months of data.
For those who are confused about the difference between the payroll (establishment) data and the household survey data you should read this blog post – US labour market is in a deplorable state – where I explain the differences in detail.
Some months the difference is small, while other months, the difference is larger.
Payroll employment trends
The BLS noted that:
Total nonfarm payroll employment changed little in November (+64,000) and has shown little net change since April. In November, employment rose in health care and construction. Federal government employment declined by 6,000, following a loss of 162,000 in October …
In November, health care added 46,000 jobs, in line with the average monthly gain of 39,000 over the prior 12 months …
Construction employment grew by 28,000 in November … Construction employment had changed little over the prior 12 months.
Employment in social assistance continued to trend up in November (+18,000), primarily in individual and family services (+13,000).
In November, employment edged down in transportation and warehousing (-18,000), reflecting a job loss in couriers and messengers (-18,000). Transportation and warehousing employment has declined by 78,000 since reaching a peak in February.
Federal government employment continued to decrease in November (-6,000). This follows a sharp decline of 162,000 in October, as some federal employees who accepted a deferred resignation offer came off federal payrolls. Federal government employment is down by 271,000 since reaching a peak in January …
Employment showed little change over the month in other major industries …
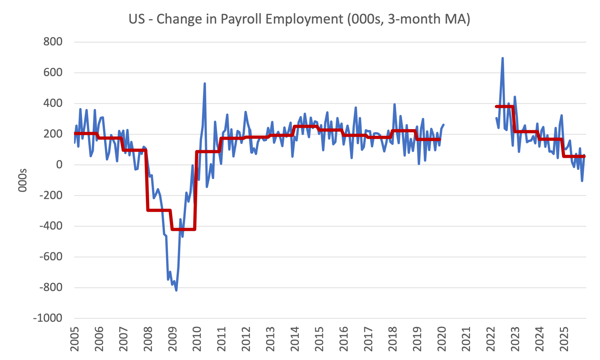
The first graph shows the monthly change in payroll employment (in thousands, expressed as a 3-month moving average to take out the monthly noise). The red lines are the annual averages. Observations between March 2020 and March 2022 were excluded as outliers.
The average line (which does not exclude the outliers) allows you to see the extent of the slowdown over the first two years of the Covid outbreak.
The next graph shows the same data in a different way – in this case the graph shows the average net monthly change in payroll employment (actual) for the calendar years from 2005 to 2023.
The yellow marker on the column is the current month’s result.
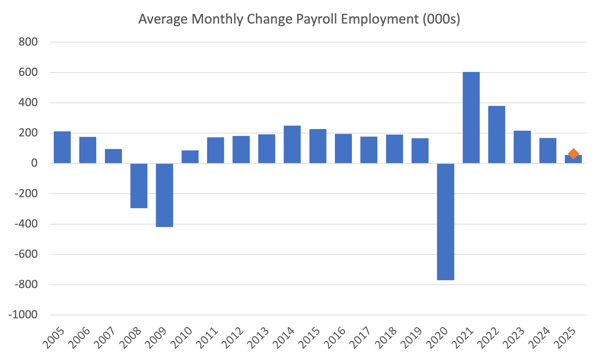
Average monthly change – 2019-2025 (000s)
| Year | Average Monthly Employment Change (000s) |
| 2019 | 166 |
| 2020 | -771 |
| 2021 | 603 |
| 2022 | 380 |
| 2023 | 216 |
| 2024 | 168 |
| 2025 | 55 |
Summary: Trump is overseeing a major decline in the US labour market.
Labour Force Survey data – looking very weak
The seasonally-adjusted data for November 2025 reveals:
1. Total labour force survey employment rose by 96 thousand net (0.06 per cent).
2. The labour force rose by 323 thousand net (0.19 per cent).
3. The participation rate rose 0.1 point at 62.5 per cent.
4. Total measured unemployment rose by 228 thousand to 7,831 thousand.
5. The official unemployment rate rose 0.2 points to 4.6 per cent.
6. The broad labour underutilisation measure (U6) rose 0.7 points to 8.7 per cent.
7. The employment-population ratio fell 0.1 point to 59.6 per cent (well below the June 2020 peak of 61.2).
Taken together these statistics indicate a weakening situation.
The Employment-Population ratio is a good measure of the strength of the labour market because the movements are relatively unambiguous because the denominator population is not particularly sensitive to the cycle (unlike the labour force).
The following graph shows the US Employment-Population from January 1950 to November 2025.
The peak level in September 2020 before the pandemic was 61.1 per cent.
Unemployment and underutilisation trends
The first graph shows the official unemployment rate since January 1994.
The official unemployment rate is a narrow measure of labour wastage, which means that a strict comparison with the 1960s, for example, in terms of how tight the labour market, has to take into account broader measures of labour underutilisation.
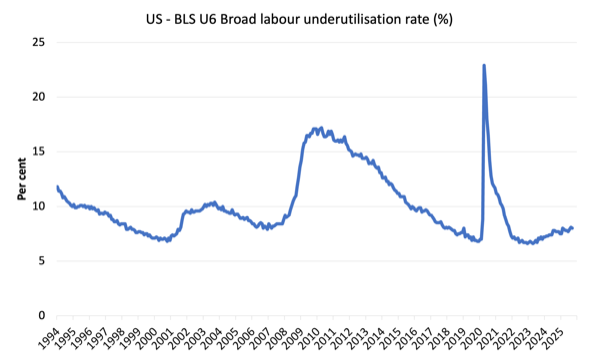
The next graph shows the BLS measure U6, which is defined as:
Total unemployed, plus all marginally attached workers plus total employed part time for economic reasons, as a percent of all civilian labor force plus all marginally attached workers.
It is thus the broadest quantitative measure of labour underutilisation that the BLS publish.
Pre-COVID, U6 was at 6.8 per cent (January 2019).
In November 2025, the U6 measure was 8.7 per cent whereas it was 7.5 per cent at the start of the year (see below).
The Trump 2 effect – the “best is yet to come”!
The US unemployment rate has risen by 0.6 points since Trump took office in January 2025.
It makes Trump’s the “best is yet to come” narrative pale somewhat.
There are now 982 thousand more Americans unemployed since January 2025 and 154 thousand (net) less in paid employment.
So the official unemployment rate has risen from 4 per cent in January 2025 and is now at 4.6 per cent and rising.
Further, the broad underutilisation rate (the sum of official unemployment and underemployment) is now at 8.7 per cent, a rise of 1.2 points since Trump 2 began.
That increase represents an extra 2,509 thousand workers since January 2025 who are not working in one way or another.
But the “best is yet to come” according to the President.
The reality is even worse because the US is a divided society where the difference in economic outcomes between the ‘advantaged’ (mostly white) and ‘disadvantaged’ (Black) is large and getting larger.
The ethnic breakdown is as follows:
- The aggregate unemployment rate has risen 0.6 points since Trump resumed office (Males 0.6 points; females 0.6 points).
- White unemployment rate has risen 0.4 points (white men 0.5, women 0.1).
- Black unemployment rate has risen 2.1 points (black men 1.3, women 2.7)
- Hispanic unemployment rate has risen 0.2 points.
The black-to-white unemployment ratio now stands at 2.13 whereas in February 2025 it was 1.6.
And it is probably worse than the BLS data indicates.
When the US Federal Reserve Bank cut interest rates last week (December 10, 2025), at the Press Conference to announce the decision – Press Conference Transcript (PDF) – the Federal Reserve boss, Jerome Powell said of the BLS estimates:
First of all, gradual cooling in the labor market has continued … We think there’s an overstatement in these numbers by about 60,000. So that would be negative 20,000 per month. And, also, just to point out one other things, surveys of households and businesses both showed declining supply and demand for workers, so I think you can say that the labor market has continued to cool gradually, maybe just a touch
more gradually than we thought.
Conclusion
While it must be tough working at the BLS these days, with the job cuts, the accusations from conservatives about the veracity of the data, and the difficulty in conducting surveys, the latest monthly data shows payroll employment barely rose, continuing a weakening trend over the last year.
The unemployment rate is now higher than it was pre-COVID 19 and underemployment is also ramping up – wasting the labour resources of millions of workers in the US.
The data is increasingly driving a wedge between the official political narrative and the reality on the street.
It is also showing a widening gap within US society between those who ‘have’ and those who ‘have not’.
What a place!
That is enough for today!
(c) Copyright 2025 William Mitchell. All Rights Reserved.
Can we get a quotable Bill Mitchell piece on the recent “hair on fire” in the finance sector over the “yen carry trade” from the JCB 25 basis point “hike”. Storm in a teacup as portfolios rebalance a tad?
Bill’s view on this “housing first”
https://borgenproject.org/homelessness-in-norway-eliminated/
https://en.wikipedia.org/wiki/Housing_First
Google AI: “Immediate Housing: People experiencing homelessness, regardless of their support needs (addiction, mental health, etc.), are offered a permanent home right away, often with a rental agreement.
Intensive Support: Once housed, individuals receive tailored, long-term support services (social workers, health professionals) to help them manage daily life and recovery.
No “Readiness” Test: Unlike traditional models, individuals don’t need to prove sobriety or stability before getting housing.”