Today (January 22, 2026), the Australian Bureau of Statistics (ABS) released the latest labour force…
Maybe the unemployment rate has peaked
Today and tomorrow I am hosting a workshop – ARCRNSISS Methods, Tools and Technologies workshop in Newcastle for the Spatially integrated social science research network that I am part of. This is a technical workshop on regional modelling which I host annually. So back to back with the CofFEE Conference last week means we have been very busy. I will write a blog about the work we do in the regional science area another day (it is very technical). But today the Australian Bureau of Statistics (ABS) published the November Labour Force Survey data and it shows that full-time employment is growing and the unemployment rate has fallen (by 0.1 per cent to 5.7 per cent). While underemployment is constant, the data suggests that the negative impact on the labour market may have peaked. But as I caution in this blog, regional disparities are huge and it is not the time to start talking about fiscal contraction.
Earlier in the week, the Olivier recruitment group released its Job Index – see Press Release for summary and the full Australian Market Report. The Jobs Index is based on analysis of Internet jobs advertisements.
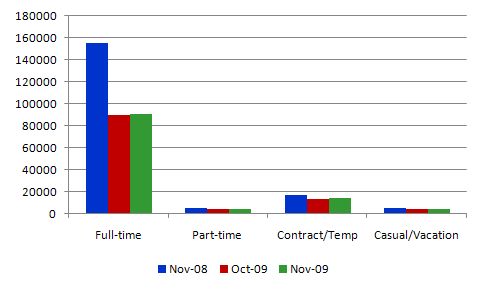
The following graph is reconstructed from the November Oliver Australian Jobs Index and compares four categories of job vacancies at November 2008, October 2009 and November 2009. For the twelve months to November 2009, full-time vacancies fell by 38.3 per cent compared to a monthly growth (October 2009-November 2009) of 5.9 per cent. Part-time vacancies fell annually by 14.2 per cent and grew by 4.6 per cent in the month to November 2009. Contract vacancies fell by 18.2 per cent over the year but in the last month grew by 5.8 per cent. Finally Casual/Vacation vacancies 3.1 per cent over the year and grew by 1 per cent in the last month.
Olivier claim that the November recovery reflects a “dominance full-time opportunities in November” and “is a major development in the employment market” in terms of the growth in underemployment over the course of this downturn. They argue that “if employers can hire full time permanent staff they will. We are likely to see a reduction in the level of underemployment and an increase in the official count of hours worked in Q1 2010 as employers also bring staff back into full time employment”.
So that news raised expectations that today’s ABS Labour Force data would ratify the trends being signalled by the Internet vacancies data produced in the Oliver survey.
The summary ABS Labour Force Survey results for November are:
- Employment (measured in persons) increased 31,200 (up 0.3 per cent) with full-time employment dominant the increase (rising by 30,800) and part-time employment barely rising (up 300).
- Unemployment increased 13,300 to 653,100.
- The official unemployment rate (persons) decreased 0.1 percentage points to 5.7 per cent. The male unemployment rate increased 0.2 percentage points to 6.0 per cent and the female unemployment rate remained at 5.6 per cent.
- The labour force participation rate fell by 0.1 per cent to 65.2 per cent and is still well down from its most recent peak (April 2008) of 65.6 per cent. So the approximate number of workers that have dropped out due to falling hours of work in the downturn (that is the rise in hidden unemployed) is 69.8 thousand persons.
- Aggregate monthly hours worked increased 13.4 million hours (0.9%). This is still below 0.5 per cent below the October 2008 peak.
- Total underemployment (ABS persons-measure) remained constant at 7.8 per cent.
- Total labour underutilisation (sum of official unemployment and underemployment) declined in line with the fall in the unemployment rate from 13.6 per cent to 13.5 per cent.
- Total labour underutilisation for 15-24 year olds is 26.3 per cent. Our gift to the next generation courtesy of an idle government.
Some of the reactions reported in the press today include:
The ABC News commentary headlines with – Jobs surge, unemployment falls. The Report says that the data is better than the outcomes expected by economists – “The result shocked economists” – even though I suspect their sample of “economists” is the usual bank economists the ABC wheels out these days to provide expert commentary.
The reaction of the Federal Opposition was comical – they are taking credit for it because they ran budget surpluses for 10 out of their 11 years in office. Once you understand modern monetary theory you will realise that the deficits actually held the level of labour underutilisation much higher than it should have been over their entire period of office. They could have achieved true full employment (2 per cent unemployment; zero underemployment and zero hidden unemployment) if they had have conducted fiscal policy more responsibility. The surpluses represented a decade or so of lost opportunity – they were the act of vandals.
Anyway, the question that is now being asked by all commentators is whether the unemployment rate has peaked. Most agree that is has.
The other issue being canvassed today is the impact on the central bank. The “market economists” all concluded that the central bank (RBA) will now continue hiking interest rates in the new year (next meeting February). I cannot see the point of that but I agree that the RBA is now locked itself in (given its pavlovian mentality) to a continuing period of interest rate increases.
I gave an interview for national ABC PM program (tonight’s edition) . At the time of writing the transcript or audio is yet to be made available by the ABC.
I was asked whether this was a victory for Keynesianism. I replied that I thought that all the academics and policy makers who for years have been saying that fiscal policy is ineffective and hence we had to rely primarily on monetary policy – should now eat their words.
I was also asked whether I thought this was now indicating that the unemployment rate had peaked. I replied that since June we have been thinking that the peak would be lower than we first forecast at the outset of the recession and before the significant fiscal intervention was implemented. However, now I consider that in the absence of another negative demand shock (which might come from the US commercial real estate market melting down) – that the unemployment rate will not rise much above the current level.
I was then asked whether the calls today by the Federal Opposition to immediately wind back the fiscal stimulus was indicated by the better than expected labour market data. I replied that it would be madness to cut back now. Domestic spending is still weak and the latest net exports data indicated that we will expect a contraction from that area in the national accounts to be published on Wednesday December 16, 2009.
I also noted that the labour market data relates to the national level. The Small Area Labour Market data released recently by Department of Education, Employment and Workplace Relations showed that some regions had very high unemployment rates. For example, Blacktown – South-West (Western Sydney) has 14 of its labour force unemployed; Fairfield – East – 12 per cent; Brewarrina (Western NSW) – 15.1 per cent; Greater Dandenong – Dandenong (Outer south west Melbourne) – 12.1 per cent; Kingston – 17.1 per cent and Woodridge – 17.0 per cent (Outer south-west Brisbane), Onkaparinga – North (South Adelaide) – 13.1 per cent and Playford -Elizabeth (North Adelaide) – 20.8 per cent.
So while the national average unemployment is 5.7 per cent, some areas are enduring a massive jobs crisis. I argued that there is a need job creation policies to ensure that these regions do not miss out of the recovery. While I prefer the government introduces a Job Guarantee on a national basis, I realise that it will not easily be persuaded to do that. But it might be persuaded to introduce a version of the JG in the areas where unemployment is high and will deliver huge disadvantage to the citizens of these areas which will span generations.
Those who are falling into joblessness have a high probability of having grown up in a jobless household themselves. We now have some longitudinal data in Australia and there is evidence emerging that children who have grown up in households that lost jobs in the 1991 recession are now highly likely to be experiencing disadvantage as they approach adulthood themselves.
Participation declines
The labour force participation rate fell by 0.1 per cent to 65.2 per cent and is still well down from its most recent peak (April 2008) of 65.6 per cent. So 69.8 thousand persons less are in the labour force (approximately) because of the downturn. These are the hidden unemployed.
So the official unemployment rate is actually understating the true jobless that has arisen as a result of this recession. To estimate that I did some simulations.
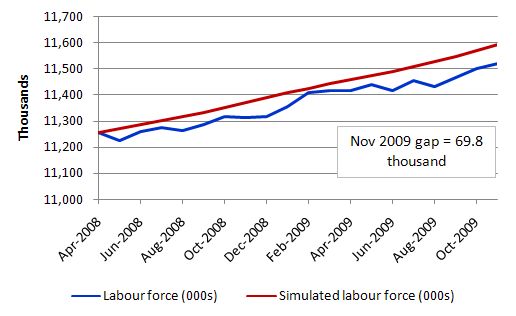
The following graph shows the actual labour force since April 2008 (blue line) and the simulated labour force (red line) derived by assuming that the actual Working Age Population growth combines with the labour force participation as at April 2008 (the high point in the last cycle). The gap between the lines is due to the decline in labour force participation and will be mostly due to discouraged worker effects (hidden unemployed). At November 2009 the gap equalled 69.8 thousand. This adds to the hidden unemployment that was present at the start of the downturn (about 1 per cent).
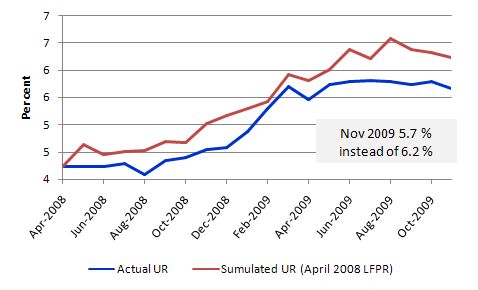
The following graph shows what the unemployment rate would have been if the extra workers had have remained in the labour force and were counted as unemployed. If the extra 69.8 thousand workers who dropped out of the labour force were added back into the labour force as unemployed, the official unemployment rate would be 6.2 per cent rather than 5.7 per cent. The participation rate is held constant at its April 2008 value.
Unemployment
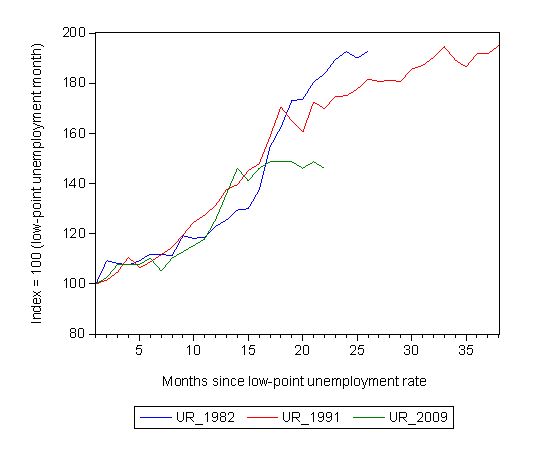
The following graph updates my 3-recessions graph. It depicts how quickly the unemployment rose in Australia during each of the three major recessions in recent history: 1982, 1991 and now 2009. The unemployment rate was indexed at 100 at its lowest rate before the recession in each case (June 1981; November 1989; February 2008, respectively) and then indexed to that base for each of the months until it peaked. It provides a graphical depiction of the speed at which the recession unfolded (which tells you something about each episode) and the length of time that the labour market deteriorated (expressed in terms of the unemployment rate).
From the start of the downturn to the 22-month point (the length of the current deterioration since February 2008), the official unemployment rate has risen from a base index value of 100 to a value 146.2 – a 46.2 percent rise. At the same stage in 1991 the rise was 69.9 per cent and in 1982 83.7 per cent, and both indexes were still rising. So things are very different this time.
While the unemployment rate was tracking the severity of the 1991 recession up until month 16, it is now clear that it is rising more moderately compared to the rate of decline back then. Note that these are index numbers and only tell us about the speed of decay rather than levels of unemployment. Clearly the 5.7 per cent at this stage of the downturn is lower that the unemployment rate was in the previous recessions at a comparable point in the cycle.
The graph suggests that we might have seen the peak of the unemployment rate – that is, in the absence of any further negative shocks and as long as the fiscal stimulus is not prematurely wound back. That would be a very good result and it would be hard not to credit the effectiveness of the fiscal stimulus.
Hours worked
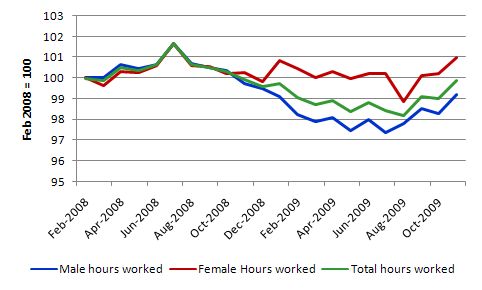
One of the hallmarks of this recession has been the sharp decline in hours worked as firms reacted to the falling sales by adjusting their offering of hours rather than laying off workers. This decline in hours worked started to reverse in September (as employment resumed growth) and is now looking like a robust trend. It is interesting that in the declining period, males endured a larger proportion of the losses than females (which was another distinguishing feature of this recession compared to past episodes). Now that hours worked are growing again, males are starting to close the gap lost.
Broad labour underutilisation
What about underemployment?
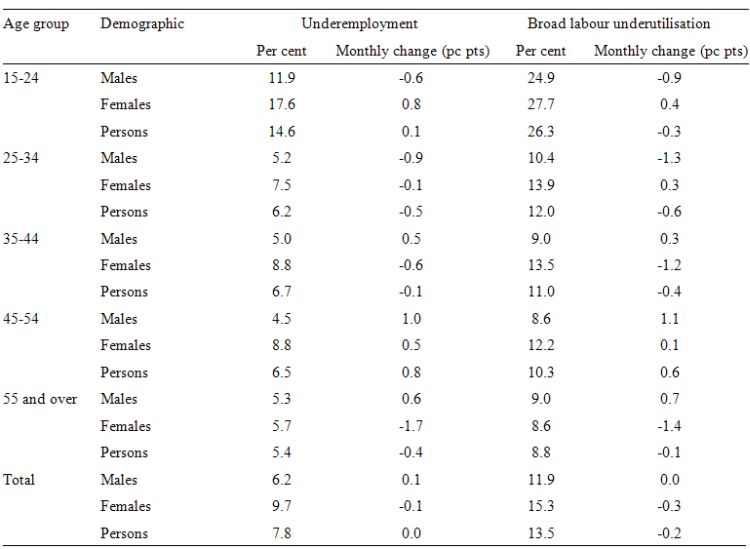
The following table was constructed from the ABS Labour underutilisation by Age and Sex data as at November 2009. It shows the underemployment rate and the total labour underutilisation rate (in percent) and the change in each (in percentage points) between October and November.
It should be noted that the total labour underutilisation measure is the ABS definition (unemployment and underemployment) and hence excludes hidden unemployment.
You should reflect on the discussion above about hidden unemployment to realise that the total labour underutilisation rate published by the ABS is an underestimate of the broadest measure that would be reasonable. We will be updating the CofFEE Labour Market Indicators for November in a week or so once all the underpinning data is released.
So there has been no change in underemployment even though hours worked has increased. This means that even though growth in full-time employment has dominated the total employment change in the last two months, part-time workers who desire more hours of work are not participating in the hours increase.
Further, broad labour underutilisation is down by 0.2 percentage points which is a combination of the modest decline in official unemployment and the easing participation rate.
The Table also provides information on the demographic (age-gender) distribution of the broader labour underutilisation measures. Younger males (up to 34 years) have enjoyed a decline in underemployment whereas prime-age and older males are enduring rising underemployment.
The stand-out figure is that 26.3 per cent of the 15-24 years aged group is underutilised and largely ignored by government policy. That means that more than one-quarter of our young talent is either without a job or has a job that is not providing enough hours of work to satisfy their preferences.
When I hear commentators making spurious arguments that the increased public deficits will leave a burden of debt that will weigh heavily on our future generations I always think of this sort of figure.
The largest burden will we leave to our children is our refusal of our government to provide enough jobs for them to build capacity and careers. It is patently clear that the private sector is not providing enough work. That leaves only one sector – the public sector – and unfortunately for our youth that sector is in denial about the problem.
Conclusion
The labour market looks like it has reached its trough which means that the process of recovery is occurring. If the unemployment rate has peaked then that is a considerably better outcome than we expected 12 months ago. We have demonstrated that our economy is responsive to early fiscal intervention and the focus on spending rather than financial bailouts has definitely helped limit the extent of the job losses.
However, there are still regions which have endured a devastating recession and so the policy response should be targetted to create jobs in those areas.
All the talk in Australia among the commentators and business economics now is that the government has to engage in policy contraction. I do not think it is time to do that. The upturn in the cycle will see the fiscal position move towards a lower deficit anyway.
Right now we need stronger employment growth with a regionally-targetted focus.
Another outstanding post.
Off topic: Could you do a post on a broader/philosophical question??? Has the Fed’s massive intervention effected a fundamental change in the free market system…or is that overstating the case?
It seems to be that the Fed is more than a participant in the markets now. It has become a de facto agent of the broken financial institutions it has deemed To Big Too Fail—which is no different than saying that the state has been subsumed by the banks, and what’s good for the banks is good for America. Naturally, this has created a bifurcated market where lavish subsidies are passed along to big finance, while the real economy languishes in a low grade depression.
My question–in a technical sense–Is this still a “free market” or central planning?
It’s obvious – minimum wage laws need to be abolished otherwise the RBA will be forced to increase interests rates. (rolling eyes).
“It’s obvious – minimum wage laws need to be abolished otherwise the RBA will be forced to increase interests rates. (rolling eyes).”
Tony Abbot’s gaffe the other day that each and every interest rate rise from now on is the fault of the governments spending seems to suggest that the mad monk believes that the RBA would have forever left interest rates at near historic lows if it hadn’t been for the stimulus.
Is he saying that the RBA now officially consider 3%-3.75% to be the new “neutral” band (I know wwhat MMT has to say about this but the RBA calls the shots here and everyone knew what they were always going to do sooner or later, regardless of the government’s fiscal approach).
On a related topic, did anyone read Alan Wood in yesterday’s Australian (I think the article is gone now). He appears to argue that the reason Gail Kelly and co hiked their banks rates so much above the RBA’s increase because the banks don’t really want to get into too much mortgage lending at the moment.
Because deposit rates are down.
Because banks need deposits before they can lend.
It occurrs to me that if they are trying to attract as many deposits as possible, shouldn’t the interest they pay on savings accounts etc suddenly become much better?
Or maybe since the RBA would not have (I assume) raised rates if it believed that the economy was remaining recessed and was not showing signs of recovery – maybe what Abbot really means to say is “gee, what the RBA is doing seems to suggest that fiscal policy is pretty effective after all”.
But then, since he appointed to shadow environmental portfolio, someone who thinks that global warming is “a vast left-wing conspiracy to de-industrialise the world” and to shadow industrial relations, an anti-union campaigner and workchoices warrior – well it’s a bit hard to know exactly what might go on in Tony’s head.
I am sorry about being off topic but on the rba website the functions of the bank are described in terms that sound similar to a regular bank for the goverment. Particularly the bit about term deposits. See link: http://www.rba.gov.au/FinancialServices/banking_services.html
Does this mean the bank does hold a “balance” for the Aust Gov.?
Good point.
Is there anything the government sector can do to try to encourage the private sector to provide more work? Let’s assume we have an ELR in place. Do you then declare victory as there is no unemployment, or do you still try to influence private sector employment, and if so, then what levers do you use and when?
loans create deposits.
“loans create deposits.”
Exactly Alan. Bill, yourself and others have taught me that. But can can you convince Alan Wood (or policy makers for that matter)?