In addition to the basis academic research that occupies my working time and is funded…
Real wages in Australia decline for the third consecutive quarter
Today (August 19, 2026), the Australian Bureau of Statistics released the latest – Wage Price Index, Australia – for the June-quarter 2026, which shows that the aggregate wage index rose by 3.2 per cent over the 12 months down from 3.4 per cent in the March-quarter. With the annual inflation rate for the June-quarter came in at 3.7 per cent, workers once again had to endure real wage cuts, which is not consistent with an economy that is overheating and running short of resources. It also reflects badly on the constant claims from RBA officials including the governor that unemployment is still not low enough and the ‘tight’ labour market is contributing to the slightly elevated inflation rate. Nothing could be further from the truth and this data demonstrates that.
Latest Australian data
The Wage Price Index:
… measures changes in the price of labour, unaffected by compositional shifts in the labour force, hours worked or employee characteristics
Thus, it is a cleaner measure of wage movements than say average weekly earnings which can be influenced by compositional shifts.
The summary results (seasonally adjusted) for the June-quarter 2026 were (the last-quarter result is shown in brackets):
| Measure | Quarterly (per cent) | Annual (per cent) |
| Total hourly wages | 0.8 (0.8) | 3.2 (3.3) |
| Private hourly wages | 0.7 (0.8) | 3.1 (3.2) |
| Public hourly wages | 0.9 (0.5) | 3.4 (3.3) |
| All groups CPI measure | -0.1 (1.4) | 3.7 (4.1) |
| Trimmed mean inflation | 0.3 (0.1) | 3.6 (3.5) |
| Weighted median inflation | 0.3 (0.2) | 3.7 (3.5) |
On price inflation measures, please read my blog post – Inflation benign in Australia with plenty of scope for fiscal expansion (April 22, 2015) – for more discussion on the various measures of inflation that the RBA uses – CPI, weighted median and the trimmed mean.
The latter two aim to strip volatility out of the raw CPI series and give a better measure of underlying inflation.
They are showing no signs of an inflation outbreak.
The ABS press release – Annual wage growth of 3.2% in June quarter 2026 – notes that:
The Wage Price Index (WPI) rose 0.8 per cent in the June quarter 2026 and 3.2 per cent annually (seasonally adjusted) …
Annual wage growth of 3.2 per cent is slightly down from 3.4 per cent at the same time last year …
Jobs with a wage change of less than 4 per cent over the last 12 months rose to 79 per cent, from 75 per cent in June quarter 2025. This is the largest share recorded since June quarter 2022 (+84%).
… The decline in the share of jobs with larger wage rises has contributed to slower wage growth overall …
Summary assessment:
1. Wages growth declining – no outbreak evident nor was there ever any evidence of that..
2. Nominal wages growth has been going backwards and real wages falling.
3. Real wages have declined in the last 3 consecutive quarters and are now 6.4 per cent lower than they were in the June-quarter 2020.
4. It tells you how far out of touch the technocrats in the RBA have become – and they are still claiming in their recent monetary policy statement that unemployment has to rise further.
2. Over the last 25 quarters, there have been only ten that have delivered real wages growth.
Real wage trends in Australia
The summary data in the table above confirms that real wages growth overall (private and public sectors) has been in decline for the last four quarters and negative for the last three after a recovery following the 10 quarters of cuts in the Covid inflation period.
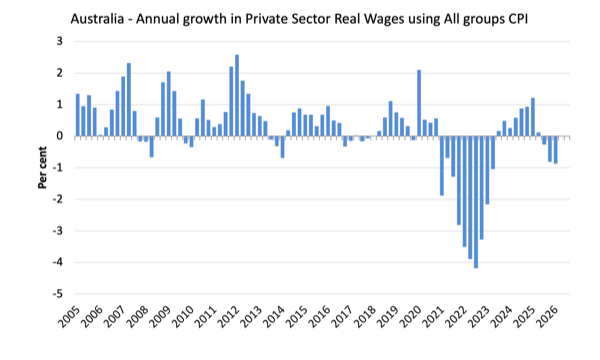
The following graph uses the All groups CPI to show the movement of real wages in the private sector from 2005 to the June-quarter 2026.
The fluctuation in mid-2020 is an outlier created by the temporary government decision to offer free child care for the June-quarter which was rescinded in the June-quarter of that year.
Overall, the record since 2015 has been appalling.
Throughout most of the period since 2015, real wages growth has been negative with the exception of some partial catch-up in 2018 and 2019 and more recently after the COVID-19 supply shock abated somewhat.
Since that COVID-19 shock, despite some real wages gains in some quarters, the overall real wage has slumped by 6.4 per cent.
The inflation that we are witnessing, and witnessed during the COVID-19 disruptions, is not being driven by the labour market, which means that it is not a capacity constrained event.
The great productivity rip-off continues
While the decline in real wages means that the rate of growth in nominal wages is being outstripped by the inflation rate, another relationship that is important is the relationship between movements in real wages and productivity.
As part of their attempt at justifying the interest rate hikes, the RBA have also been making a big deal of the fact that wages growth is too high relative to productivity growth.
Historically (up until the 1980s), rising productivity growth was shared out to workers in the form of improvements in real living standards.
In effect, productivity growth provides the ‘space’ for nominal wages to grow without promoting cost-push inflationary pressures.
There is also an equity construct that is important – if real wages are keeping pace with productivity growth then the share of wages in national income remains constant.
Further, higher rates of spending driven by the real wages growth can underpin new activity and jobs, which absorbs the workers lost to the productivity growth elsewhere in the economy.
The following graph which shows the total hourly rates of pay in the private sector in real terms deflated with the CPI (blue or lower line) and the real GDP per hour worked (from the national accounts) (green or upper line) from the June-quarter 1999 to the June-quarter 2026.
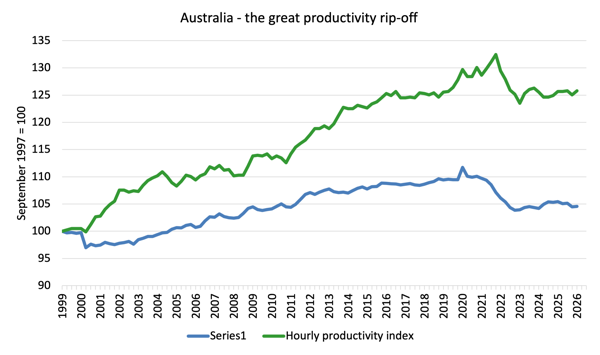
It doesn’t make much difference which deflator is used to adjust the nominal hourly WPI series. Nor does it matter much if we used the national accounts measure of wages.
But, over the time shown, the real hourly wage index has grown by only 4.6 per cent, while the hourly productivity index has grown by 25.8 per cent.
The dip in productivity growth is mostly due to the parlous investment rates of Australian businesses as investment funds have been shifted into the financial markets chasing short-term profiteering.
If I started the index in the early 1980s, when the gap between the two really started to open up, the gap would be much greater. Data discontinuities however prevent a concise graph of this type being provided at this stage.
For more analysis of why the gap represents a shift in national income shares and why it matters, please read the blog post – Australia – stagnant wages growth continues (August 17, 2016).
Where does the real income that the workers lose by being unable to gain real wages growth in line with productivity growth go?
Answer: Mostly to profits.
These blog posts explain all this in more technical terms:
1. Puzzle: Has real wages growth outstripped productivity growth or not? – Part 1 (November 20, 2019).
2. Puzzle: Has real wages growth outstripped productivity growth or not? – Part 2 (November 21, 2019).
Conclusion
In the June-quarter 2026, Australia’s annual nominal wage growth was 3.2 per cent, while the inflation rate over the same period was 3.7 per cent.
Real wages once again fell – third consecutive quarter.
These trends make a mockery of the RBA claims that the labour market is too tight and contributing to the inflation rate via excessive wages pressure.
That is enough for today!
(c) Copyright 2026 William Mitchell. All Rights Reserved.

Bill, thanks for your insights and effort.
In case you missed this one
Ross Gittins, ‘Australia is running deficits – and leaving the bill to the kids,’ August 20, 2026
https://johnmenadue.com/post/2026/08/australia-is-running-deficits-and-leaving-the-bill-to-the-kids/
The final 2 sentences are the clincher:
“But don’t forget this: what all these budget deficits mean is that we’re not being asked to pay as much tax as the cost of the services we’re getting requires. Nar, leave our bill for the kids.”
This is a real “emperor’s new clothes” moment for the RBA.
Their raison d’être has been revealed – to provide cover for the banksters to maintain the real interest rate.
That cover is not even a fig leaf to anyone paying attention.