I am travelling a lot today and so this is just a brief reflection on…
Australian national accounts – subdued conditions continue amidst an EV purchasing boom
The Australian Bureau of Statistics (ABS) released the latest – Australian National Accounts: National Income, Expenditure and Product, June 2026 – today (September 2, 2026). This data is now starting to reflect the full impacts of the Middle East disruptions and the interest rate impacts arising from the recent hikes in rates from the RBA. The economy is slowing and really only being held up by the household consumption and exports of fossil fuels. Interestingly, the maintenance of household expenditure is being driven by a surge in demand for electric cars in the face of the rising petrol costs.The fast-tracking of this transition is welcome. The boom in private business investment arising from the data centre expenditure appears to have, for now, peaked in the March-quarter 2026. I expect the economy to remain subdued for the next few quarters.
The main features of the National Accounts release for the June-quarter 2026 were (seasonally adjusted):
- Real GDP increased by 0.4 per cent for the quarter (0.3 per cent last quarter). The annual growth rate was 2.1 per cent (2.5 last quarter).
- GDP per capita was unchanged (-0.1 per cent last quarter) and rose 0.7 per cent for the year.
- Australia’s Terms of Trade fell 1.6 per cent for the quarter and 0.6 per cent over the 12 month period.
- Real net national disposable income, which is a broader measure of change in national economic well-being,was unchanged (0.4 last quarter) and 1.5 per cent over the 12 months (2.0 last quarter).
- GDP chain price index (a measure of price inflation) fell 0.6 per cent (+0.9 per cent last quarter) and rose 2.8 per cent over the 12 month period.
- The Household saving ratio (from disposable income) rose to 6.5 per cent from 6.4 per cent.
- GDP per hour worked was flat (-0.6 per cent last quarter) and fell -0.2 per cent for the year.
Overall growth picture – subdued economy continues
The ABS media release – Australian economy grew 0.4% in the June quarter – said that:
Australian gross domestic product (GDP) rose 0.4 per cent in the June quarter 2026 and 2.1 per cent compared to June quarter 2025 (seasonally adjusted, chain volume measure) ….
Economic growth remained subdued in the June quarter as households continued to behave cautiously. While increased spending and business investment occurred in pockets of the economy, imports supported much of the growth, moderating its contribution to overall GDP growth …
Household consumption rose 0.4 per cent in the June quarter with subdued spending across most categories. The Middle East conflict influenced spending behaviour with falls in fuel consumption in response to elevated prices, and reduced domestic and international travel.
Purchase of vehicles rose by 10.3 per cent as households continued to transition to electric vehicles …
Private business investment declined 0.5 per cent. Investment in machinery and equipment for data centre fit outs fell following a substantial rise in the March quarter. Investment in data centres remains at elevated levels. Increased purchases of planes and industrial transport equipment partly offset the quarterly fall …
Imports of goods rose 2.4 per cent driven by cars and planes. In contrast, imports of services fell 4.9 per cent as the Middle East conflict disrupted Australians’ international travel plans …
Exports rose 0.8 per cent driven by coal reflecting higher production, following weather disruptions in the March quarter. The rise in exports outpaced the rise in imports (up 0.5 percent). Net trade contributed 0.1 percentage points to GDP growth …
The household saving to income ratio remained stable, up from 6.4 to 6.5 per cent.
The short story:
1. Domestic demand is weakening as consumption remained subdued and the AI data centre investment peaks.
2. Contraction in support from the federal government.
3. Investment (private and public) building new capacity now falling from the peak and mostly driving import demand.
Quarterly GDP Growth
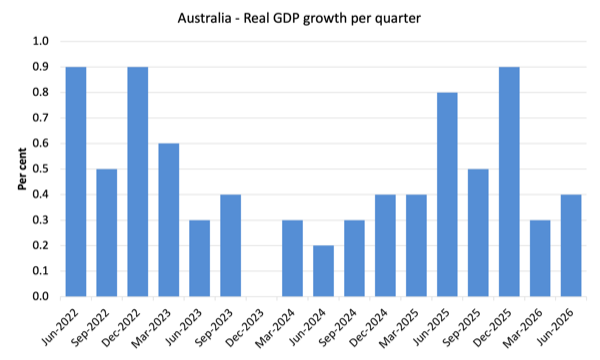
The next graph shows the quarterly growth since the June-quarter 2022.
In the June-quarter 2026, GDP growth weakened markedly.
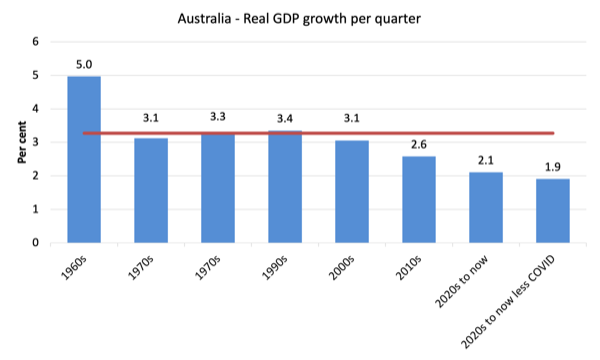
To put this into historical context, the next graph shows the decade average annual real GDP growth rate since the 1960s (the horizontal red line is the average for the entire period (3.27 per cent) from the September-quarter 1960 to the June-quarter 2026.
Although COVID severely interrupted the economy, once we take out the quarters between June 2020 and June 2022 (inclusive), then the average since 2020 has been 1.9 per cent per annum – very mediocre – and declining.
It is also obvious how far below historical trends the growth performance of the last 2 decades have been as the fiscal surplus obsession has intensified on both sides of politics.
Even with a massive household credit binge and a once-in-a-hundred-years mining boom that was pushed by stratospheric movements in our terms of trade, our real GDP growth has declined substantially below the long-term performance.
The 1960s was the last decade where government maintained true full employment.
GDP per capita was flat in the June-quarter
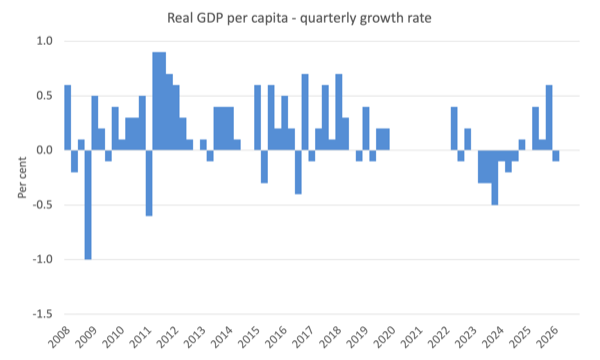
In the June-quarter 2026, GDP per capita was unchanged after falling by 0.1 per cent in the previous quarter.
While commentators focus on this statistics, the meaning of the average is questionable, given the highly skewed income distribution towards the top end.
What we can say is that if the average is declining, then those at the bottom are doing it very tough indeed.
The following graph of real GDP per capita (which omits the pandemic restriction quarters between December-quarter 2020 and December-quarter 2021) tells the story.
Note the last observation is zero so there is no visibility in the column graph.
Analysis of Expenditure Components
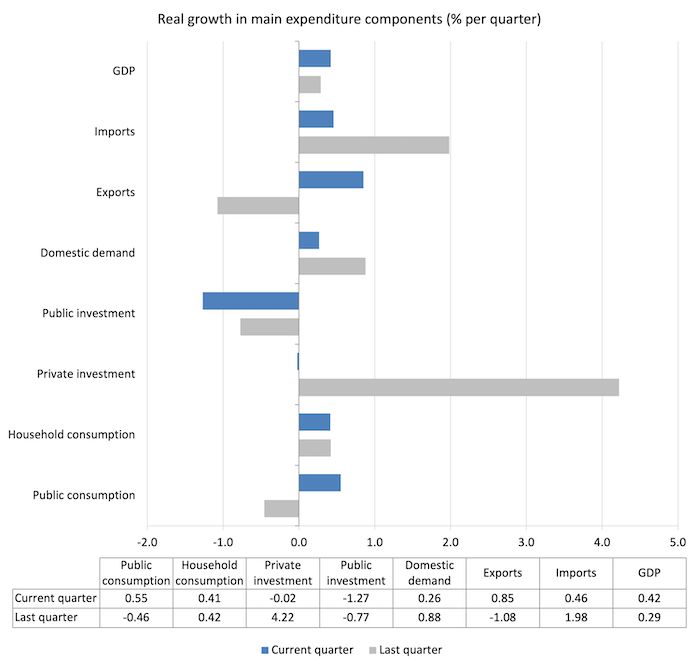
The following graph shows the quarterly percentage growth for the major expenditure components in real terms for the December-quarter 2025 (grey bars) and the June-quarter 2026 (blue bars).
Contributions to growth
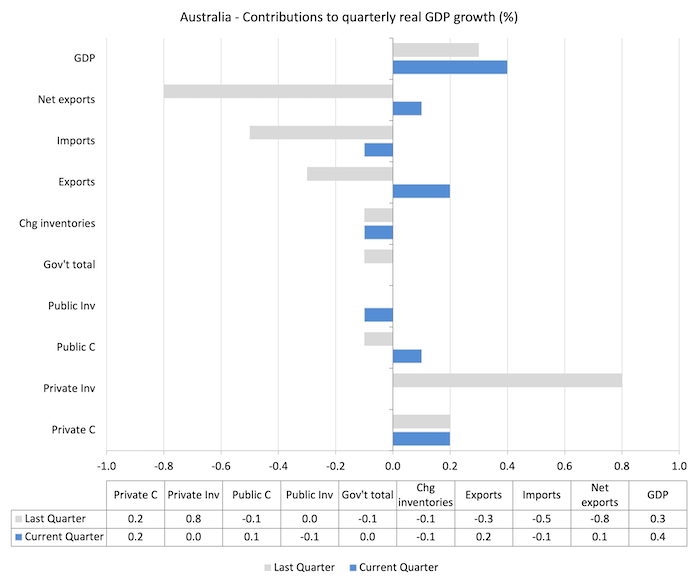
The following bar graph shows the contributions to real GDP growth (in percentage points) for the main expenditure categories. It compares the June-quarter 2026 contributions (blue bars) with the previous quarter (gray bars).
- Household consumption expenditure added 0.2 points (0.2 last quarter).
- Private investment expenditure added 0.0 points (0.8).
- Net exports added 0.1 point (last quarter -0.8) – the 0.2 point export contribution outweighed the -0.1 point import subtraction (remember positive import expenditure growth constitutes a loss of growth).
- Overall government contribution was zero (-0.1 last quarter) – the recurrent contribution was 0.1 point (-0.1) while the capital contribution was minus 0.1 point (+0.1 point).
Material living standards unchanged in the June-quarter 2026
The ABS tell us that:
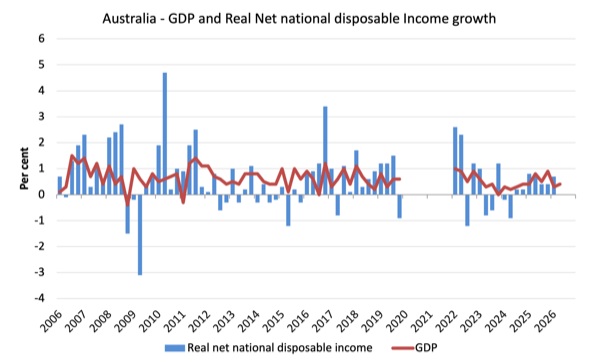
A broader measure of change in national economic well-being is Real net national disposable income. This measure adjusts the volume measure of GDP for the Terms of trade effect, Real net incomes from overseas and Consumption of fixed capital.
While real GDP growth (that is, total output produced in volume terms) rose by 0.4 per cent in the current quarter, real net national disposable income growth was unchanged.
How do we explain that?
Answer: The terms of trade fell by 1.6 per cent in the current quarter which offset the rise in compensation of employees (COE) of 1.5 per cent.
Productivity growth static
The sectoral productivity growth outcome were:
- Market sector: -0.2 per cent (annual), 0.2 per cent (quarter).
- Non-market sector: -0.3 per cent (annual), -0.1 per cent (quarter).
- Overall: -0.2 per cent (annual), zero per cent (quarter).
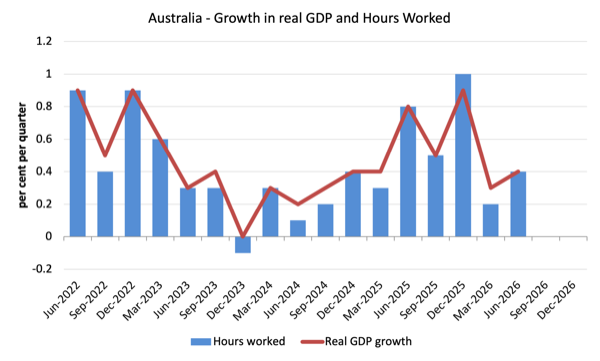
The following graph presents quarterly growth rates in real GDP and hours worked using the National Accounts data from the June-quarter 2022 to the June-quarter 2026.
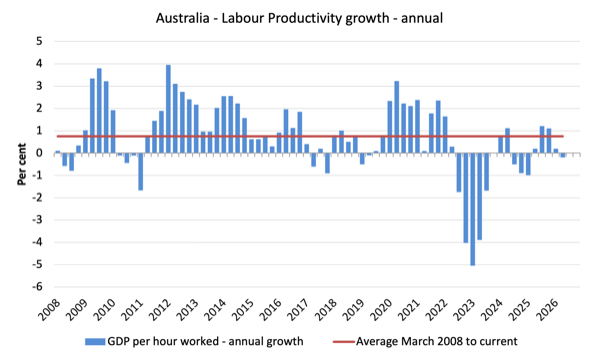
To see the above graph from a different perspective, the next graph shows the annual growth in GDP per hour worked (labour productivity) from the beginning of 2008 to the June-quarter 2026.
The horizontal red line is the average annual growth since the September-quarter 2008 (0.76 per cent), which itself is an understated measure of the long-term trend growth of around 1.5 per cent per annum.
Household saving ratio improves by 0.1 point
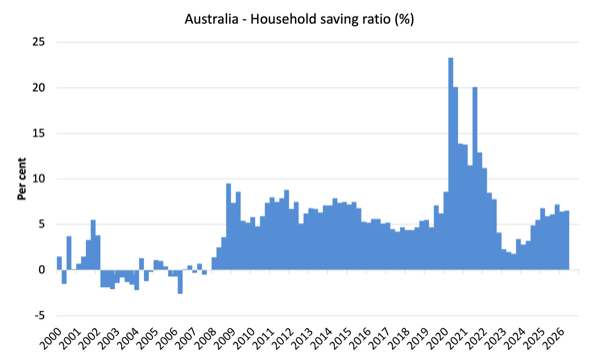
The following graph shows the household saving ratio (% of disposable income) from the December-quarter 2000 to the current period.
It shows the period leading up to the GFC, where the credit binge was in full swing and the saving ratio was negative to the rise during the GFC and then the most recent rise.
An increasing saving ratio provides the household sector overall with an increased capacity to risk manage in the face of uncertainty.
The next graph shows the saving ratio since 1960, which illustrates the way in which the neoliberal period has squeezed household saving.
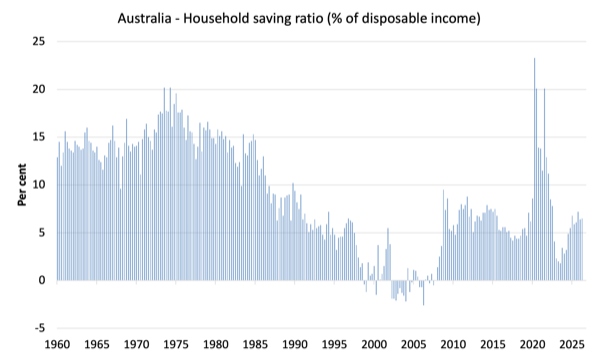
Going back to the pre-GFC period, the household saving ratio was negative and consumption growth was maintained by increasing debt – which is an unsustainable strategy given that household debt is so high.
Even though the ratio has been rising slightly in recent quarters, it is still well below past levels.
The following table shows the impact of the neoliberal era on household saving. These patterns are replicated around the world and expose our economies to the threat of financial crises much more than in pre-neoliberal decades.
| Decade | Average Household Saving Ratio (% of disposable income) |
| 1960s | 13.9 |
| 1970s | 16.0 |
| 1980s | 11.8 |
| 1990s | 4.8 |
| 2000s | 1.2 |
| 2010s | 6.2 |
| 2020s on | 8.6 |
| Since RBA hikes | 5.0 |
The distribution of national income
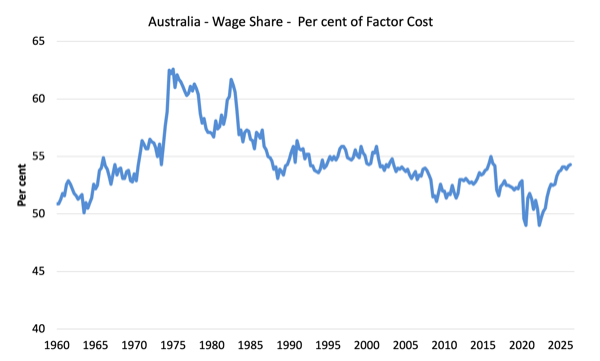
The wage share in national income rose to 54.3 per cent in the June-quarter 2026.
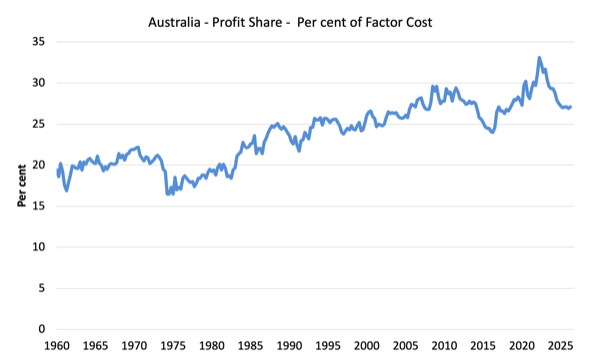
The profit share also rose by 0.2 points to 27.1 per cent.
The reason that both shares can rise in the same quarter is because the residual share – mostly government – has fallen.
The first graph shows the wage share in national income while the second shows the profit share.
The declining share of wages historically is a product of neoliberalism and will ultimately have to be reversed if Australia is to enjoy sustainable rises in standards of living without record levels of household debt being relied on for consumption growth.
Conclusion
Remember that the National Accounts data is three months old – a rear-vision view – of what has passed and to use it to predict future trends is not straightforward.
Further, this data is now starting to reflect the full impacts of the Middle East disruptions and the interest rate impacts arising from the recent hikes in rates from the RBA.
The economy is slowing and really only being held up by the household consumption and exports of fossil fuels.
Interestingly, the maintenance of household expenditure is being driven by a surge in demand for electric cars in the face of the rising petrol costs.
The boom in private business investment arising from the data centre expenditure appears to have, for now, peaked in the March-quarter 2026.
I expect the economy to remain subdued for the next few quarters.
Clarification on terminology
I advocate a degrowth strategy for the global economy overall given that our footprint is 1.7 times the capacity of the biosphere to regenerate.
To achieve that strategy, given that many poorer nations must continue to grow, will require rather substantial cut backs in spending and consumption in the richer nations.
When I analyse the National Accounts data or any expenditure/output data, I write as if growth is ‘good’.
But that terminology is used in the context that without economic growth and without any substantial shifts in income distribution and government transition policies, trying to pursue a recessionary strategy would damage the weakest members of our society disproportionately.
In some respects, I am abstracting from the damaging reality of our ecological footprint.
That is enough for today!
(c) Copyright 2026 William Mitchell. All Rights Reserved.

Bill
every so often I encounter an article by US economist Ellen Brown.
Her latest –
The Sovereign Reset: Escaping the Interest Trap with Greenbacks,
https://scheerpost.com/2026/09/02/the-sovereign-reset-escaping-the-interest-trap-with-greenbacks/ –
commences, thus:
“In August 2026, the U.S. debt reached a gravity-defying $40 trillion, with an estimated fiscal year 2026 deficit of $2.1 trillion. Interest on the debt hit a record $1.4 trillion over the last 12 months and now consumes more than any federal program except Social Security and Medicare, eclipsing defense spending for the first time in U.S. history. Paid with borrowed money, interest compounds exponentially, making it the fastest-growing part of the budget, far outpacing economic growth. By 2036, the Congressional Budget Office projects interest costs will double to $2.1 trillion, with debt held by the public reaching 120 percent of GDP. The CBO director has declared the trajectory to be “not sustainable.”
Increasingly, prominent analysts are saying the United States will have to “print” its way out. But using whose printing press, printing what? ”
Thought that her thoughts may be of interest to you.
best wishes
Graeme,
My understanding is that Ellen Brown is a passsionate advocate for public banking with a sound knowledge of the American system of finance introduced by Alexander Hamilton, which she promotes for the benefit of currency users. One of the best examples of a successful public bank often quoted in the US is the Bank of North Dakota which was originally started by pioneer farmers who were sick of being exploited by the commercial banks in the late 1800s.
She also has a detailed understanding of the intricate workings of the American financial system, but somehow seems to get confused between the the illusion of the US Government funding itself by by borrowing and the reality that it can create its own money if desired. The confusion continues as fiat money is proposed as a solution to financing government debt.
From my perspective, with the advantage of having been enlightened by Bill, I can’t understand where sufficient money could be imagined to come from to pay interest, allow development and accommodate a growing population, if not all from the government. I rate Ellen Brown highly for her public bank advocacy, but given her insights into the monetary system I’m confused as to why she hasn’t taken the obvious step to embrace MMT.
Dave Willson: It’s intriguing that someone trained in mainstream economics would fail to recognise that a currency-issuing central govt (CICG) can create money for itself for its own spending purposes – indeed, that a CICG could (and in fact does) finance all of its spending by creating the required money for itself.
When you study economics, mainstream textbooks misleadingly tell you that there are three ways that a central govt can fund its spending: (1) from tax revenue; (2) by borrowing from the non-govt sector by issuing bonds; and (3) by ‘printing’ (creating) money. Textbooks normally assume that govts will use all three methods to some degree (depending on prevailing economic circumstances).
Even if we take it to be true that a CICG uses a little of each means (a falsehood), there is nothing mentioned about the fact that all the spending could be financed from creating money. Nothing is mentioned because the author(s) would be at a loss to explain why there is a limit on the third option. If there is no limit on the third option, then options (1) and (2) are unnecessary. In fact, they effectively disappear as options. Why bother taxing and borrowing for spending purposes when you can create as much of the currency as you like at virtually no cost? Instead, mainstream economists assume that because the non-govt sector is taxed and the govt always issues bonds, this is as good as proof that the govt is limited in how much money it can create for its own spending purposes.
Where mainstream economists go wrong with this presumption is believing that an accounting identity that represents an after-spending financial outcome represents a before-spending funding constraint. This error comes about because mainstream economists do not understand the macroeconomic purpose of taxation and bond issuance. Yes, CICGs tax the non-govt sector and issue bonds, but every dollar of govt spending is a brand-new dollar that has been created and spent into existence. There is no recycling of existing ‘tax’ dollars or borrowing from the non-govt sector to finance govt spending.
The taxation is necessary to destroy sufficient non-govt spending power to enable the CICG to purchase real resources without it causing an excessive rate of price inflation (i.e., to free up real resources in order to reduce purchasing competition for available resources with the non-govt sector). If the non-govt sector wishes to net-save and alters its discretionary spending to ensure it achieves its net-spending target (i.e., S ‘greater than’ I), the required tax impost on the non-govt sector to prevent inflation is less than the govt’s spending (i.e., G ‘greater than’ T). This because the net-saving by the non-govt sector is sufficient to free up the required real resources without the govt having to destroy as much of the currency as it has injected into the economy through its own spending. The non-govt sector’s net-saving has ‘done the job’ that would ordinarily be performed by taxation. The only difference is that taxation ‘permanently’ destroys the currency whereas non-govt saving ‘temporarily’ moves the currency out of the spending process. If the non-govt sector later chooses to spend what it has saved, the CICG may have to destroy it, with taxation, to prevent a higher rate of inflation. I sometimes say to people who complain about being taxed that they should save more of their income to avoid the need for the govt to tax them!
The value of the govt spending not destroyed by taxation (i.e., G ‘greater than’ T) is usually issued in the form of bonds, thus appearing to finance the shortfall. However, the bonds are issued to drain the excess currency from the reserve accounts of financial institutions – which is the result of G ‘greater than’ T – to enable the central bank to set and defend its interest rate targets. However, this is only necessary because of the way the system operates. Instead of having an interest rate corridor (the difference between the target rate and the interest rate that the central pays financial institutions on excess reserves), the central bank could always rid the system of the corridor and set the interest rate it pays on excess reserves equal to the target rate. Thus, whenever G ‘greater than’ T, the interest rate would naturally settle at the rate paid on excess reserves without the need for the central bank to drain the excess reserves from the system. In other words, no need to sell bonds whenever G ‘greater than’ T to achieve the target interest rate. This would leave mainstream economists scratching their heads trying to explain how the (non-existent) shortfall is being funded. Of course, unbeknown to them, every dollar of govt spending is funded the moment the govt creates money and spends into existence. The taxation and bond sales are only required to prevent the govt’s spending triggering inflation and to allow the central bank, under current arrangements, to set interest rates. Nothing to do with the funding of CICG spending and no indication that the quantity of money that a CICG can create for its own spending purposes is limited!
Thanks Philip. With no economic training before MMT (thankfully) I wasn’t very clear on everything mainstream students are taught and how they try to make sense of it.