Last month, I noted that the sharp shift towards part-time work was the first signal…
Australian labour market – full-time jobs decline as unemployment continues to rise
The labour market contraction that I have been signalling for the last two months continued in August. The Australian Bureau of Statistics (ABS) released the latest labour force data today (September 24, 2026) – Labour Force, Australia – for August 2026 – which showed that the labour market deteriorated further in August, in that full-time employment growth was negative and unemployment rose. I suspect, however, that the September release will show some revisions to the data given the changes that the ABS are making to its survey collection model (see below). Overall, there are now 10.8 per cent of available labour not being used (either unemployed or underemployed), which makes a farce of the RBA’s claims that the labour market is tight. There is substantial scope for more job creation given the slack that is present.
The summary seasonally-adjusted statistics for August 2026 are:
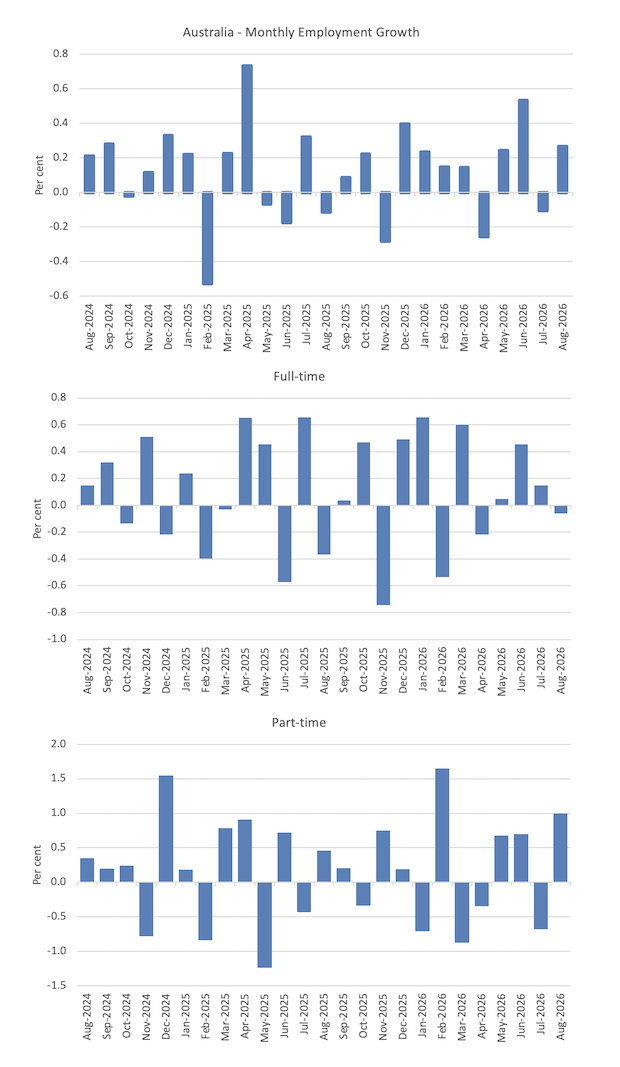
- Employment rose 39.5 thousand (0.3 per cent).
- Full-time employment fell 6.3 thousand (-0.1 per cent).
- Part-time employment rose 45.8 thousand (1.0 per cent).
- Unemployment rose by 28.2 thousand to 722.9 thousand persons
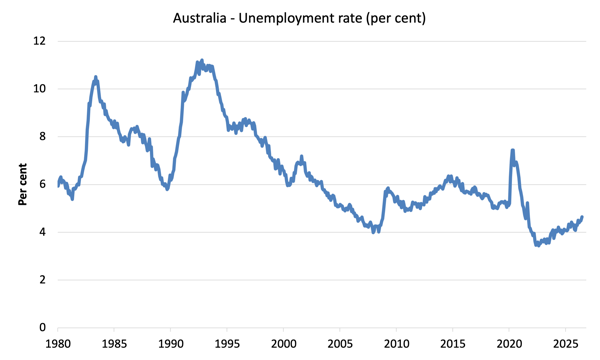
- The unemployment rate rose 0.2 points to 4.65 per cent.
- The participation rate rose 0.2 points to 67.1 per cent.
- The Employment-population ratio was steady on 63.9 per cent.
- Monthly hours worked rose 13.7 million (0.69 per cent).
- Underemployment fell by 0.1 point to 6.2 per cent – falling 18.9 thousand to 962.9 thousand.
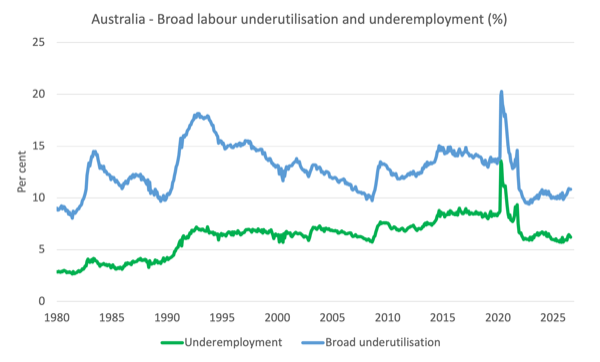
- The Broad Labour Underutilisation rate (the sum of unemployment and underemployment) was steady on 10.8 per cent – the rise in unemployment matching the fall in underemployment.
- Overall, there are 1,685.9 thousand people either unemployed or underemployed.
The ABS press release – Unemployment rate rises to 4.6% in August – noted that:
The seasonally adjusted unemployment rate rose to 4.6 per cent in August …
This month there was 39,000 more people in employment, and 28,000 more people in unemployment.”
Part-time employment rose by 46,000 people in August, while full-time employment fell by 6,000 people.
The ABS also issued a warning that the changes to the Labour Force Survey model could have had “an unintended impact on August 2026 estimates” although the impact was expected to be “smaller than normal sampling variability and that the August data is fit-for-purpose”.
Summary
1. Full-time employment continued to shrink.
2. The constant employment to population rate means we were marking time in terms of the balance between employment and underlying population growth.
3. The rise in participation is probably a statistical anomaly which will be revealed when the adjustments are made next month.
3. It is hard (impossible) to reconcile this data which the RBA governor’s recent claims that the labour market is still too tight and that unemployment needs to rise towards 5 per cent.
Employment growth modest and biased towards part-time jobs in August
The following graph shows the growth in total, full-time, and part-time employment for the last 24 months.
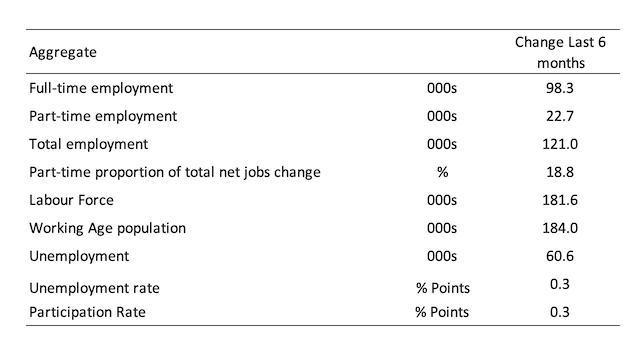
The following table shows the shifts over the last 6 months which helps to see the underlying trend.
The Employment-to-Population ratio provides a measure of the state of the labour market that is independent of the supply shifts in the labour market (driven by the shifts in the participation rate).
The underlying working age population grows steadily while the labour force shifts with both underlying population growth and the participation swings.
The following graph shows the Employment-Population ratio was stable on 63.9 per cent in August.
The next graphs show the average monthly change in total employment (first graph) and full- and part-time employment (second graph).
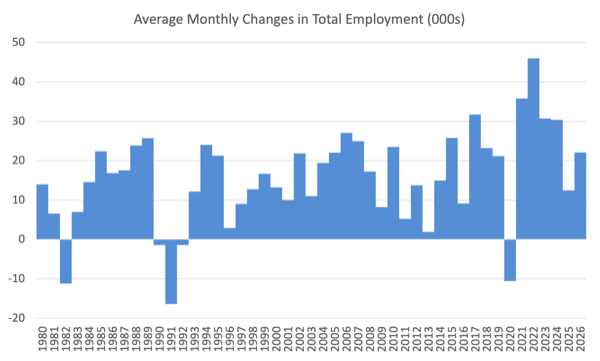
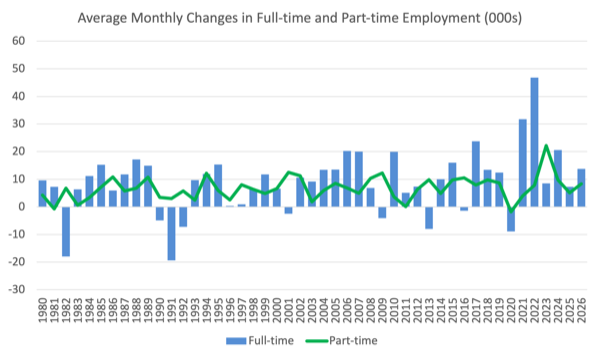
For total employment the monthly average changes were:
- 2022 – 46 thousand
- 2023 – 30.7 thousand
- 2024 – 30.4 thousand
- 2025 – 12.4 thousand
- 2026 to date – 22.1 thousand
Monthly hours worked rose 13.7 million (0.69 per cent) in August 2026
The following graph shows the growth in monthly hours worked for the last 24 months, with the straight line being a simple linear regression to indicate trend.

Unemployment rose by 28.2 thousand to 722.9 thousand persons
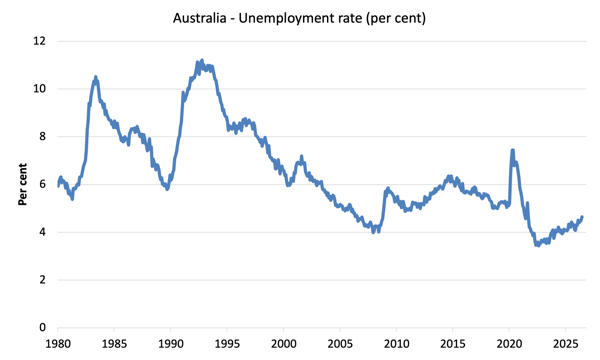
The unemployment rate rose 0.2 points to 4.65 per cent.
The following graph shows the evolution of the official unemployment rate since 1980.
What was the impact of the rising participation rate on unemployment in August 2026
Labour force participation rose 0.2 points in August.
The question is what would the unemployment rate have been, given the employment and population growth in August, if the participation rate had not also risen?
These concepts help us answer this type of question:
- The labour force is a subset of the working-age population (those above 15 years old). The proportion of the working-age population that constitutes the labour force is called the labour force participation rate. Thus changes in the labour force can impact on the official unemployment rate, and, as a result, movements in the latter need to be interpreted carefully. A rising unemployment rate may not indicate a recessing economy.
- The labour force can expand as a result of general population growth and/or increases in the labour force participation rates (and vice versa).
The following Table shows the breakdown in the changes to the main aggregates (Labour Force, Employment and Unemployment) and the impact of the fall in the participation rate.

The change in the labour force in August 2026 was the outcome of two separate factors:
- The underlying population growth added 23.7 thousand persons to the labour force. The population growth impact on the labour force aggregate is relatively steady from month to month; and
- The rise in the participation rate meant that there were 44 thousand MORE workers in the labour force (relative to what would have occurred had the participation rate remained unchanged).
- The net result was that the labour force rose by 67.7 thousand.
Assessment:
1. If the participation rate had not have risen in August 2026, total unemployment, given the current employment level, would have been 678.9 thousand rather than the official count of 722.9 thousand as recorded by the ABS – a difference of 44 thousand workers (the ‘participation effect’).
2. Without the rise in the participation rate, the official unemployment rate would have been 4.4 per cent rather than its current official value of 4.6 per cent.
Broad labour underutilisation – steady at 10.8 per cent in August 2026
The following graph shows the evolution of underemployment and the Broad labour underutilisation rate since 1980.
Teenage labour market – part-time jobs growth only in August
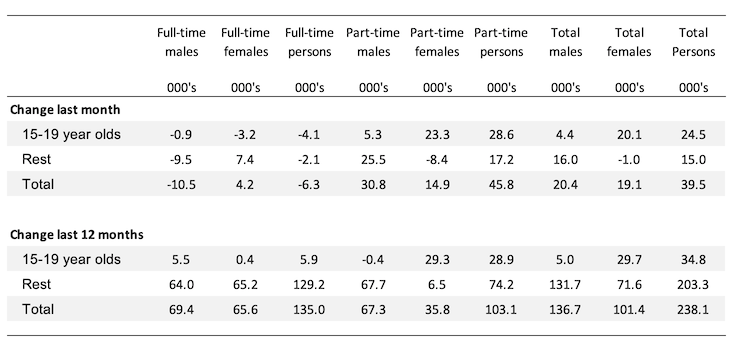
- Full-time employment fell 4.1 thousand (-2.0 per cent).
- Part-time employment rose 28.6 thousand (4.4 per cent).
- Total teenage (15-19) employment rose 24.5 thousand (2.9 per cent).
The following table summarises the shifts in the teenage labour market for the month and over the last 12 months.
To put these changes into a scale perspective (that is, relative to size of the teenage labour force) the following data reports the shifts in the Employment-Population ratio for teenagers.
The Teenage Employment-Population ratios and their monthly changes in August 2026 were:
- Males: 47.1 per cent – +0.4 points.
- Females: 54.6 per cent – +2.3 points.
- Total: 50.7 per cent – +1.3 points.
Conclusion
My standard warning to take care in interpreting monthly labour force changes – they can fluctuate for a number of reasons and it is imprudent to jump to conclusions on the back of a single month’s data.
That is enough for today!
(c) Copyright 2026 William Mitchell. All Rights Reserved.

This Post Has 0 Comments