Last week, the RBA hiked interest rates again and tried to claim the economy was…
Australia’s lowest paid workers enjoy a modest real wage gain courtesy Fair Work Commission
On May 19, 2026, Oxfam Australia’s media release – Australian billionaires’ wealth grows by $50,000 per minute – informed us of the growing inequality in Australia, a country that promotes a ‘legend’ that egalitarianism is at its core. I will discuss their research in detail at another time but the results are stunning. In a population of 28 million, the “20 richest Australians hold more wealth than the bottom three million households”. While most of the population are struggling with “rising rents, grocery prices and energy bills”, the top-end-of-town have had a “bumper year” increasing their wealth by around $A50,000 per minute. That should frame our response to Tuesday’s (June 2, 2026) decision – Annual Wage Review 2026 – by the Fair Work Commission, Australia’s minimum wage setting authority, which increased the National Minimum Wage (NMW) by 6 per cent. A further cohort – those on minimum awards were given a 4.75 per cent increase in their wage. Against the current CPI growth, that increase provides for some modest real wage increase for the lowest paid workers in Australia. Of course, the employer groups are up-in-arms as usual claiming that the increase (and flow-ons – see below) will devastate employment growth and all the usual bunk as they post record profits. Fortunately, the FWC mostly ignored the bleating of the bosses. But compared to what is happening at the top of the income and wealth distribution, this change to the NMW is trivial to say the least.
In this blog post – Australia’s minimum wage rises – but not sufficient to end working poverty (June 6, 2017) – I outlined:
1. Progressive minimum wage setting principles.
2. The way staggered wage decisions (annually) lead to falling real wages in between the wage adjustment points.
I won’t repeat that analysis here. But it is essential background to understanding why the decisions taken by Fair Work Australia have been inadequate for a long time.
Who is affected?
The Fair Work Commission sets the NMW, which:
… applies only to any persons in the national industrial relations system who are not covered by a modern award or an enterprise agreement. Such persons constitute, at best, only a small fraction of the workforce.
There are about 100,000 workers in this category.
The FWC also sets “minimum wage rates prescribed by modern awards” across industry sectors and these decisions impact on a much larger proportion of the available workforce – those deemed to be ‘modern award reliant’ employees – which means that they are being paid under Australia’s award wage system, which is the lowest allowable wage for the relevant sector.
These awards are adjusted upwards when the NMW is altered.
The FWC noted that in this case:
Approximately 21.1 per cent of employees in Australia, amounting to almost 2.8 million persons, are paid at an applicable minimum wage rate under a modern award and are thus directly affected by Review decisions.
There are 121 modern awards in the Australian industrial structure.
The practice is that when the NMW is changed, that decision then flows directly into these minimum levels for the modern awards.
However, as noted in the introduction, the FWC gave a 6 per cent increase to the NMW but only a 4.75 per cent increase to the minimum level for the 121 modern awards.
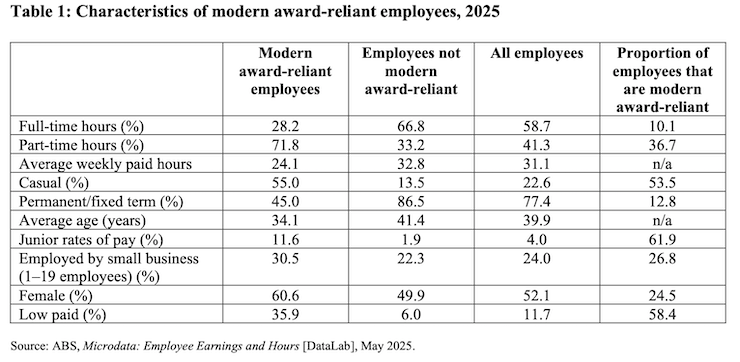
The characteristics of these workers earning minimum award wages are outlined in the FWC Decision and are “different to those of the workforce generally”:
1. “they predominantly work part-time hours, are female-dominated, and a majority are casuals.”
2. “they are disproportionately low-paid, and immigrants from countries other than the main English-speaking countries and Indigenous Australians are over-represented in this cohort.”
3. They are 60.6 per cent female.
4. They are younger than the average of the workforce as a whole (34.1 years compared to 41.4).
5. “The wages paid to modern award-reliant employees constitute only about 11.2 per cent of the national ‘wage bill’ because of the part-time and low-paid characteristics of these workers.”
These characteristics document the secondary labour market in the Australian economy – low-paid, casualised jobs with high degrees of occupational segregation biased against females and the young.
Given the low pay and low hours worked relative to the rest of the economy, the FWC estimated that the NMW adjustment would not have a significant impact on overall wages growth in the economy:
This means that the overall effect of the Review is limited: the 2025 Review, which awarded a 3.5 per cent increase, directly contributed no more than 0.36 of a percentage point to overall growth of 3.3 per cent in the Wage Price Index (WPI) to the March
quarter 2026.
Which means the decision directly improves the outcomes for these low-paid workers but the broader economic effective of the Annual Wage Review decisions is limited.
Which then should discourage anyone from believing the employer organisations that have conniptions when the FWC provides some wage relief for the very low paid workers in Australia.
Their claims reflect their own greed and willingness to exploit the most vulnerable workers rather than being based on any economic analysis.
A structural realignment was also made to the modern awards
This document provides a – Modern awards fact sheet
In its 2026 decision, the FWC also announced that in addition to the 4.75 per cent increase in the minimum wages to be paid in all modern awards, they would invoke a targeted structural adjustment for the lowest-paid classifications in the award system.
Within the modern award system, the so-called C13 level “is the lowest wage rate applicable to ongoing employment”.
Its origins can be traced back to the Manufacturing and Associated Industries and Occupations Award.
No worker can be paid less than that and so it aligns with the NMW.
Below the C13 level, is the C14 level, which is “special entry-level wage rate applicable to a limited initial period of employment” (no longer than 6 months).
The FWC announced that it was phasing:
… out classifications paid at the C13 level and to make the next wage level up, the C12 level, the lowest wage rate for ongoing
employment …This will involve the C13 rate being increased by an additional amount representing one-third of the difference between the C13 and the C12 rates. The C14 rate will be increased by the same percentage amount as the C13 rate to maintain its current relativity to C13.
Around 100,000 of the lowest-paid employees will be affected by this realignment.
One should understand that in addition to modern awards, workers (in trade unions) can also negotiate enterprise agreements that provide for wages higher than the minimum at each classification level defined by the modern awards.
This table shows the characteristics of the Australian labour force differentiated by those who are reliant on the award wage system and those that are outside of it on enterprise agreements.
Staggered adjustments in the real world
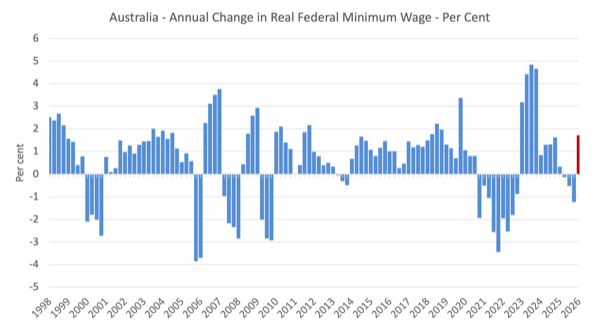
The first graph shows the annual change in the real value of the NMW (deflated by the CPI) from 1998 to the September-quarter 2026.
The 2026 increase will be first paid in the September-quarter 2026 and I used the RBA inflation forecast to deflate that quarters nominal wage level.
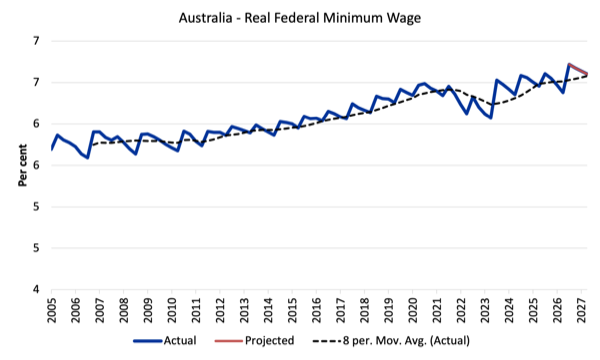
The following graph shows the evolution of the real purchasing power of the NMW since 2005.
The dotted line is an 8-quarter moving average to provide a better guide to the trend.
We have extrapolated the current decision, which applies from July 1, 2026, over the next 12 months (until the next decision) using RBA inflation forecasts to deflate the nominal NMW.
The familiar saw-tooth pattern is clear.
I explained this pattern in detail in this blog post – Australia’s minimum wage rises – but not sufficient to end working poverty (June 6, 2017).
Each of the peaks represents a formal wage decision by the Fair Work Commission so that at the time of the nominal adjustment (July 1 each year) the real NMW usually rises somewhat (perhaps not back to where it was 12 months earlier).
Each period that the curve heads downwards the real value of the FMW is being eroded.
That is, in between the decision periods, the inflation is on-going and erodes the nominal NMW, that is adjusted once per year.
That is one problem with these discrete adjustments and I would much rather the FWC built into the system, a feature that is common on most multi-period bargains, escalation.
That is, they could easily index wages to the quarterly inflation rate which would better protect real wages.
You can gauge the annual growth in the real wage by comparing successive peaks.
The decisions since 2012 have provided for some modest real income retention by these workers although it depends on how inflation is measured.
You can also see the troughs became shallower between 2012 and 2016 than in the past because the inflation rate moderated as a result of the GFC and the austerity since that has kept economic activity at moderate levels.
In more recent years the peak-trough amplitude has risen again and the NMW adjustments have failed to redress the purchasing power erosion to the nominal NMW even though each adjustment provides some immediate real wage gain for workers, those gains are ephemeral and the inflation process systematically cuts the purchasing power of the NMW significantly by the time the next decision is due – these are permanent losses.
You can approximate the cumulative losses between adjustment using half the inflation rate between the adjustment points.
While the small number of workers on NMW enjoyed a real wage rise of around 1.7 per cent, the larger number of workers (around 22 per cent of all workers) who only were awarded a 4.75 per cent increase, enjoyed a negligible real wage boost given the current CPI inflation rate.
Choice of deflator
The other problem relates to the appropriate measure of inflation.
I discuss that issue in detail in this blog post – Real wage cuts continue in Australia as profit share rises (May 15, 2024).
In a nutshell, the FWC uses the CPI as the measure.
However, the Australian Bureau of Statistics (ABS) recognise that there was a “need to develop a measure of ‘the price change of goods and services and its effect on living expenses of selected household types” and they now publish their so-called Selected Living Cost Indexes (SLCIs), which use expenditure patterns of different cohorts in society (as weights in the index) to assess the “the extent to which the impact of price change varies across different groups of households in the Australian population”.
One of their SCLI measures is the Employee Households index.
When CPI inflation stabilises, the two indexes tend to converge and move in tandem.
When the CPI inflation accelerates, the SLCI inflation rate increases at a faster rate and overtakes the CPI inflation rate.
For example in the COVID-19 inflationary episode, the peak CPI inflation rate was 7.91 per cent recorded in the December-quarter 2022.
In contrast, the peak Employee SLCI index peaked at 9.70 per cent two quarters later in the June-quarter 2023.
What this means is that recent nominal wage adjustments designed to preserve real purchasing power that use the CPI as the inflation measure will seriously understate the real wage erosion.
The extent of real wage erosion at the bottom
I calculated what the Federal Minimum Wage (NMW) would be had the FWC (and its antecedents) fully indexed the NMW from the March-quarter 2016 level of $A672.70 per week.
I used the CPI and the Employee SCLI to inflate that nominal weekly wage out to the September-quarter 2026, which is when the latest FWC decision takes effect.
The following graph compares the actual NMW since the March-quarter 2016 with what it would have been in nominal terms had it grown in line with the CPI and the Employee SCLI – that is, had it been fully indexed.
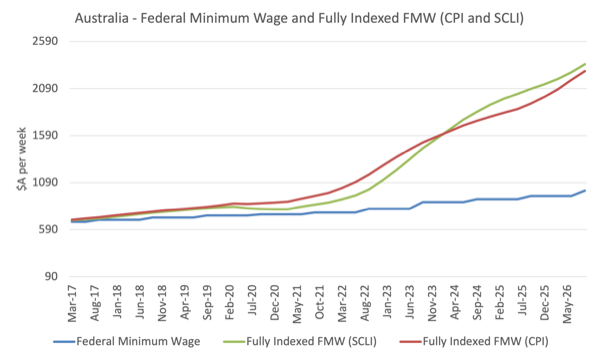
The differences are massive:
1. The nominal NMW in the September-quarter 2026 will be $A1,004.90 per week.
2. If fully indexed to the CPI since the March-quarter 2016, it would have been $A2,274.25 per week a difference of $A1,269.35 per week (almost double).
3. If fully indexed to the Employee SCLI since the March-quarter 2016, it would have been $A2,348.63 per week a difference of $1,343.73 per week.
Then think about the typical employer submission to the Annual Wage Review conducted by the FWC.
For example, The Australian Chamber Commerce and Industry (ACCI), which represents around 400,000 employers demanded the FWC limit the increase to 3.5 per cent.
This was representative of the claims made by the other employer groups.
The following graph traces the ACCI submissions to FWC and converts their proposed maximum nominal wage increases for the NMW into the real wage outcome (using the CPI)
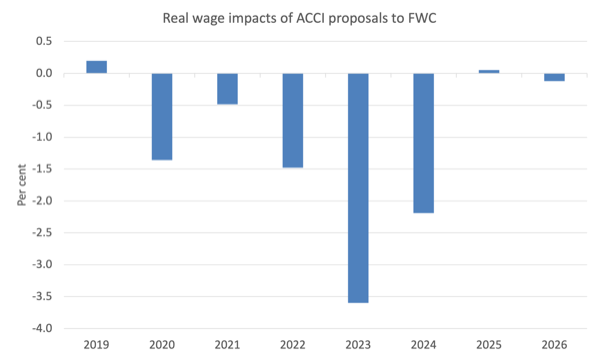
In nominal wage terms, the ACCI submissions if successful (and if we assume each year is independent of the last) would deliver a nominal NMW in September 2026 of $853.87 per week rather than the actual outcome of $1,004.90.
Over the period since June 2019, the actual nominal NMW has increased by 35.6 per cent compared to the CPI of 27.5 per cent.
If ACCI had have had their way, the nominal NMW would have increased by only 16.6 per cent over this period, meaning they wanted an overall real wage cut to for the most disadvantaged workers of more than 10 per cent over the 7 year period.
It was a period over which business profits reached record levels.
Lowest-paid workers improve relative to other workers but all workers still fail to share in productivity growth
Another perspective is to compare the movement in the Federal Minimum Wage with growth in GDP per hour worked (which is taken from the National Accounts).
GDP per hour worked is a measure of labour productivity and tells us about the contribution by workers to production.
Labour productivity growth provides the scope for non-inflationary real wages growth and historically workers have been able to enjoy rising material standards of living because the wage tribunals have awarded growth in nominal wages in proportion with labour productivity growth.
The widening gap between wages growth and labour productivity growth has been a world trend (especially in Anglo countries) and I document the consequences of it in this blog post – The origins of the economic crisis (February 16, 2009).
But the attack on living standards has targetted more than the bottom end of the labour market, although the minimum wage workers have certainly been more deprived of the chance to share in national productivity growth than other workers.
The recent FWC decisions provides some relief to that trend.
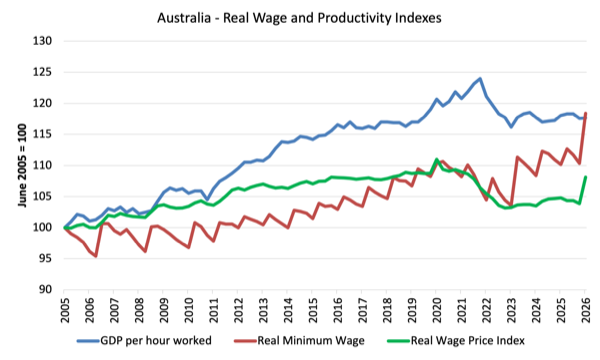
The following graph shows the evolution of the real Federal Minimum Wage (red line), GDP per hour worked (blue line), and the Real Wage Price Index (green line), the latter is a measure of general wage movements in the economy.
The graph is from the June-quarter 2005 up until September-quarter 2027 (indexed at 100 in June 2005 and extrapolated as above out to 2024).
The last known observation is the March-quarter 2026.
I have extrapolated out to the September-quarter 2026 using standard assumptions of steady growth in productivity, and RBA inflation forecasts for the CPI series.
By the March-quarter 2026, the actual respective index numbers were 117.6 (GDP per hour worked), 103.9 (Real WPI), and 110.3 (real NMW).
All workers have failed to enjoy a fair share of the national productivity growth. However, the most recent FWC decisions have seen the lowest paid workers improve their position relative to other workers.
Like all graphs the picture is sensitive to the sample used. If I had taken the starting point back to the 1980s you would see a very large gap between productivity growth and wages growth, which has been associated with the massive redistribution of real income to profits over the last three decades.
Conclusion
On Tuesday, the FWC provided for a modest real wage increase for the lowest-paid workers in Australia.
Of course, the employers were aghast at the decision while at the same time pocketing record profits as a result of their profit gouging.
Same old.
That is enough for today!
(c) Copyright 2026 William Mitchell. All Rights Reserved.
Blissex spot on
“ Consider the case where all constituencies are mixed-income: then below-average-pay people are the plurality in every one of them, and if they vote this would result in 100% of seats going to Old Labour.
Consider the case where instead below-average-pay people are concentrated in a minority of “ghetto” constituencies: then in those constituencies, let’s say 25% of them, Old Labour candidates get 70% of the votes, but in the majority of constituencies the winning plurality is either Conservative (upper-class or upper-middle class) or New Labour (upper-middle class or middle class).
This is the mirror image of “Remain”, which was heavily concentrated, so that 48% of votes were a majority in only 25-30% of constituencies. It already takes 10,000 more voters to elect a Labour MP than a Conservative MP, because Labour voters are concentrated in northern and ex-industrial areas.
So the Conservative and New Labour plan is to segregate localities by income, by making sure that in a majority of localities most below-average-pay voters cannot afford to pay rent or buy a house. This plan is best implemented in London, by making most London constituencies unaffordable to below-average-income voters.”
Global population go to 10 billion this century how do we feed these extra people without significant carbon emissions? Seems nearly impossible!
Please respond bill and create green new deal policy paper