On May 19, 2026, Oxfam Australia's media release - Australian billionaires’ wealth grows by $50,000…
Australian wages growth – real wages stable – no breakout evident
Throughout the recent period of higher than usual inflation, the Reserve Bank of Australia kept telling us that they had to keep hiking rates (even though the inflation trajectory was downward) because they were predicting a wages explosion. Who told them about that? Their so-called business liaison meetings. The business sector is always claiming that a crippling wages breakout is about to happen because they want policy makers to suppress employment growth to give them the upper hand in wage negotiations. Anyway, no such wages explosion occurred. And the latest data shows that things haven’t changed. Today (May 14, 2025), the Australian Bureau of Statistics released the latest – Wage Price Index, Australia – for the March-uarter 2025, which shows that the aggregate wage index rose by 3.4 per cent over the 12 months (up 0.2 points on the last quarter). While most commentators will focus on the nominal wages growth relative to CPI movements, the more accurate estimate of the cost-of-living change is the Employee Selected Living Cost Index, which is still running well above the CPI change. Using that measure, purchasing power of the nominal wages was stable in the March-quarter. There is no wages breakout happening.
Latest Australian data
The Wage Price Index:
… measures changes in the price of labour, unaffected by compositional shifts in the labour force, hours worked or employee characteristics
Thus, it is a cleaner measure of wage movements than say average weekly earnings which can be influenced by compositional shifts.
The summary results (seasonally adjusted) for the December-quarter 2024 were:
| Measure | Quarterly (per cent) | Annual (per cent) |
| Private hourly wages | 0.9 (+0.2 points) | 3.3 (+0.1 point) |
| Public hourly wages | 1.0 (+0.4 points) | 3.6 (+0.8 points) |
| Total hourly wages | 0.8 (+0.1 point) | 3.4 (+0.2 points) |
| Employee Selected Cost-of-Living measure | 1.1 (+0.8 points) | 3.4 (-0.6 points) |
| Basic CPI measure | 0.9 (+0.7 points) | 2.4 (stable) |
| Weighted median inflation | 0.7 (+0.2 points) | 3.0 (-0.4 points) |
| Trimmed mean inflation | 0.7 (+0.2 points) | 2.9 (-0.3 points) |
On price inflation measures, please read my blog post – Inflation benign in Australia with plenty of scope for fiscal expansion (April 22, 2015) – for more discussion on the various measures of inflation that the RBA uses – CPI, weighted median and the trimmed mean.
The latter two aim to strip volatility out of the raw CPI series and give a better measure of underlying inflation.
The ABS press release – Wages rise 3.4% in the year to March 2025 – notes that:
The Wage Price Index (WPI) rose 0.9 per cent in the March quarter 2025, and 3.4 per cent annually …
Annual wage growth ticked up for the first time since the June quarter 2024. The 3.4 per cent increase in wages for the year to the March quarter 2025 was higher than the 3.2 per cent to the December quarter 2024, but lower than the 4.0 per cent at the same time last year. …
Private sector wage growth was also influenced by administrative wage adjustments due to the Stage 3 Aged Care Work Value Case, and the Early Childhood Education and Care Worker Retention Payment. It was also impacted by regular March quarter wage and salary reviews …
The larger than usual March quarter contribution from enterprise agreement-covered jobs was mainly driven by the new state-based enterprise agreements in the public sector …
Summary assessment:
1. While the quarterly results show a slight increase in the wages growth rate, the main reason was the timing of particular agreements and administrative adjustments.
2. Over the 12-month period there was an improvement in the real purchasing power of nominal wages if we use the CPI as the relevant measure.
3. However, in saying that, we have to consider what is the most appropriate cost-of-living measure to deploy (see below).
4. When the price movements for the expenditure patterns that employees follow are taken into account – that is, using the Employee Selected Cost-of-Living measure – real purchasing power was unchanged in the March-quarter 2025.
Inflation and cost of living measures
There is a debate as to which cost-of-living measure is the most appropriate.
The most used measure published by the Australian Bureau of Statistics (ABS) is the quarterly ‘All Groups Consumer Price Index (CPI)’.
Reflecting the need to develop a measure of ‘the price change of goods and services and its effect on living expenses of selected household types’, the ABS began publishing a new series in June 2000 – the Analytical Living Cost Indexes – which became a quarterly publication from the December-quarter 2009.
In its technical paper (published October 27, 2021) – Frequently asked questions (FAQs) about the measurement of housing in the Consumer Price Index (CPI) and Selected Living Cost Indexes (SLCIs) – the ABS note that:
The CPI and SLCIs are closely related. All these indexes measure changes in prices paid by the household sector (consumers) for a basket of goods and services provided by other sectors of the economy (e.g. Government, businesses). The weights in the ‘basket’ represent amounts of expenditure by households on goods and services bought from other sectors. Goods traded between households (like buying and selling existing houses) are excluded as both sides of the transaction occur within the household sector.
I discuss these indexes in detail in this blog post – Australia – real wages continue to decline and wage movements show RBA logic to be a ruse (August 16, 2023).
In effect, the SLCIs represent a more reliable indicator of ‘the extent to which the impact of price change varies across different groups of households in the Australian population’.
There are four separate SLCIs compiled by the ABS:
- Employee households.
- Age pensioner households.
- Other government transfer recipient households.
- Self-funded retiree households
The most recent data – Selected Living Cost Indexes, Australia – was published by the ABS on February 5, 2025 for the December-quarter 2024.
For the 12 months to the March-quarter 2025:
- Employee households: +3.4 per cent (-0.6 points).
- All groups CPI’: +2.4 per cent (stable).
The following graph shows the differences between the CPI-based measure and the Employee SLCI measure which better reflects the changes in cost-of-living.
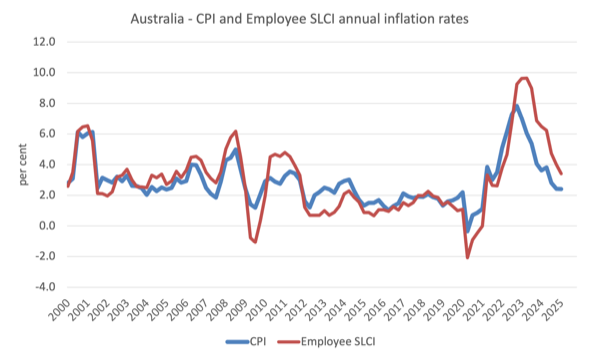
Thus, when specific household expenditure patterns are more carefully modelled, the SLCI data reveals that the cost-of-living squeeze on ‘employee households’ is more intense than is depicted by using the generic CPI data.
The ABS considers the ‘Employee households SLCI’ to be its preferred measure designed to capture cost-of-living changes more accurately for ‘households whose principal source of income is from wages and salaries’.
Summary of Real Wage Movements
- The relevant cost-of-living measure for workers has risen by 3.4 per cent over the last year matching the nominal overall wages growth – so no change in the overall purchasing power of wages.
- However, the media wrongly focus on the CPI as the relevant inflation measure and conclude that with the rise in the CPI of 2.4 per cent, the nominal wage growth of 3.4 per cent delivers a real wage rise of 1.0 point.
- Which is misleading in terms of the purchasing power movements.
Real wage trends in Australia
The summary data in the table above confirms that real wages growth overall (private and public sectors) stagnated over the last 12 months.
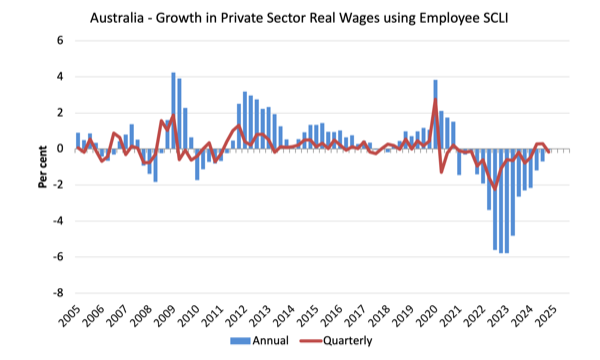
For private sector workers, the dramatic loss of purchasing power continued – private real wages have fallen continuously for the last 16 quarters.
The following graph uses the Employee SLCI measure to show the movement of real wages in the private sector from 2005 to the March-quarter 2024.
The fluctuation in mid-2020 is an outlier created by the temporary government decision to offer free child care for the March-quarter which was rescinded in the March-quarter of that year.
Overall, the record since 2013 has been appalling.
Throughout most of the period since 2015, real wages growth has been negative with the exception of some partial catch-up in 2018 and 2019.
The systematic real wage cuts indicate that wages were not driving the recent inflationary episode.
Workers have only been able to secure partial offset for the cost-of-living pressures caused by the supply-side, driven inflation.
The great productivity rip-off continues
While the decline in real wages means that the rate of growth in nominal wages is being outstripped by the inflation rate, another relationship that is important is the relationship between movements in real wages and productivity.
As part of their attempt at justifying the interest rate hikes, the RBA were also making a big deal of the fact that wages growth is too high relative to productivity growth.
Historically (up until the 1980s), rising productivity growth was shared out to workers in the form of improvements in real living standards.
In effect, productivity growth provides the ‘space’ for nominal wages to grow without promoting cost-push inflationary pressures.
There is also an equity construct that is important – if real wages are keeping pace with productivity growth then the share of wages in national income remains constant.
Further, higher rates of spending driven by the real wages growth can underpin new activity and jobs, which absorbs the workers lost to the productivity growth elsewhere in the economy.
The Treasury likes to use the Real Unit Labour Costs (also equivalent to the wage share in income) as the measure of business costs.
It is the ratio of real wages to labour productivity.
From the March-quarter 2020 until the September-quarter 2024, RULCs growth was negative, which means there was a major redistribution of national income going away from wages to profits.
In the last two quarter, there has been positive but modest growth.
Howeever, this has occurred not because there has been growth in real wages.
Rather, it is because both real wage growth and productivity growth has been negative, but the latter has been more negative than the former.
So it is really lagging productivity growth that is the culprit and that reflects on management decisions (investment, innovation, etc) rather than trade unions forcing excessive wage increases.
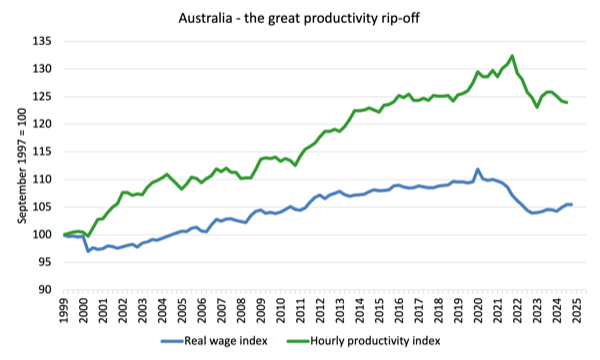
We can see that in the following graph which shows the total hourly rates of pay in the private sector in real terms deflated with the CPI (blue or lower line) and the real GDP per hour worked (from the national accounts) (green or upper line) from the June-quarter 1999 to the March-qquarter 2025.
It doesn’t make much difference which deflator is used to adjust the nominal hourly WPI series. Nor does it matter much if we used the national accounts measure of wages.
But, over the time shown, the real hourly wage index has grown by only 5.5 per cent, while the hourly productivity index has grown by 24.1 per cent.
The dip in productivity growth is due to the parlous investment rates of Australian businesses.
If I started the index in the early 1980s, when the gap between the two really started to open up, the gap would be much greater. Data discontinuities however prevent a concise graph of this type being provided at this stage.
For more analysis of why the gap represents a shift in national income shares and why it matters, please read the blog post – Australia – stagnant wages growth continues (August 17, 2016).
Where does the real income that the workers lose by being unable to gain real wages growth in line with productivity growth go?
Answer: Mostly to profits.
These blog posts explain all this in more technical terms:
1. Puzzle: Has real wages growth outstripped productivity growth or not? – Part 1 (November 20, 2019).
2. Puzzle: Has real wages growth outstripped productivity growth or not? – Part 2 (November 21, 2019).
I did some work the other day computing an estimate of what the average weekly earnings (AWE) in Australia would be if the real wage had have kept pace with productivity growth over this period.
I will write more about that in another blog post.
But the preliminary result of my calculation was that:
1. In August 2023, nominal AWE in Australia were $A1,885.60 per week.
2. If real wages had have followed the productivity trajectory (that is RULC were stable) over the period shown in the graph above, then the nominal AWE in Australia would have $A2,170.20 per week in August 2023.
3. That is, on average, weekly earnings would have been $A284.60 higher or $A14,230 higher on annual basis.
4. That gap will be significantly bigger by August 2025 and I will report my updates later.
5. That is the extent of the productivity rip-off in Australia.
Conclusion
In the March-quarter 2025, Australia’s nominal wage growth grew by 3.4 per cent.
While most commentators will focus on the nominal wages growth relative to CPI movements, the more accurate estimate of the cost-of-living change is the Employee Selected Living Cost Index, which is still running well above the CPI change.
Using that measure, purchasing power of the nominal wages was stable in the March-quarter.
That is enough for today!
(c) Copyright 2025 William Mitchell. All Rights Reserved.
It’s nice to see at least one economist discuss COL. Still, it is such a tiny corner of what economics should be measuring.
Wealth drives poverty. If spiraling wealth inequality is not stopped, people will become poorer and poorer, facing of future of intense destitution and death.
Why is it that the occupation can’t forecast this outcome?
As I was tapping my card to pay for my fish and chips yesterday, the thought struck me – I wonder if the death of cash – hastened by Covid – has been another contributor to inflation? These small shops now have to declare most of their income and would have to pay probably a much more substantial tax bill. It would make sense if they have increased prices as in response.
HI Bill can I please use your graph wages vs productivity in a presentation tomorrow for the ACTU with your reference–many thanks M
Dear Maureen Dollard (at 2025/11/19 at 12:09 pm)
Thanks for your comment. I have no problems in you using the graph and thanks very much for asking.
Good luck with your presentation.
All the best
bill