The recent extreme weather in the northern hemisphere, the twin monster tropical storms in Japan,…
Australian labour market deteriorates – employment and participation fall, underlying unemployment rate is 4.7 rather than 4.1 per cent
Today (March 20, 2025), the Australian Bureau of Statistics released the latest – Labour Force, Australia – for February 2025. The contraction in overall employment growth, the participation rate, and the employment-population ratio are all signs of a deteriorating situation. Unemployment always lags behind the employment dynamics because of the participation rate movements, which means that the situation is worse than the unemployment rate signals. The official unemployment rate was a steady 4.1 per cent but if we adjust for the changing participation then the underlying rate is about 4.7 per cent. That means that the 97.5 thousand LESS workers in the labour force due to the falling participation have entered the ranks of the hidden unemployed. We should also not disregard the fact that there is still 9.9 per cent of the working age population (around 1.5 million people) who are available and willing but cannot find enough work – either unemployed or underemployed and that proportion is increasing. Australia is not near full employment despite the claims by the mainstream commentators and it is hard to characterise this as a ‘tight’ labour market.
The summary ABS Labour Force (seasonally adjusted) estimates for February 2025 are:
- Employment fell 52,800 (-0.4 per cent) – full-time employment fell by 35.7 thousand (-0.4 per cent) and part-time employment fell by 17 thousand (-0.4 per cent). Part-time share of total was 30.6 per cent.
- Unemployment fell 11,200 to 612,600 persons.
- The official unemployment rate was steady at 4.1 per cent.
- The participation rate fell 0.4 points to 66.8 per cent.
- The employment-population ratio fell 0.3 points to 64.1 per cent.
- Aggregate monthly hours fell 8 million hours (-0.4 per cent).
- Underemployment rate fell 0.1 point to 5.9 per cent – underemployment fell 19.9 thousand. Overall there are 887.3 thousand underemployed workers. The total labour underutilisation rate (unemployment plus underemployment) fell 0.2 points to 9.9 per cent. There were a total of 1499.9 thousand workers either unemployed or underemployed.
The ABS Media Release (March 20, 2025) – Unemployment rate remains steady at 4.1% in February – noted that:
The seasonally adjusted unemployment rate remained steady at 4.1 per cent in February …
With employment falling by 53,000 people and the number of unemployed falling by 11,000 people, the unemployment rate remained at 4.1 per cent …
Seasonally adjusted monthly hours worked fell by 0.4 per cent in February 2025, in line with the percentage fall in employment …
The underemployment rate decreased 0.1 percentage points to 5.9 per cent in February 2025 …
The underutilisation rate, which combines the unemployment and underemployment rates, decreased 0.2 percentage points to 9.9 per cent. This was 4.0 percentage points lower than March 2020.
General conclusion:
1. Employment growth contracted in February and participation fell which was the only reason that the unemployment rate was steady.
2. Had the participation rate not fallen by 0.4 points, the unemployment rate would have been 4.7 per cent rather than the official rate of 4.1 per cent (see below for details).
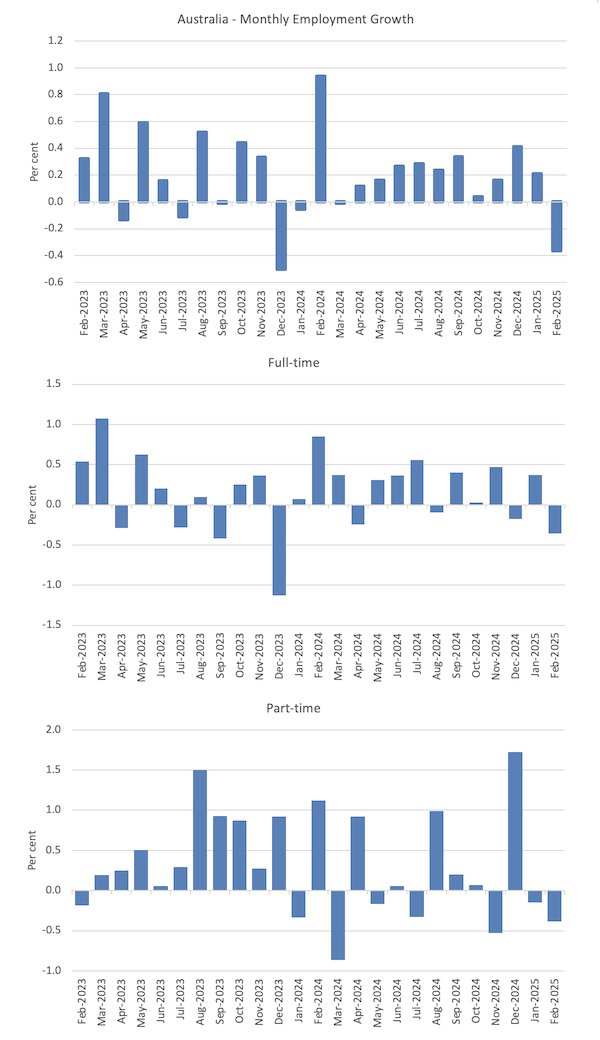
Employment fell 35.7 thousand (-0.4 per cent) in February 2025
1. Full-time employment fell by 35.7 thousand (-0.4 per cent) and part-time employment fell by 17 thousand (-0.4 per cent).
2. The employment-population ratio fell 0.3 points to 64.1 per cent.
The following graph show the month by month growth in total, full-time, and part-time employment for the 24 months to January 2024 using seasonally adjusted data.
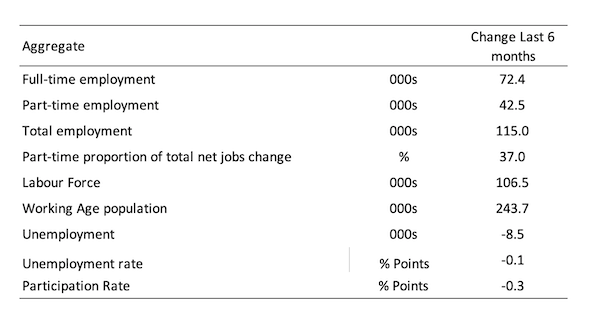
The following table provides an accounting summary of the labour market performance over the last six months to provide a longer perspective that cuts through the monthly variability and provides a better assessment of the trends.
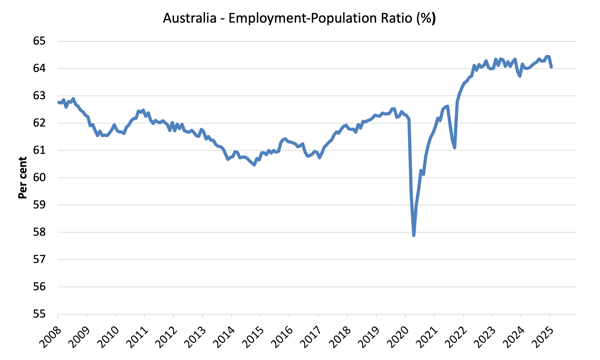
Given the variation in the labour force estimates, it is sometimes useful to examine the Employment-to-Population ratio (%) because the underlying population estimates (denominator) are less cyclical and subject to variation than the labour force estimates. This is an alternative measure of the robustness of activity to the unemployment rate, which is sensitive to those labour force swings.
The following graph shows the Employment-to-Population ratio, since April 2008 (that is, since the GFC).
The employment-to-population ratio declined back to the relatively stable level that we have seen since 2022.
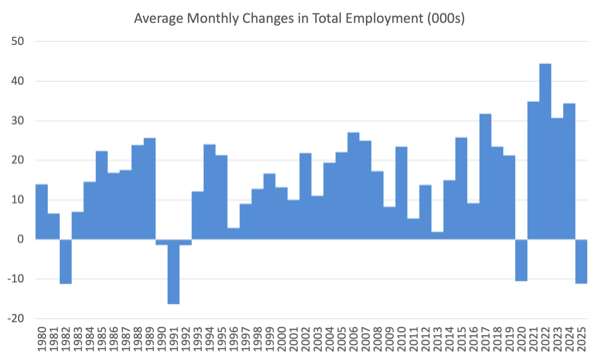
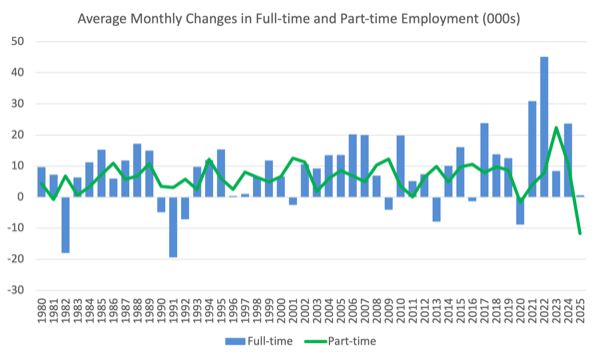
For perspective, the following graph shows the average monthly employment change for the calendar years from 1980 to 2024.
1. The average employment change over 2020 was -10.6 thousand which rose to 34.9 thousand in 2021 as the lockdowns eased.
2. For 2022, the average monthly change was 44.5 thousand, for 2023, the average change was 30.7 thousand, and for 2024, the average monthly change was 34.4 thousand.
3. The average (so far) for 2025 (one observation) is -11.2 thousand – which is difficult to interpret given only 2 observations are available.
The following graph shows the average monthly changes in Full-time and Part-time employment in thousands since 1980.
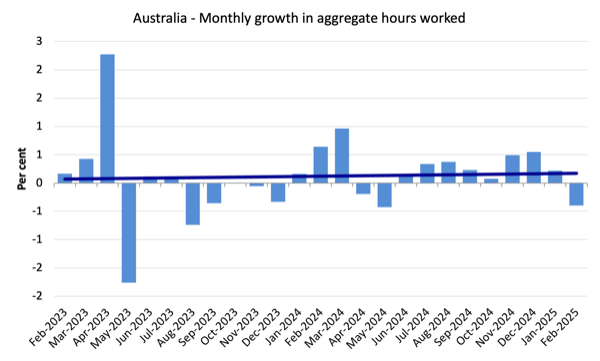
Aggregate monthly hours fell 7.8 million or 0.4 per cent
The following graph shows the monthly growth (in per cent) over the last 24 months.
The dark linear line is a simple regression trend of the monthly change.
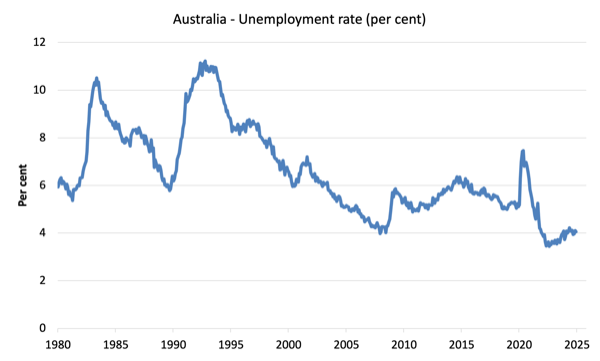
Unemployment fell 11,200 to 612,600 persons in February 2025
The drop in participation was the only reason the unemployment rate didn’t increase this month given the drop in employment.
See below for the participation effect.
The following graph shows the national unemployment rate from April 1980 to February 2025. The longer time-series helps frame some perspective to what is happening at present.
What was the impact of the declining participation rate on unemployment in February 2025
The question is what would the unemployment rate have been, given the significant employment growth in January, if the participation rate had not risen and dragged more workers in to the labour force?
These concepts help us answer this type of question:
- The labour force is a subset of the working-age population (those above 15 years old). The proportion of the working-age population that constitutes the labour force is called the labour force participation rate. Thus changes in the labour force can impact on the official unemployment rate, and, as a result, movements in the latter need to be interpreted carefully. A rising unemployment rate may not indicate a recessing economy.
- The labour force can expand as a result of general population growth and/or increases in the labour force participation rates (and vice versa).
The following Table shows the breakdown in the changes to the main aggregates (Labour Force, Employment and Unemployment) and the impact of the fall in the participation rate.
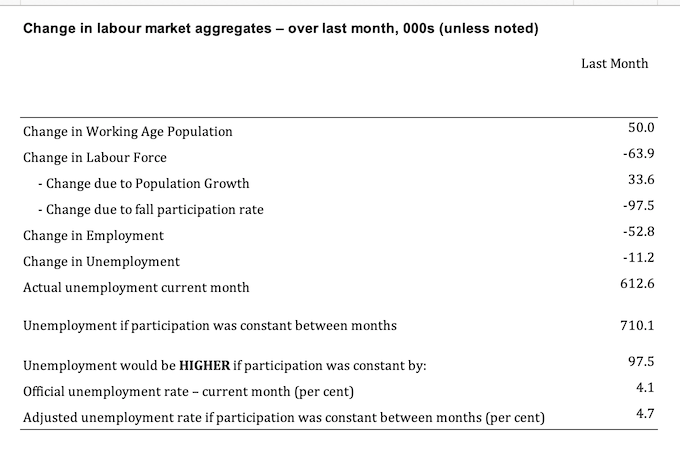
The change in the labour force in February 2025 was the outcome of two separate factors:
- The underlying population growth added 33.6 thousand persons to the labour force. The population growth impact on the labour force aggregate is relatively steady from month to month; and
- The fall in the participation rate meant that there were 97.5 thousand LESS workers in the labour force (relative to what would have occurred had the participation rate remained unchanged).
- The net result was that the labour force fell by 63.9 thousand.
Assessment:
1. If the participation rate had not have fallen in February 2025, total unemployment, given the current employment level, would have been 710.1 thousand rather than the official count of 612.6 thousand as recorded by the ABS – a difference of 97.5 thousand workers (the ‘participation effect’).
2. Without the fall in the participation rate, the official unemployment rate would have been 4.7 per cent (rounded) rather than its current official value of 4.1 per cent).
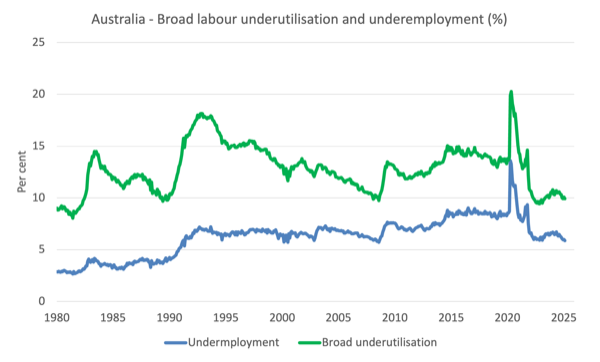
Broad labour underutilisation fell 0.2 points to 9.9 per cent in February 2025
1. Underemployment rate fell 0.1 point to 5.9 per cent – underemployment fell 19.9 thousand.
2. Overall there are 887.3 thousand underemployed workers.
3. The total labour underutilisation rate (unemployment plus underemployment) fell 0.2 points to 9.9 per cent.
4. There were a total of 1499.9 thousand workers either unemployed or underemployed.
Assessment:
The decline in overall labour underutilisation has to be seen in the context of the declining participation rate and falling employment.
Hidden unemployment clearly rose and taken together indicates a slowing in the labour market in February.
The following graph plots the seasonally-adjusted underemployment rate in Australia from April 1980 to the February 2025 (blue line) and the broad underutilisation rate over the same period (green line).
The difference between the two lines is the unemployment rate.
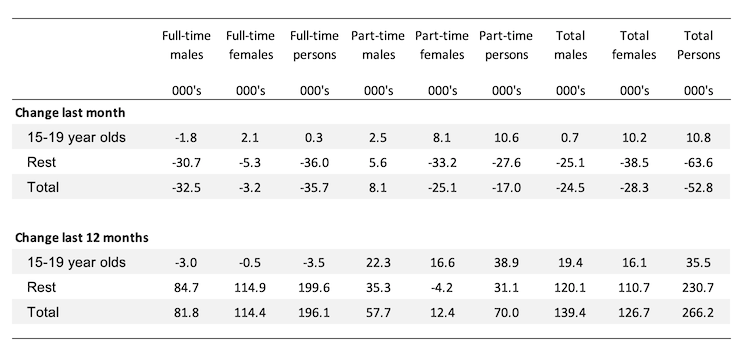
Teenage labour market – defies the overall movement in February 2025
While total employment contracted in February 2025, overall teenage employment rose by 10.8 thousand with full-time employment rising by 0.3 thousand and part-time employment increasing by 10.6 thousand.
The following Table shows the distribution of net employment creation in the last month and the last 12 months by full-time/part-time status and age/gender category (15-19 year olds and the rest).
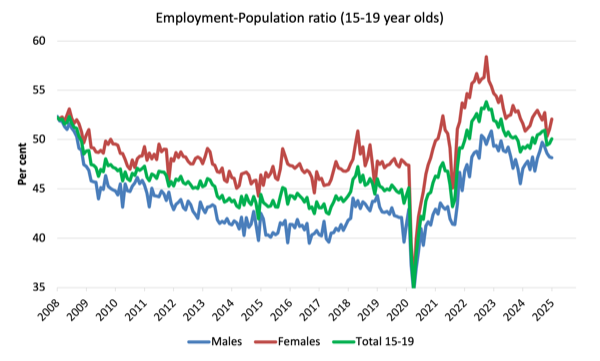
To put the teenage employment situation in a scale context (relative to their size in the population) the following graph shows the Employment-Population ratios for males, females and total 15-19 year olds since July 2008.
You can interpret this graph as depicting the change in employment relative to the underlying population of each cohort.
In terms of the recent dynamics:
1. The male ratio fell 0.1 point over the month.
2. The female ratio rose 1.0 point over the month.
3. The overall teenage employment-population ratio rose 0.5 points over the month.
Conclusion
My standard monthly warning: we always have to be careful interpreting month to month movements given the way the Labour Force Survey is constructed and implemented.
My overall assessment is:
1. The contraction in overall employment growth, the participation rate, and the employment-population ratio are all signs of a deteriorating situation.
2. Unemployment always lags behind the employment dynamics because of the participation rate movements, which means that the situation is worse than the unemployment rate signals.
3. However, it is clear that the 97.5 thousand LESS workers in the labour force due to the falling participation will mean that hidden unemployment has risen by around that much.
4. We should not disregard the fact that there is still 9.9 per cent of the working age population (around 1.5 million people) who are available and willing but cannot find enough work – either unemployed or underemployed and that proportion is increasing.
5. Australia is not near full employment despite the claims by the mainstream commentators and it is hard to characterise this as a ‘tight’ labour market.
That is enough for today!
(c) Copyright 2025 William Mitchell. All Rights Reserved.
This Post Has 0 Comments