In the 1990s, a new industry was created in Australia. It produced nothing. But it…
Australia labour market – sluggish as growth slows
The Australian Bureau of Statistics (ABS) released the latest labour force data today (April 17, 2025) – Labour Force, Australia – for March 2025. It revealed that the unemployment rate rose 0.1 point (on rounding) to 4.1 per cent, employment rose by 32,200 (0.2 per cent), the underemployment rate was unchanged at 5.9 per cent, and the participation rate rose 0.1 point (on rounding). Monthly hours worked fell by 6 million (-0.3 per cent). The broad labour underutilisation rate (sum of unemployment and underemployment) was 9.9 per cent, which puts the claims that this is a tight labour market into perspective. There is substantial scope for more job creation given the slack that is present.
The summary seasonally-adjusted statistics for March 2025 are:
- Employment rose 32,200 (0.2 per cent) – full-time employment rose by 15 thousand (0.2 per cent) and part-time employment rose by 17.2 thousand (0.4 per cent).
- Unemployment rose by 3,000 (0.5 per cent) to 613,900.(
- The unemployment rate rose by 0.1 point (after rounding) to 4.1 per cent.
- The participation rate rose by 0.1 point (after rounding) to 66.8 per cent.
- The Employment-population ratio was steady at 64.1 per cent to per cent.
- Monthly hours worked fell by 6 million (-0.3 per cent).
- Underemployment remained steady at 5.9 per cent (889.7 thousand).
- The Broad Labour Underutilisation rate (the sum of unemployment and underemployment) was steady at 9.92 per cent.
- Overall, there are 1503.6 thousand people either unemployed or underemployed.
The ABS press release – Unemployment rate at 4.1% in March – noted that:
With employment increasing by 32,000 people and the number of unemployed increasing by 3,000 people, the unemployment rate rose slightly to 4.1 per cent for March.’
Employment has grown by 308,000 people, or 2.2 per cent, over the last 12 months. This annual growth rate is slightly higher than the 20-year pre-pandemic average of 2.0 per cent …
Monthly hours worked decreased by 0.3 per cent, falling for the second month in a row, despite the growth in employment this month.
… A higher than usual number of people reported working reduced hours this month due to bad weather, coinciding with ex-Tropical Cyclone Alfred and other major weather events in New South Wales and Queensland …
Summary
Weaker employment growth and a small uptick in participation resulted in the modest rise in unemployment.
Seasonal and weather factors were at play and we will not know until next month whether the consecutive decline in working hours is a new downward trend or not.
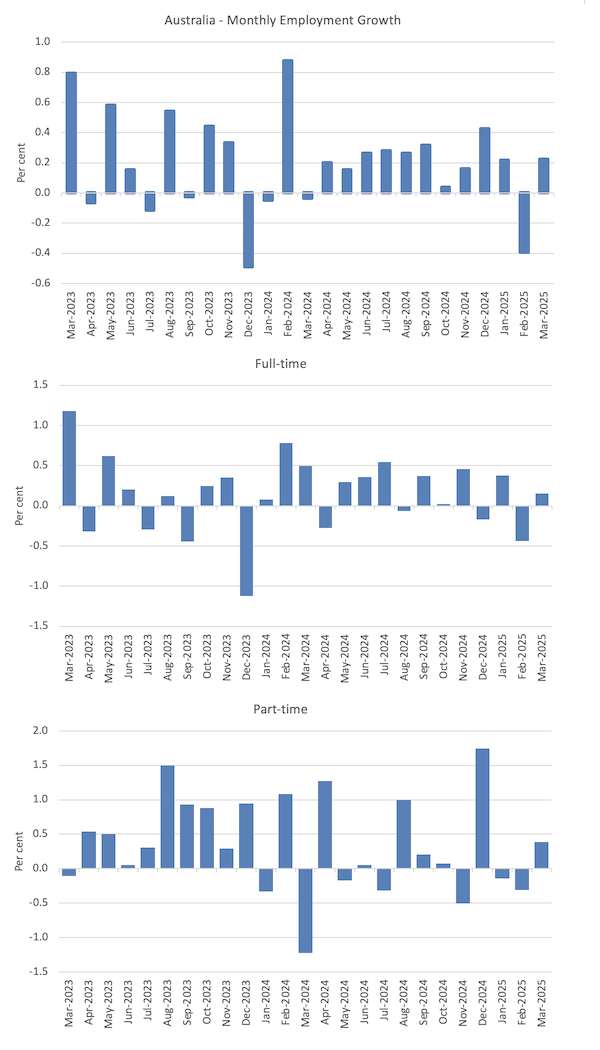
Employment growth was modest
- Total employment rose 32,200 (0.2 per cent) – which was the average growth rate for the last 12 months.
- Full-time employment rose by 15 thousand (0.2 per cent).
- Part-time employment rose by 17.2 thousand (0.4 per cent).
The following graph shows the growth in total, full-time, and part-time employment for the last 24 months.
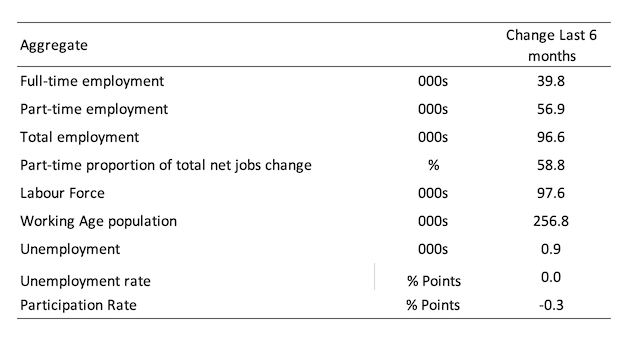
The following table shows the shifts over the last 6 months which helps to see the underlying trend.
The very modest rise in employment has just kept pace with the increase in the labour force over this period, which is why the change in unemployment is close to zero (900).
However, the decline in the participation rate has reduced the number looking for work, which has helped and it is likely that hidden unemployment has risen somewhat.
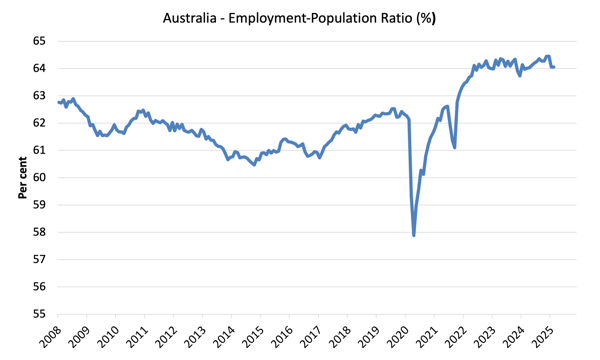
The Employment-to-Population ratio provides a measure of the state of the labour market that is independent of the supply shifts in the labour market (driven by the shifts in the participation rate).
The underlying working age population grows steadily while the labour force shifts with both underlying population growth and the participation swings.
The following graph shows the Employment-Population ratio which was steady at 64.1 per cent in March 2025.
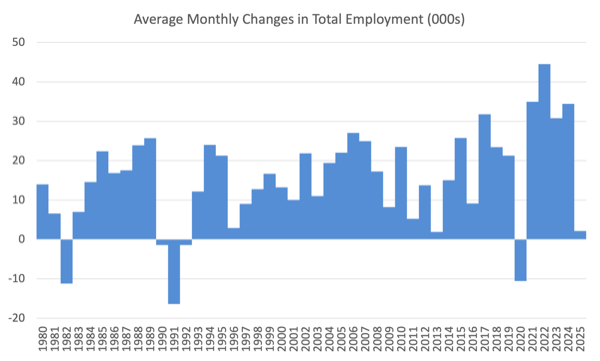
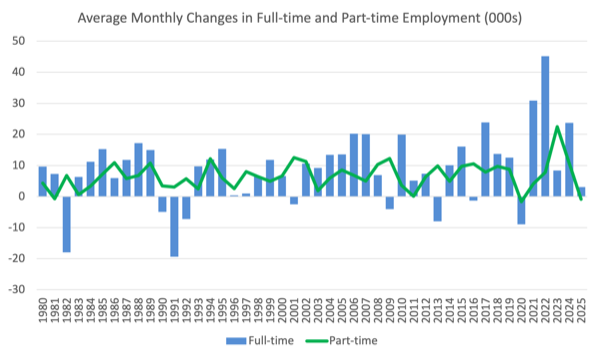
The next graphs show the average monthly change in total employment (first graph) and full- and part-time employment (second graph).
For total employment the monthly average changes were:
- 2022 – 44.5 thousand
- 2023 – 30.8 thousand
- 2024 – 34.4 thousand
- 2025 so far – 2.2 thousand
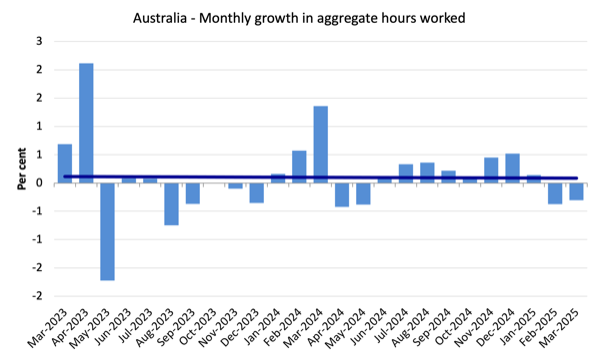
Monthly hours worked – decline by 0.3 per cent
Monthly hours worked decline by 5.9 million hours (-0.3 per cent) in March, the second consecutive decline.
As noted above there was some disruption to working arrangements in the Month as a result of extreme weather events in NSW and Queensland.
The following graph shows the growth in monthly hours worked for the last 24 months, with the straight line being a simple linear regression to indicate trend.
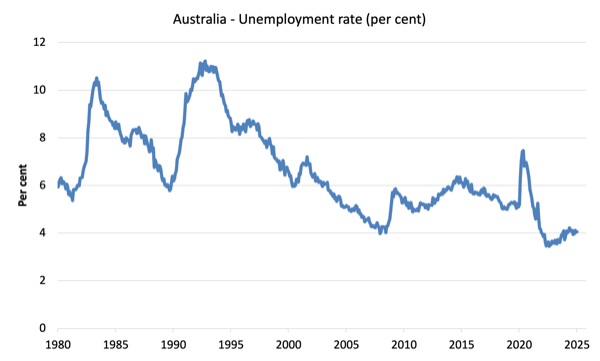
Unemployment rose by 3,000 in March
With total employment rising by 32,200 and the labour force rising by 35.3 thousand, official unemployment rose by around 3 thousand.
The unemployment rate rose by 0.01 points to 4.1 per cent.
The following graph shows the evolution of the official unemployment rate since 1980.
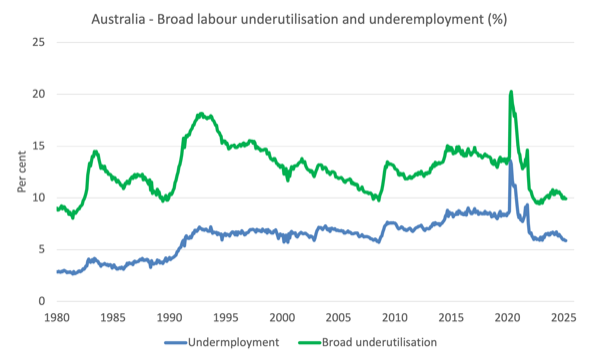
Broad labour underutilisation – 9.9 per cent in March
- Underemployment remained steady at 5.9 per cent (889.7 thousand).
- The Broad Labour Underutilisation rate (the sum of unemployment and underemployment) was steady at 9.92 per cent.
- Overall, there are 1503.6 thousand people either unemployed or underemployed.
The following graph shows the evolution of underemployment and the Broad labour underutilisation rate since 1980.
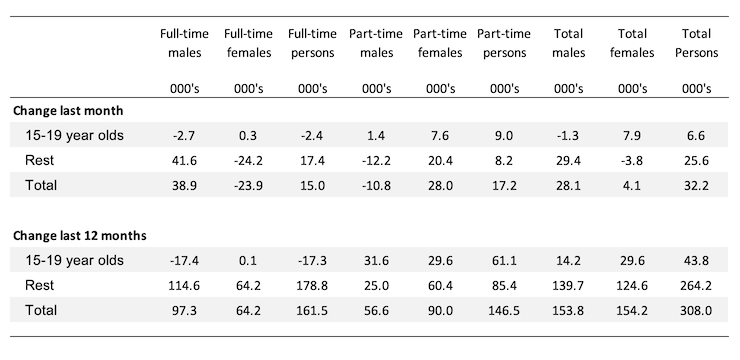
Teenage labour market – full-time employment losses
- Total teenage (15-19) employment rose by 6.6 thousand (0.8 per cent) in March 2025.
- Full-time employment fell by 2.4 thousand (-1.3 per cent).
- Part-time employment rose by 9 thousand (1.4 per cent).
The following table summarises the shifts in the teenage labour market for the month and over the last 12 months.
To put these changes into a scale perspective (that is, relative to size of the teenage labour force) the following graph shows the shifts in the Employment-Population ratio for teenagers.
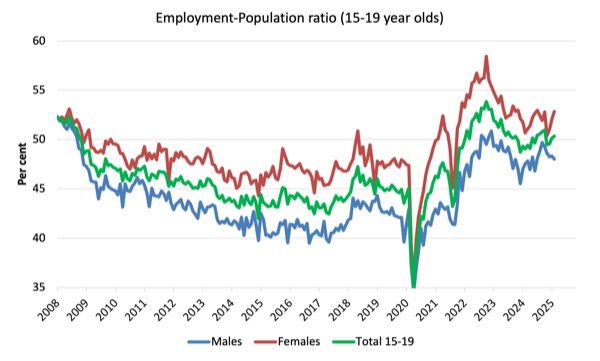
The Teenage Employment-Population ratios and their monthly changes in March 2025were:
- Males: 48 per cent -0.3 points
- Females: 52.8 per cent +0.8 points
- Total: 50.4 per cent +0.2 points
Conclusion
My standard warning to take care in interpreting monthly labour force changes – they can fluctuate for a number of reasons and it is imprudent to jump to conclusions on the back of a single month’s data.
- Employment growth rebounded in March from February’s negative figure but was modest – just keeping pace with the increase in the labour force, which itself was boosted by a rise in the participation rate.
- Overall, the labour market is not showing signs of a significant downturn yet.
- The broad labour underutilisation rate (sum of unemployment and underemployment) was 9.9 per cent, which puts the claims that this is a tight labour market into perspective. There is substantial scope for more job creation given the slack that is present.
That is enough for today!
(c) Copyright 2025 William Mitchell. All Rights Reserved.
Thanks, Bill. Australia should invest more in job creation to reduce underutilisation and support growth.
abdessamed gtumsila: Australia, like many countries, needs to achieve full employment with a lower GDP (and lower rate of natural resource throughput). It already produces enough to fully employ everyone who wants paid work. It’s about distribution and income needs to be equitably distributed using paid work as the main distribution mechanism, of which a Job Guarantee should play a vital role. The rich should be heavily taxed – a lot of the financial claims they receive are nothing more than economic rents (i.e., unearned). If the rich aren’t happy, they can go somewhere else and take their financial claims on real wealth with them, which wouldn’t be such a bad thing. It would reduce natural resource demands, which is what Australia needs. They would be doing us a favour.
Growth beyond what can be ecologically sustained is the root cause of virtually all our environmental problems.